

 Trade W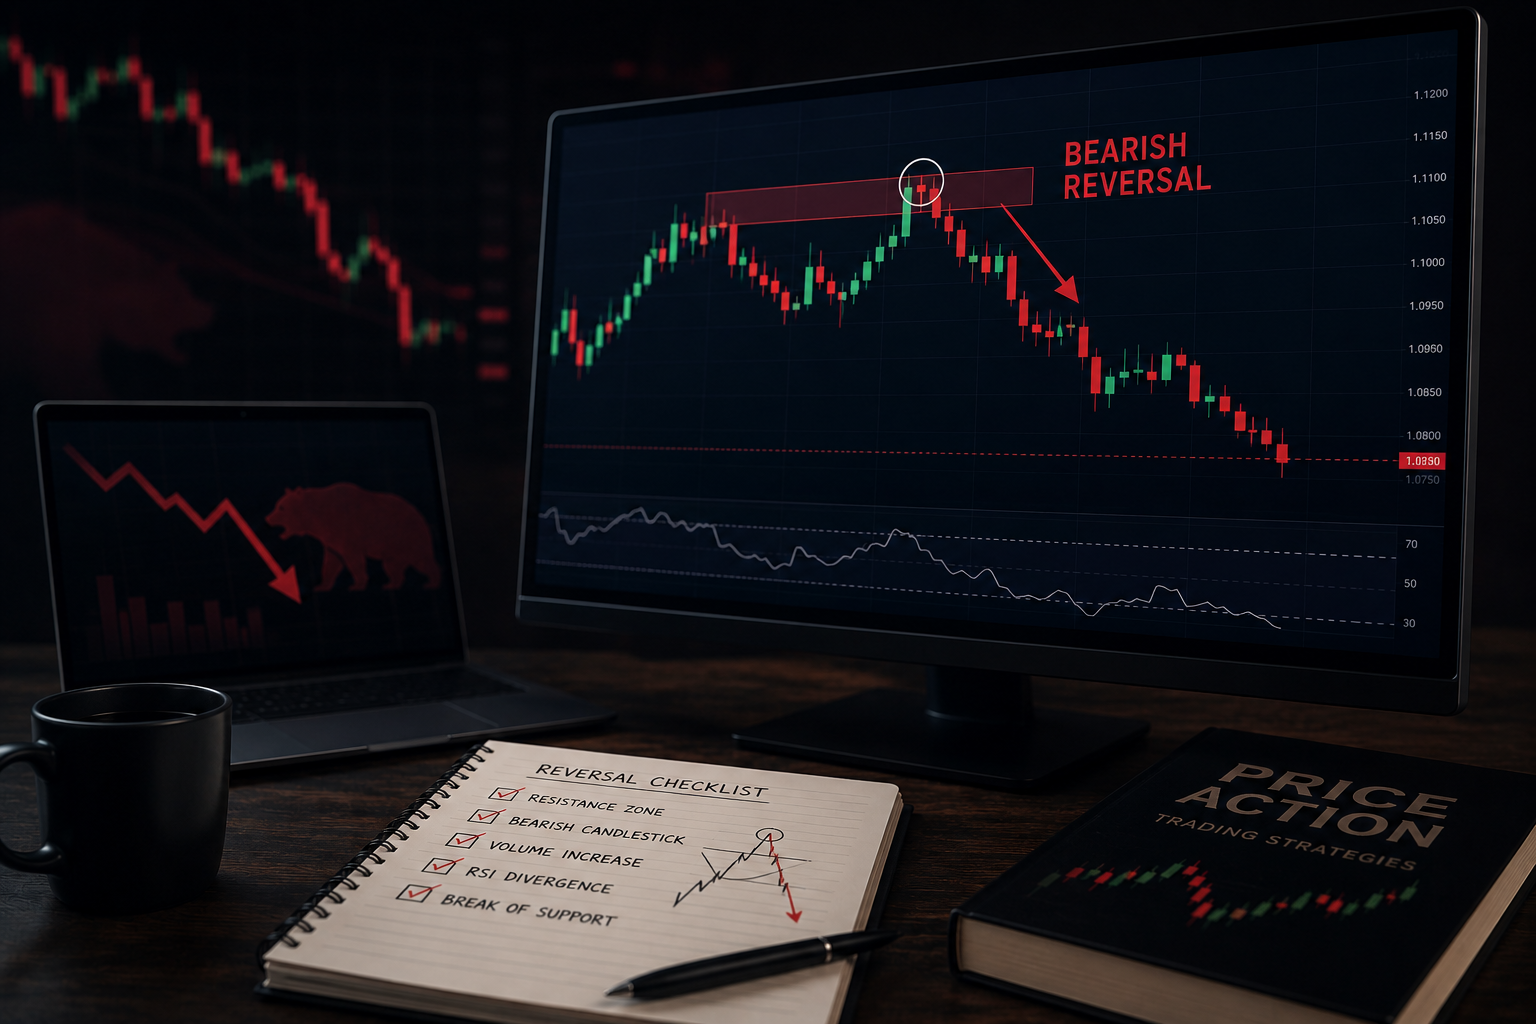
Bearish reversals represent a definitive change in trend direction from an uptrend to a downtrend. They reflect a complete structural shift in market behaviour, from upward price movement to downward price movement. Most new traders view downward price movement as some type of breakdown or malfunction, but rather than being a “glitch,” a bearish reversal is actually a warning signal. Traders who identify bearish reversals early can benefit while other traders are still trying to exit their positions before the final collapse.
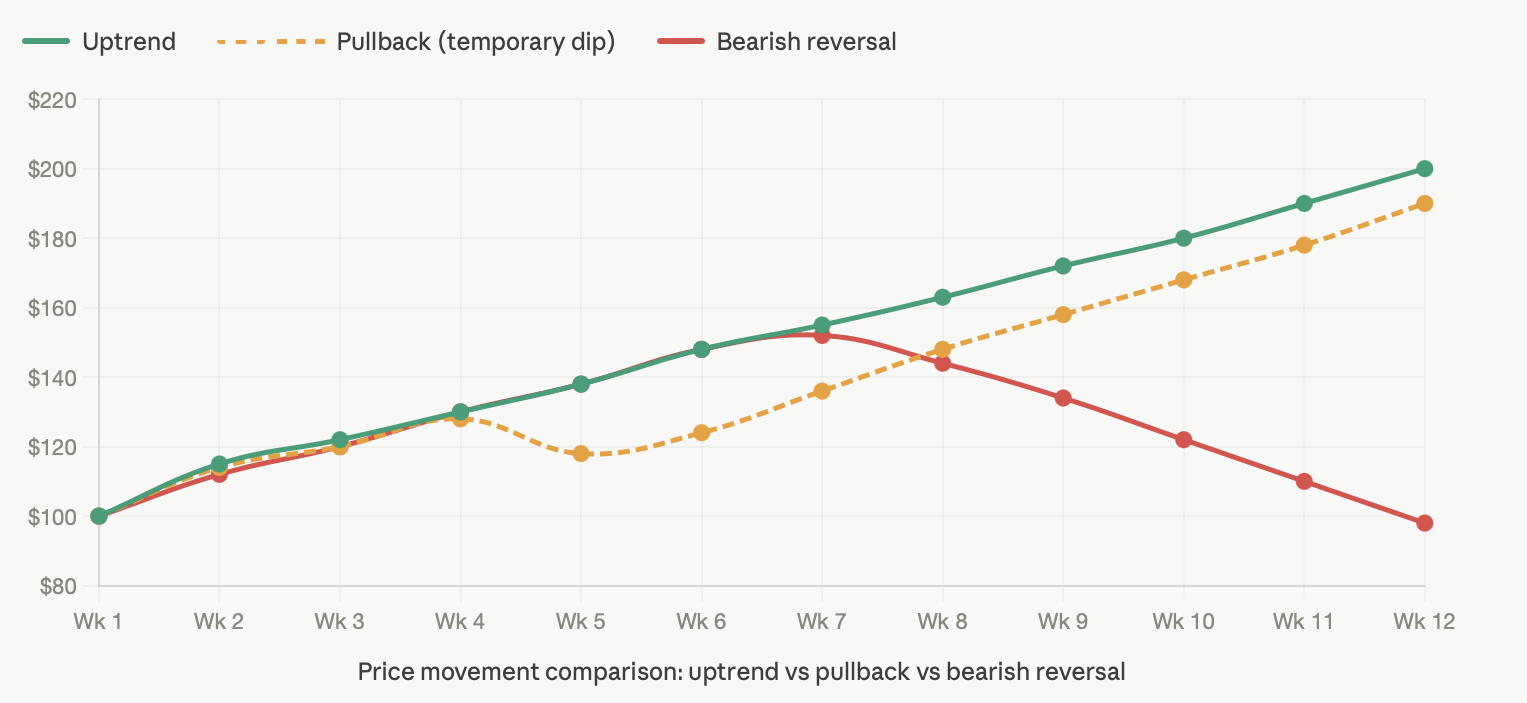
What distinguishes a reversal from other types of market activity is its structural characteristics. A pullback is simply a temporary downward move within an existing uptrend. After the price declines, it resumes moving higher. Consolidation, by comparison, is sideways price movement in which the market builds energy before making its next major move. A reversal, however, represents a double top and lasting change in price behaviour, often marked by lower highs, weakening support, and fading buying pressure.
Think of it like a student’s grades throughout the school year. If a student consistently earns A grades on every test, but then suddenly begins receiving C grades or lower for the rest of the year, that would represent a trend reversal rather than just a difficult week.
One of the clearest examples of a bearish reversal occurred in mid-2021 when Bitcoin reached an all-time high. After forming higher highs for several months, Bitcoin entered a distribution phase, shifted from an uptrend into a downtrend, and eventually lost more than 70% of its value. The market produced numerous warning signals before the full collapse occurred. Recognising a bearish reversal before a major market decline can make a significant difference for a trader.
Understanding Bearish Reversals Can Help You Make Money, Not Just Avoid Losses
One of the biggest mindset shifts a trader can make is learning to view falling prices as an opportunity rather than a problem or dead end. While inexperienced traders often see a price decline and rush to exit the market, experienced traders may view that same decline as an opportunity to enter a short position.
Falling prices do not eliminate opportunity. Instead, they create a different type of opportunity, one that allows traders to profit from downward price movement. Traders who fully understand bearish reversals not only protect their capital during market declines but also use falling prices as a way to potentially grow their accounts.
Most beginner traders focus only on one style of trading: “buy low, sell high.” This is known as taking a long position. Professional traders, however, can also profit through short selling. In a short trade, the trader sells an asset at a higher price and later buys it back at a lower price, profiting from the difference between the selling price and the buyback price.
For example, imagine Ethereum is trading at $3,800, and you identify that level as resistance. You recognise the formation of a bearish reversal and decide to enter a short position. If ETH later falls to $3,200 and you close the trade, you would have gained $600 per unit from the downward price movement.
By contrast, a trader who bought ETH at $3,800 and simply held the position would have watched the value of the position decline during the same period without benefiting from the move.
Both traders experienced the exact same market conditions, but their approaches to the market produced entirely different outcomes.
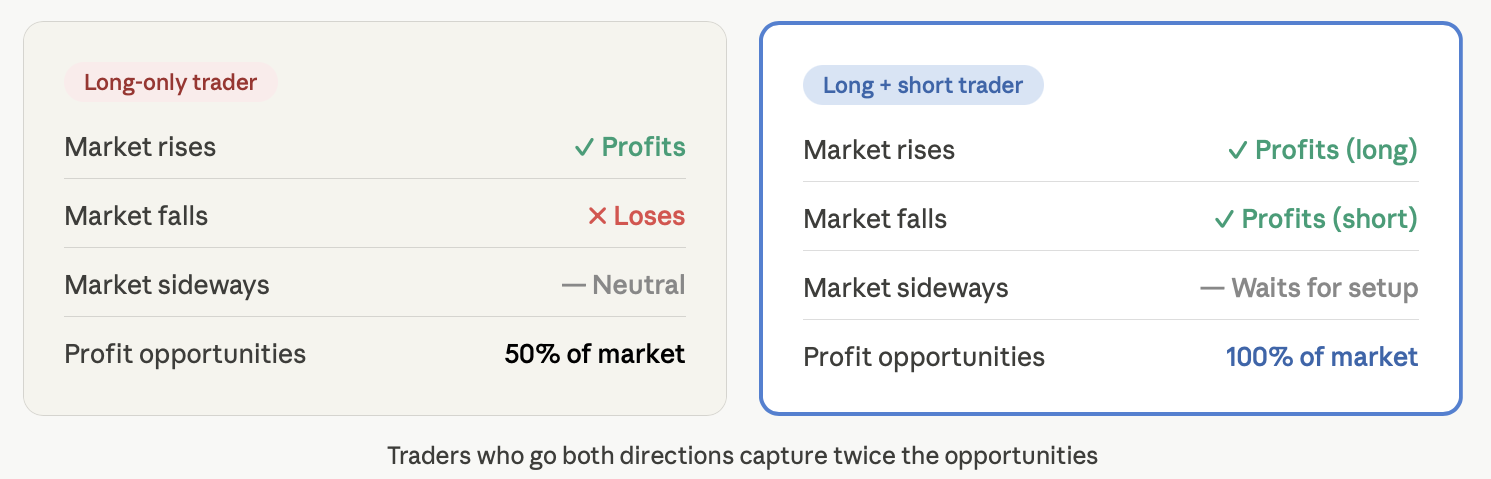
When you short-sell assets using a CFD platform, you are taking a position that benefits if the asset decreases in value. As the price of the asset falls, the value of your position increases. Once you decide to close a profitable trade, you earn the difference between the price at which you sold the asset and the lower closing price at which you bought it back.
Markets naturally fluctuate between bullish and bearish trends, but regardless of which trend is dominant, some of the strongest trading opportunities often occur during downtrends. Once you understand that opportunities exist in both rising and falling markets, your ability to trade effectively can improve significantly.
There Are 7 Bearish Reversal Signals That Traders Should Understand
No single signal can independently confirm a bearish reversal. Instead, traders look for confluence, meaning multiple signals pointing toward the same conclusion.
A. Price Action Signals
1. Lower Highs
Lower highs are one of the clearest early signs of a bearish reversal. In a strong uptrend, each new peak is typically higher than the previous one. When price begins failing to create higher highs, it may indicate that the strength of the uptrend is weakening.
2. Break of Support Levels
When the market breaks below established support levels, it signals that control may be shifting from buyers to sellers. During an uptrend, price often bounces from support zones multiple times. If price eventually breaks through those support levels and closes below them, it can confirm that the previous upward trend structure has weakened or reversed.
3. Trend Line Breaks
When price breaks below an upward trend line, it provides additional confirmation that the uptrend may be ending. Traders often draw trend lines by connecting higher lows during an uptrend. If price breaks through that support line with strong momentum or increased volume, it suggests that the trend structure itself may have broken down.
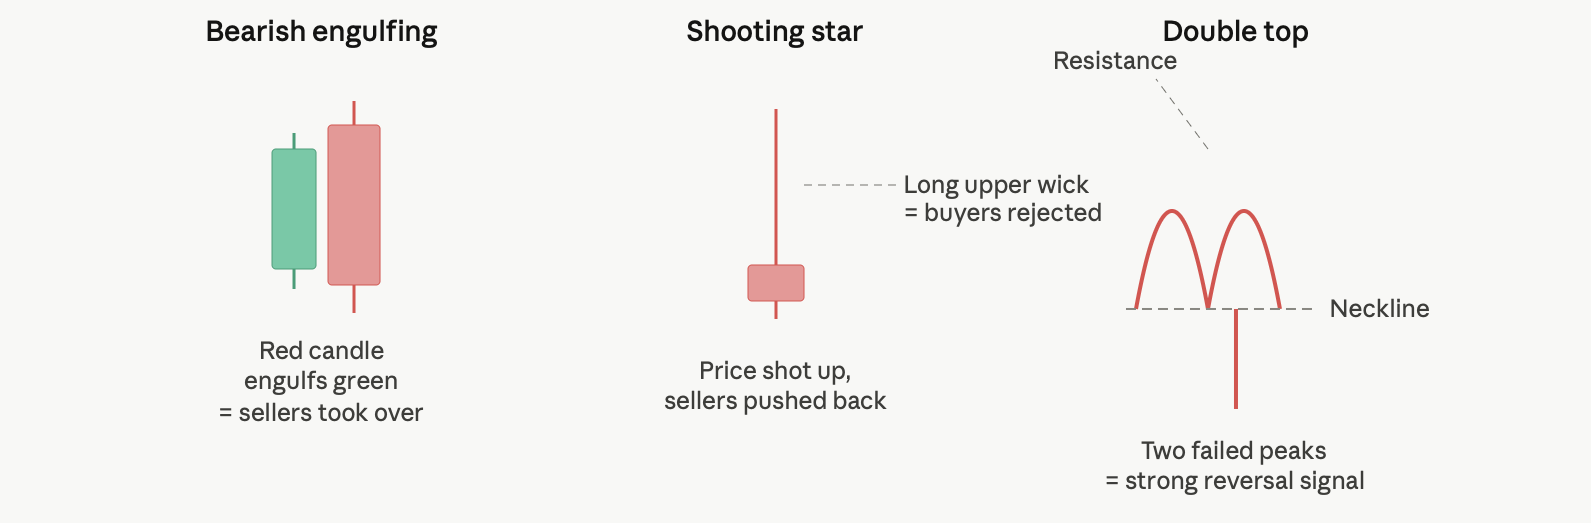
Bearish Candlestick Patterns
A bearish candlestick pattern reflects seller control in the market. While it does not guarantee that a market reversal will occur, it provides an additional layer of confirmation when it appears near a key reversal area.
Technical Indicators
One of the clearest warning signs of a potential market reversal is divergence on the Relative Strength Index. If price continues making higher highs while the RSI forms lower highs, it indicates that momentum is weakening even though price is still rising. This often represents a potential trap for inexperienced traders, while experienced traders recognise it as a warning sign near important resistance levels.
A bearish crossover on the Moving Average Convergence Divergence occurs when the MACD line crosses below the signal line, especially when combined with price rejection at a resistance level. This combination can indicate that sellers are beginning to take control of the market.
A volume spike on a bearish rejection candle should also be considered significant. When strong selling volume appears on a bearish candle at a resistance level, it may suggest that institutional traders are actively selling rather than the movement being caused only by retail market activity.
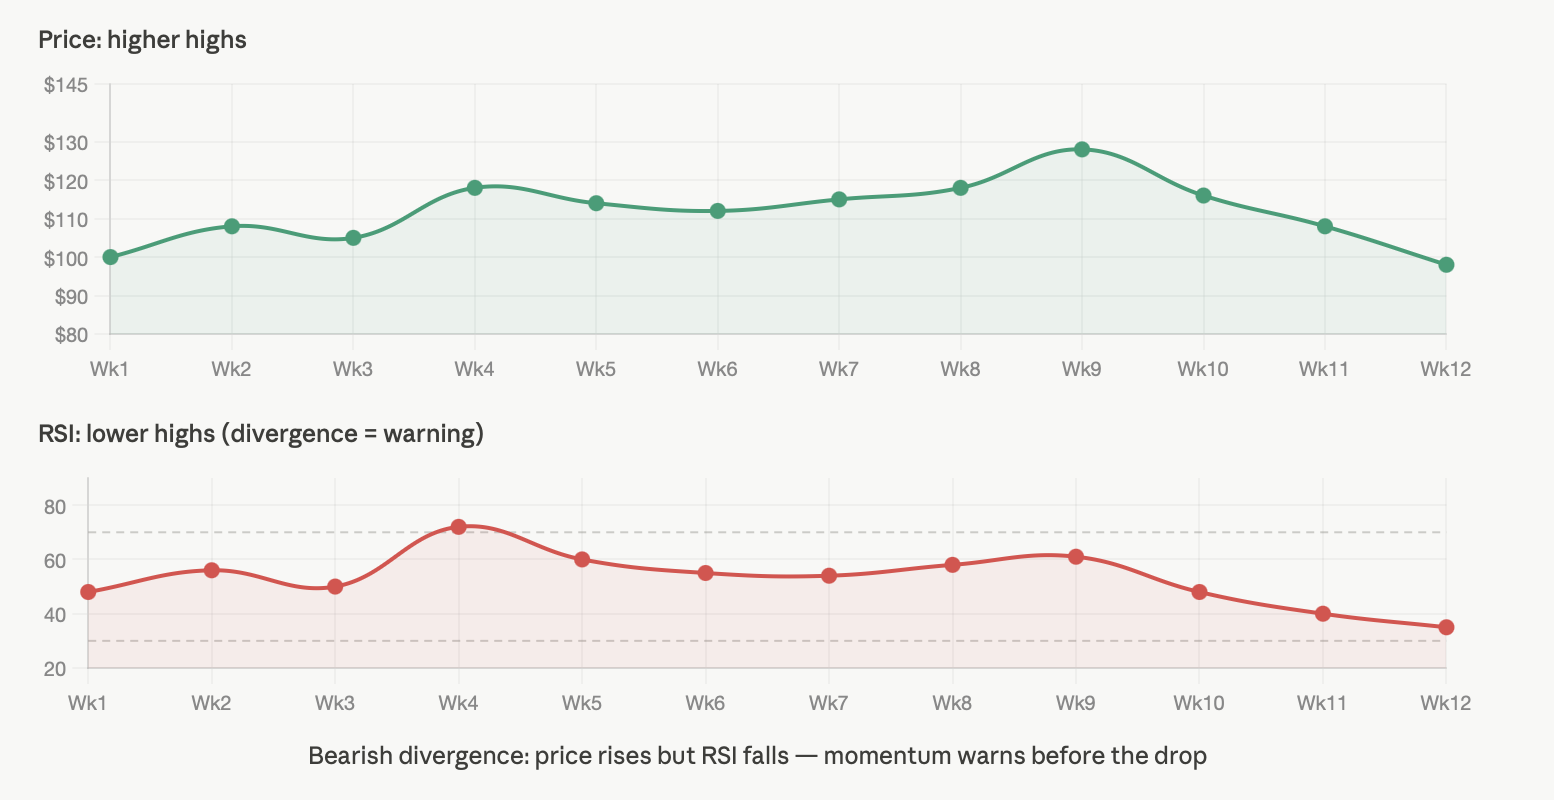
The basic guideline is this: do not rely on a single signal alone. Instead, look for at least two or three signals that support each other and together form a strong foundation for your trading decision. This concept is known as confluence, and it is what separates high-quality trades from poor ones.
If you have identified confluence, meaning multiple signals are confirming a bearish reversal setup, then you need a structured plan to follow. Below is a step-by-step guide for planning the trade.
Step 1: Identify the Key Resistance Area
You need to identify the price area where the market has previously rejected multiple times. These key levels may include previous highs, supply zones, or psychological round numbers. These areas often contain strong selling pressure.
Step 2: Confirm the Reversal Signals
Before entering a trade based on a single candle, wait for multiple forms of confirmation. This may include a bearish candlestick pattern forming at resistance, divergence on the Relative Strength Index, and a break below recent support levels. Combining several signals provides stronger confirmation of a potential bearish reversal.
Step 3: Place the Short Order on Tradewill
On Tradewill, you can open a short position by selecting the asset, choosing the “sell” option, selecting your position size, and executing the trade through the CFD platform. In a short trade, you profit if prices decline. Remember that when trading CFDs, you do not own the underlying asset itself; you are only speculating on its price movement.
Step 4: Set Your Stop-Loss and Take-Profit Levels
Place your stop-loss above the resistance zone where you entered the short trade. If the market reverses and moves back above that level, it indicates that your trade idea was incorrect. Your stop-loss should remain relatively close to the setup zone in order to control risk effectively.
Your take-profit target should be placed near the next major support level after entering the trade, with a minimum risk-to-reward ratio of 2:1 relative to your potential loss.
Step 5: Manage the Trade
As price continues moving in your favour, consider using a trailing stop-loss to help protect profits. Watch for signs that price may begin bouncing from support areas, and monitor volume along with any potential bullish reversal signals that appear while the trade is in profit.
Poor risk management can quickly destroy an otherwise strong trading strategy. One of the biggest differences between professional traders and traders who lose their capital is the disciplined use of stop-losses.
Top 5 Bearish Reversal Trading Errors And How to Avoid Them
Even traders who understand bearish reversal signals can still make common mistakes. Below are some of the most frequent errors traders make, along with what they should do differently to avoid them.
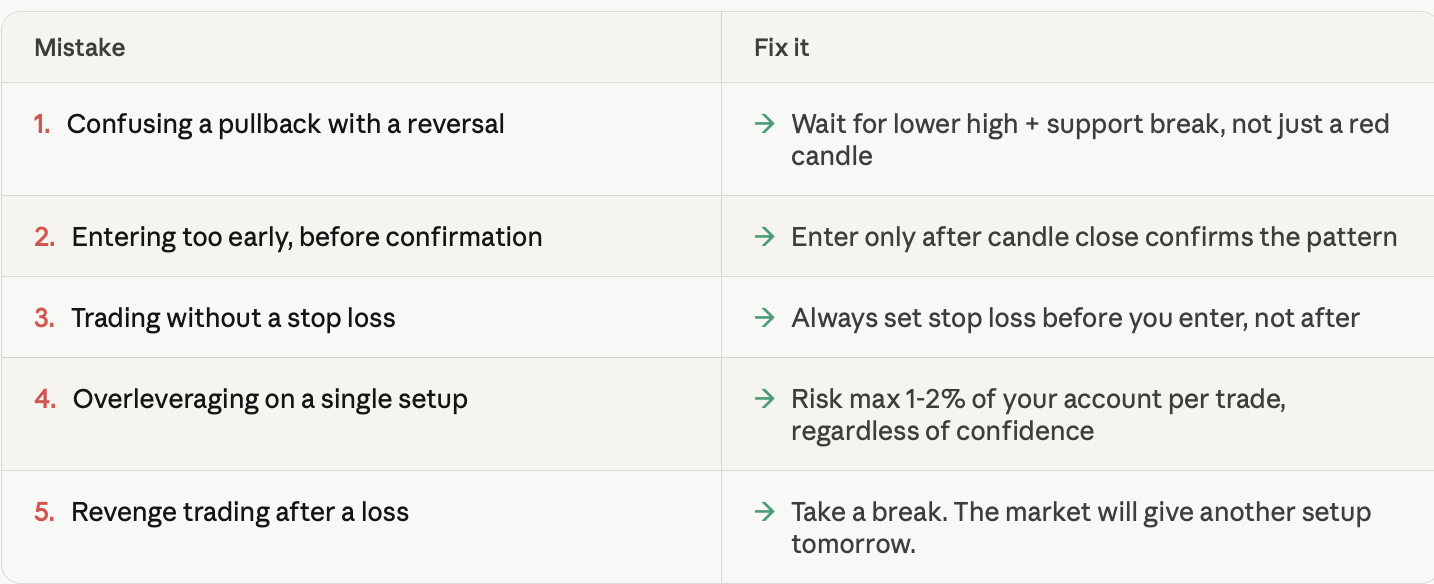
The most common cause of trading losses is emotional trading following an initial loss. Every time discipline overrides prediction, there is a permanent gain. You do not have to be right 80% of the time; you only have to manage your losses when you are wrong.
In the crypto space, the fourth type of error, or biggest mistake, is the misuse of leverage. Leverage magnifies both profit and loss. For example, at 10x leverage, a 10% move against your position can cause you to lose your entire account. Even when your trade is based on sound analysis, improper position sizing can still wipe out your account.
Real Market Case Study - A Bearish Reversal Results in a Profitable Short Position
We will identify a real example of a major bearish reversal pattern on Bitcoin. This tradable setup consistently appears across various asset classes and over many time frames.
Description of the Setup
BTC increased in value by 130% between 3/2020 and 11/2021, rising from $30,000 to $69,000 with a series of higher highs along the way. However, November 2021 brought about a change in direction for BTC.
Warning Signs of a Major Trend Change
There was a double top at the $69,000 level. The second top was created with lower volume than the first. In addition, the Relative Strength Index showed bearish divergence, with price making higher highs while the RSI peaked at lower levels. Finally, the Moving Average Convergence Divergence was rolling over, and the initial major support level around $58,000 was broken on high volume.
Entry on the short at the break of the $58,000 support level. Stop-loss above $62K, the last swing high. Take-profit target at $42K, which was the next major support zone.
Outcome
Bitcoin dropped to $33K in the following weeks, moving considerably beyond the original target. The risk-to-reward ratio exceeded 1:5.
The key point is not the profit itself, but the ability to replicate this type of trade. The double top, the Relative Strength Index divergence, declining volume, and break of support are patterns that occur repeatedly across all charts, time frames, and asset classes. Once you recognise these setups, you will begin to see them everywhere.
Real setups create repeatable opportunities. This is your edge.
Final Thoughts: Master Bearish Reversal Trading and Profit From Market Declines
A bearish reversal does not necessarily mean something bad is happening. A bearish reversal represents opportunity.
Traders who lack this understanding often exit their long positions after the market rolls over and then wait for another opportunity. Traders who understand reversals, however, use the market rollover as an opportunity to enter short trades with defined risk and clear reward targets.
There is no need to predict the future. You only need to understand market structure. Lower highs, broken support, Relative Strength Index divergence, and bearish candlestick confirmation at resistance are not random events. They are recurring patterns that reflect changes in market behaviour.
You do not need to do anything special to learn this skill. All you need to do is continue practising and looking for these signals, while paper trading them, until you develop an instinctive feel for what they look like and how they perform when applied as part of a profitable trading strategy.
Traders who repeatedly make money during downturns, or bear markets, are not necessarily more intelligent than everyone else. They have simply developed the ability to recognize patterns that most traders fail to notice and then act on those patterns with discipline by using proper trade management techniques.
Are You Ready to Start Trading the Next Bearish Reversal?
Stop losing money every time the price of an asset declines. Open a short position on Tradewill when the signals align so you can take advantage of trend changes, not just bullish upward trends.
Go to Tradewill Demo Account and open a demo account so you can practise your first bearish reversal trade without risking real capital before trading live.
Disclaimer: The content of the blog does not represent any position of Trade W, does not serve as any trading-related decision advice, and does not endorse any third-party.