

 Trade W

1. What Is the Break and Retest Strategy?
A majority of traders will blow their accounts chasing breakouts. They are excited when the price breaks past a defining level until it turns around and heads back down. Are you familiar with this? This is precisely what the best break and retest strategy is designed to eliminate.
The strategy is very simple. A breakout occurs when the price breaks through a significant level of support or resistance. The retest will occur after the breakout has occurred. The price will pull back to the level it just broke through to test if that level is still valid. The previous level of resistance will act as new support, and prior support will act as new resistance. After the retest confirms the level has switched roles, that will be your entry point.
Think of it as a basketball player breaking through the defence. The player does not take off and run at the hoop blindly. They will check for an opening before they take off. The player's check is the retest. The check provides confirmation that the player is disciplined as opposed to being a gambler.
For instance, the EUR/USD breaks through the resistance level of 1.1100 on a daily chart. Subsequently, the price will pull back and re-test the resistance level of 1.1080 before finally providing confirmation by creating a bullish candle at that level. This is now your signal to set up a long trade with a tight stop loss just below the retest zone.
New traders tend to skip the re-test and instead buy into the breakout without waiting for confirmation. When the price returns to the breakout level, the new trader will be stopped out.
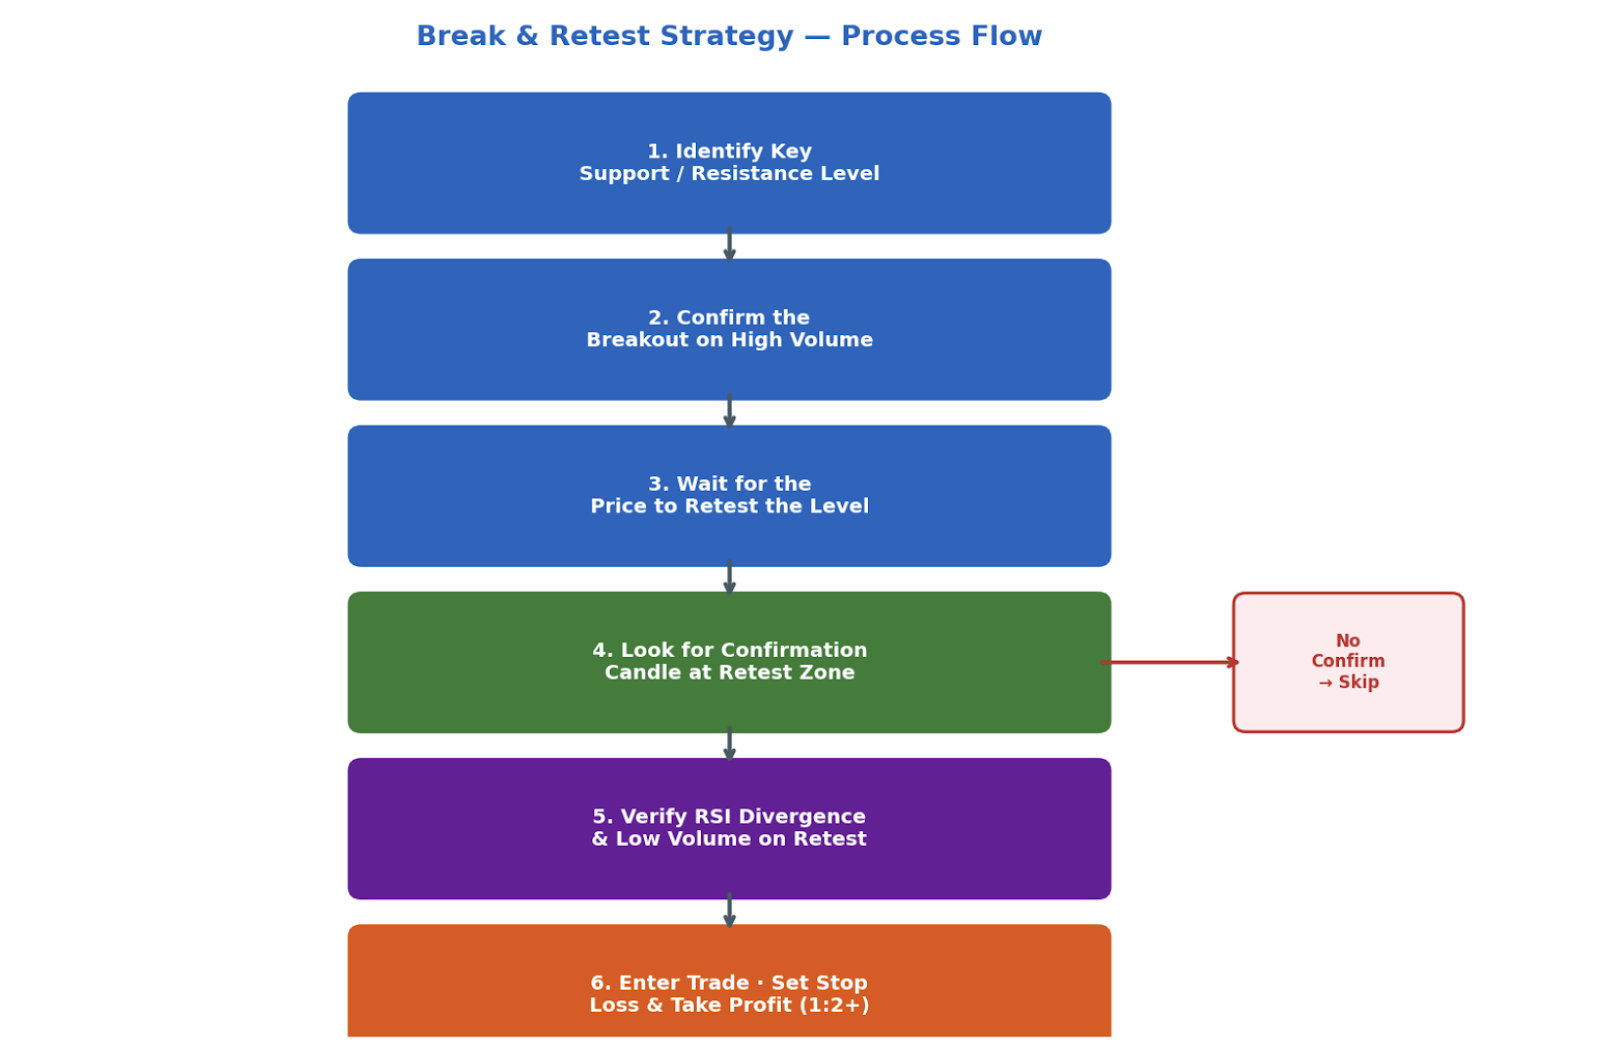
The ironic part about this is that the return to the breakout level is actually your setup for the trade. The best break and retest trading strategy will create an opportunity instead of a loss from a price pullback. This is one of the most reliable price action methods to trade because it confirms that the price has re-established a breakout before you enter a trade.
2. The Core Mechanics: Understanding Entry Signals
To successfully trade this set-up, you need to know what's happening beneath the surface. A breach of a resistance level indicates that buyers have successfully beaten the sellers at this level. However, markets don't move in one direction.
After a big move, traders take the opportunity to take profits, and new short traders will enter the market; the price will pull back towards the point at which it broke out. This is completely normal; all you're looking for is confirmation that the level you're at either holds or does not.
If the level holds, it tells you that the breakout was valid, the prior resistance had selling pressure absorbed and will now provide support. This is your cue to enter.
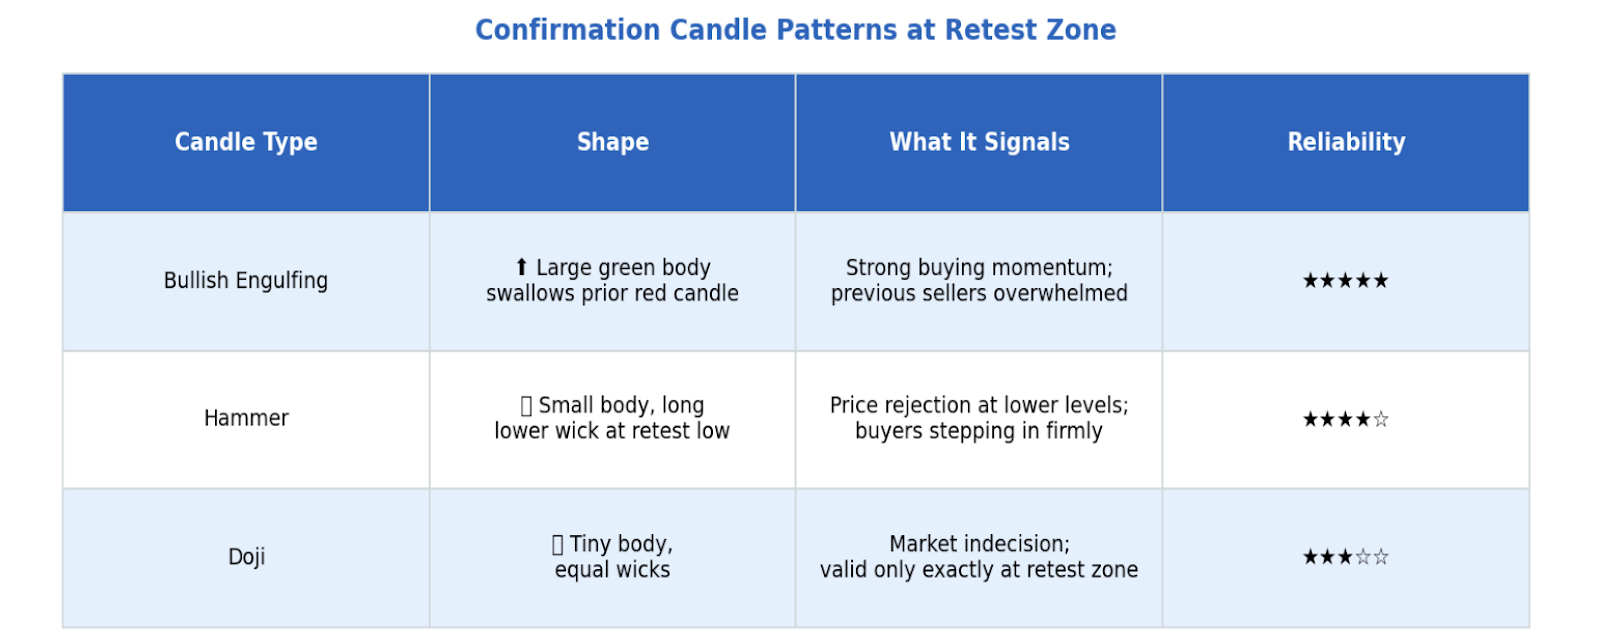
Your absolute best friend at this point will be your confirmation candles. You'll want to look for three patterns:
- Engulfing candles indicate a complete reversal of the previous candle and signify strong momentum in the direction of the trade.
- Hammers that form at the bottom of the retest are signs of resistance near lower prices and indicate a possible rejection of lower prices.
- Doji candles represent indecision but can indicate a turning point when they are located right in the retest zone.
Using a multi-timeframe analysis will also help make the setup easier to validate. You will want to conduct your validating analysis using either the daily or 4-hour chart to identify the overall trend and the breakout level, and then switch to either the 15 or 30-minute chart to time your entry during the retest.
For example, if EUR/USD breaks 1.1200 on the daily chart, you would switch to the 15-minute chart and wait for an engulfing candle at 1.1200. If TSLA breaks its 50-day moving average, you would verify on the 1-hour and enter during the retest.
A combination of the trend alignment, retest confirmation, and entry candle will provide you with three different layers of validation before you risk any capital in the trade.
3. Using RSI and Volume to Sharpen Your Entries
The majority of successful strategies for break and retest do not just utilise price as an indicator. Using the RSI indicator and volume will help eliminate a huge portion of the bad setups.
If prices are making higher lows while the RSI is forming lower lows during a retest, it indicates that momentum has built up despite the price declining a bit.
If prices are making lower highs while the RSI is making higher highs during a retest, it indicates that there has been significant momentum built up, although the price may have declined slightly.
When you see divergences developing right at the retest area along with high volume at the breakout point, the likelihood that you will be able to succeed with your trade is dramatically increased.
Volume also plays an important role, having two separate phases. First, there will be a large increase in volume during the breakout, which will help provide you with confirmation of the conviction behind the breakout.
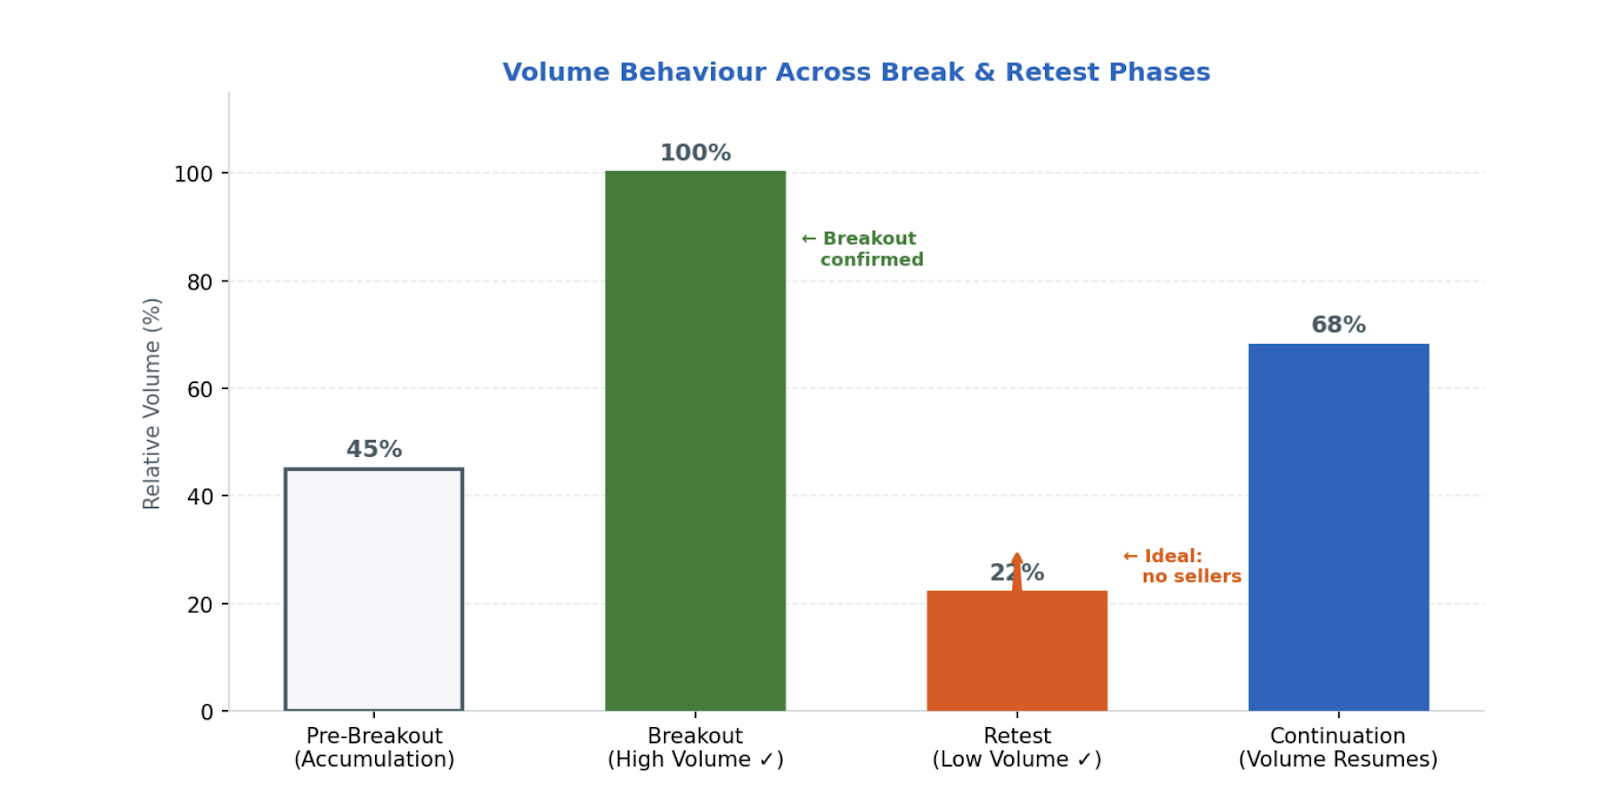
When the market begins its retest of the breakout area, volume will also decline dramatically. If there is significantly less volume during the retest, it usually means that the sellers have stopped pressing the downside and have taken any remaining profit or are taking profits, but there has been no indication that they are reversing the bullish trend.
When the market is beginning to move away from the retest point, and you see a confirmation candle develop after volume has declined significantly, then you can be fairly certain that it will continue to move in its direction and have a better quality setup.
Consider you are playing a video game and have just completed an incredibly difficult level. Before going to the next room, you would pause the game, pull up the game map and ensure there were no traps in the next room. The RSI and volume indicators are your assistance in verifying where the traps are in your play.
For example, on the GBP/USD daily chart, the GBP/USD broke through the 1.3400 resistance level on a large volume spike. During the retest of the support level at 1.3380, the RSI has developed hidden bullish divergence. In fact, check the volume of the retest as it was dropped in volume after the price rose. You will be able to take a long position with a stop-loss below the last swing low of 1.3360. This is a defined risk trade and a high probability trade.
You can also apply similar logic to stocks, where you will see that stocks such as AAPL and MSFT have all broken out of their previous consolidation zones.
For example, gold broke through a significant level of resistance with a significant spike in volume, reached a new level of support during the retest with low volume, and has established a new high. This is one of the most difficult setups to find when trading CFDs.
Using the RSI indicator and volume to confirm levels of support or resistance will not provide you with a guarantee of your trade, but it will provide you with the closest thing available to guarantees in trading using technical analysis techniques.
4. Multi-Timeframe Analysis for Optimal Entries
Trading on one timeframe is similar to using a narrow street map instead of one that shows you everything in the city - you need to see the whole area too.
This is why, with the multi-timeframe approach, one examines the trend direction and key levels on a higher timeframe chart before determining exact entry points on a lower timeframe chart; this helps to separate out the signals from all of the noise around us.
The process begins by using a 4-hour or daily timeframe, examining the current trend direction - up or down - and whether the price has broken a significant support level. The more significant that level is, the further out from it the market will continue until there has been a successful retest.
If you find that your direction and confirmational trade entry have already taken place on the higher timeframe and you want to wait for a retest on the lower timeframe, start watching the lower timeframe live. This isn't about guessing the timing of the retest. You now have the level that you want to retest, the direction of the trend, and you're just waiting for it to retest and confirm.
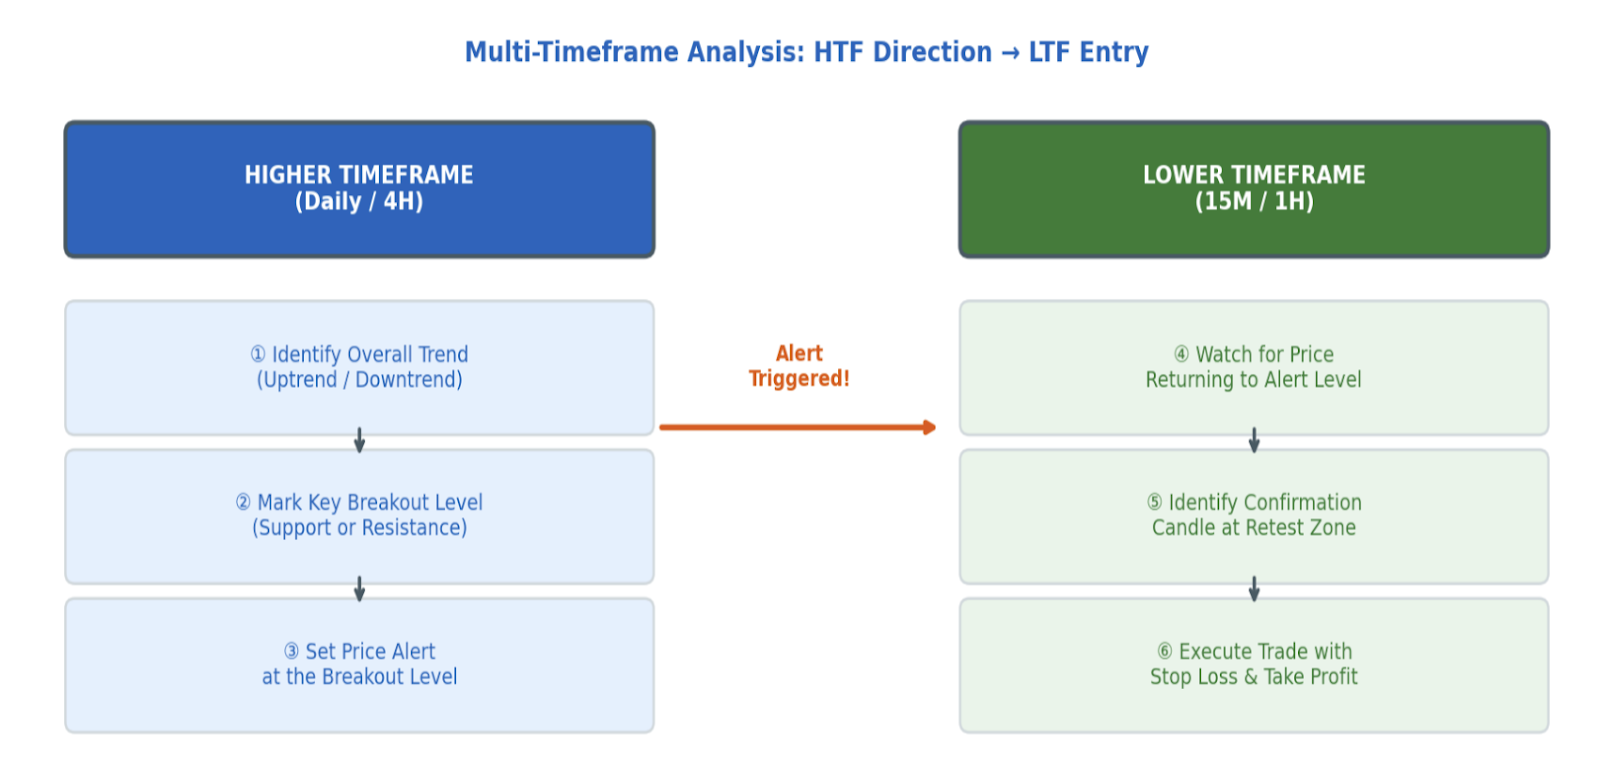
If you're planning to trade EUR/USD and you see the price break the 1.1200 level on the daily timeframe, for example, you set an alert on your trading platform at 1.1200 to notify you when that price level has been reached. When it does, and two days later, the lower timeframe is showing a price pullback down to the same level, and you find a hammer candle formation with it.
When it comes to trading TSLA, suppose that the price trades far above the 50-day moving average on the daily timeframe and after a period of time on the hourly chart, the price pulls back to that same moving average and displays an engulfing candle pattern. You could enter long on that trade with a stop at the moving average. Therefore, it is a high probability entry.
The benefit of this practice regarding risk management is that your protective stop will be placed just below the retest zone. This leaves you with a very small amount of risk taken in comparison to the potential size of the upward move if everything goes according to plan with the HTF trend in your favour; therefore, targets at two or three times your risk are reasonable.
In addition to increasing your win rate through multi-timeframe analysis, you will also improve your reward-to-risk ratio on every trade because the retest levels will have been validated multiple times before taking entry traders.
5. Risk Management: Avoiding Fake Breakouts
There's no single strategy that guarantees to work every time. Fake breakouts are a common occurrence and will continue to happen regularly. An effective way to reduce your risk at the entry into a trade using the breakout and retest strategy does exactly this by building a risk-controlled entry basis into the trade setup. However, it is essential to have a contingency plan for when you execute a trade that fails.
Fake breakouts will show you they are fake before you take them. The breakout failed to create enough volume during the initial breakout, telling you there is no real conviction. Confirmation candles are missing, and the price has exhibited indecision and/or the price has just barely closed above the breakout level before retracing back.
Using the discipline of waiting for confirmation before entering the trade provides you with an opportunity to reduce the number of fake breakout trades you execute; however, it does not eliminate fake breakout trades. Price can break convincingly, pull back and show signs of holding and then fail. Therefore, the use of a stop loss is not negotiable.
When you're going long, your stop should be placed just below the retest zone; when you're going short, it should be placed just above the retest zone. If the price was a legitimate support price, and the price trades back below that level, then you have a problem, and there is no way for you to make an argument or hope for a price retracement.
For example, the EUR/USD broke through 1.1000. There was a retest, but there was no confirmation candle, and volume was low. You entered the trade anyway. The price then retraced and traded back below 1.1000. With no stop, you are holding the position, losing trade with an exponentially increasing loss. With the stop placed below the retest zone, you are out of that position immediately, preventing you from taking any additional losses.
Another way to look at this is in reference to games. You start towards a wide open gap through which to move; however, it's a trap. If you stop immediately instead of moving further into the trap, you maintain your life towards the next possible opportunity.
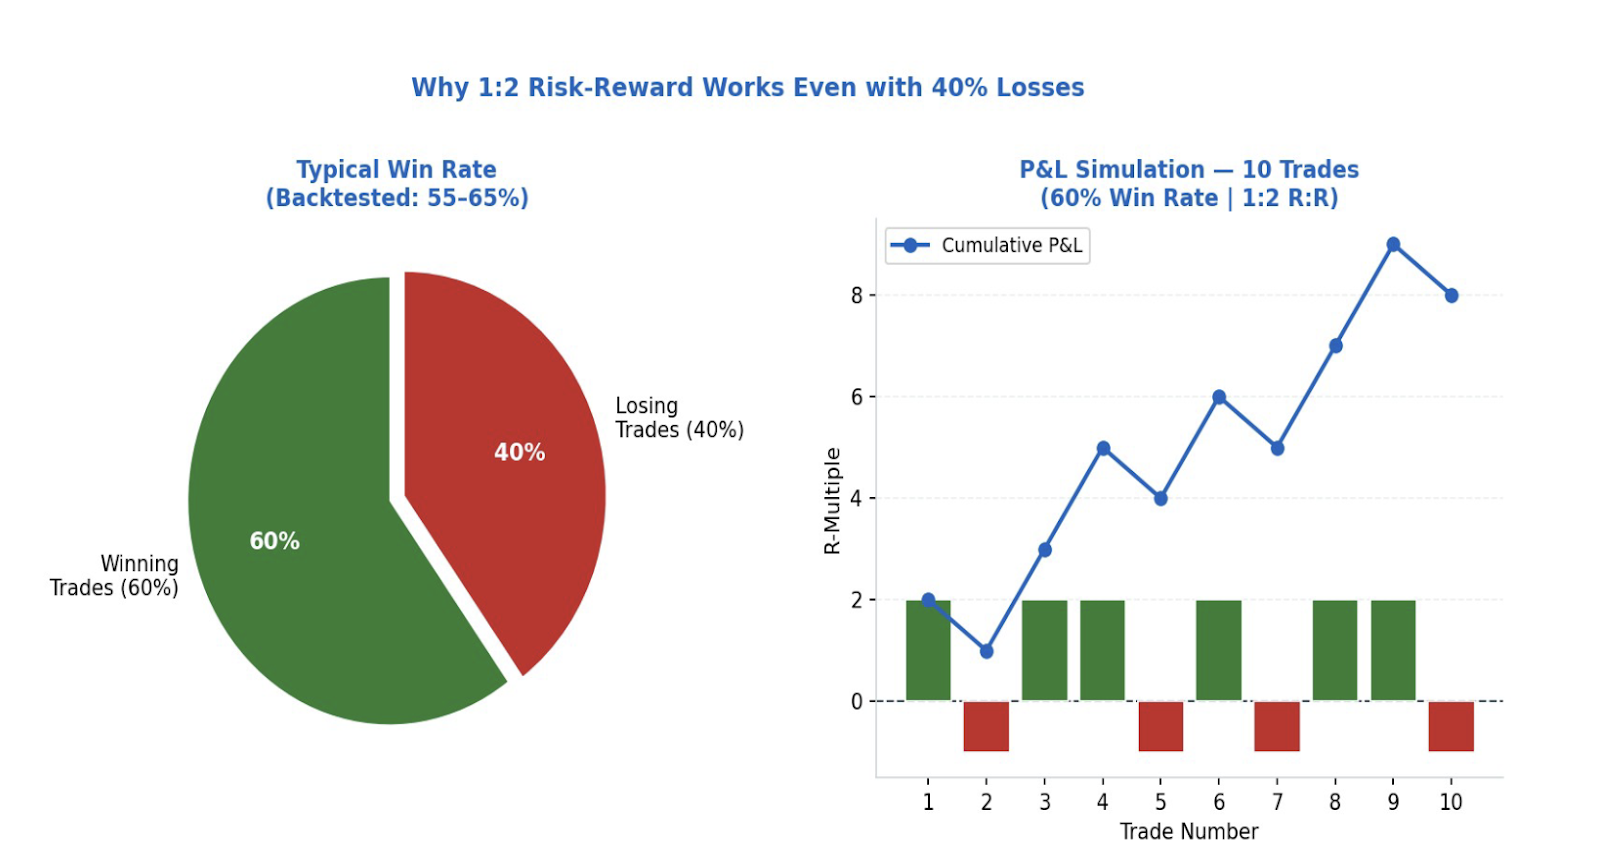
Aim for at least a reward-risk ratio of 1:2. For example, if you risked 30 pips, your target should be at least 60 pips; for a 1:3 ratio, the risk becomes far less significant because you can afford to lose 40% of the time and still be profitable with a consistent 1:2 reward to risk.
6. Step-by-Step Practical Trade Examples
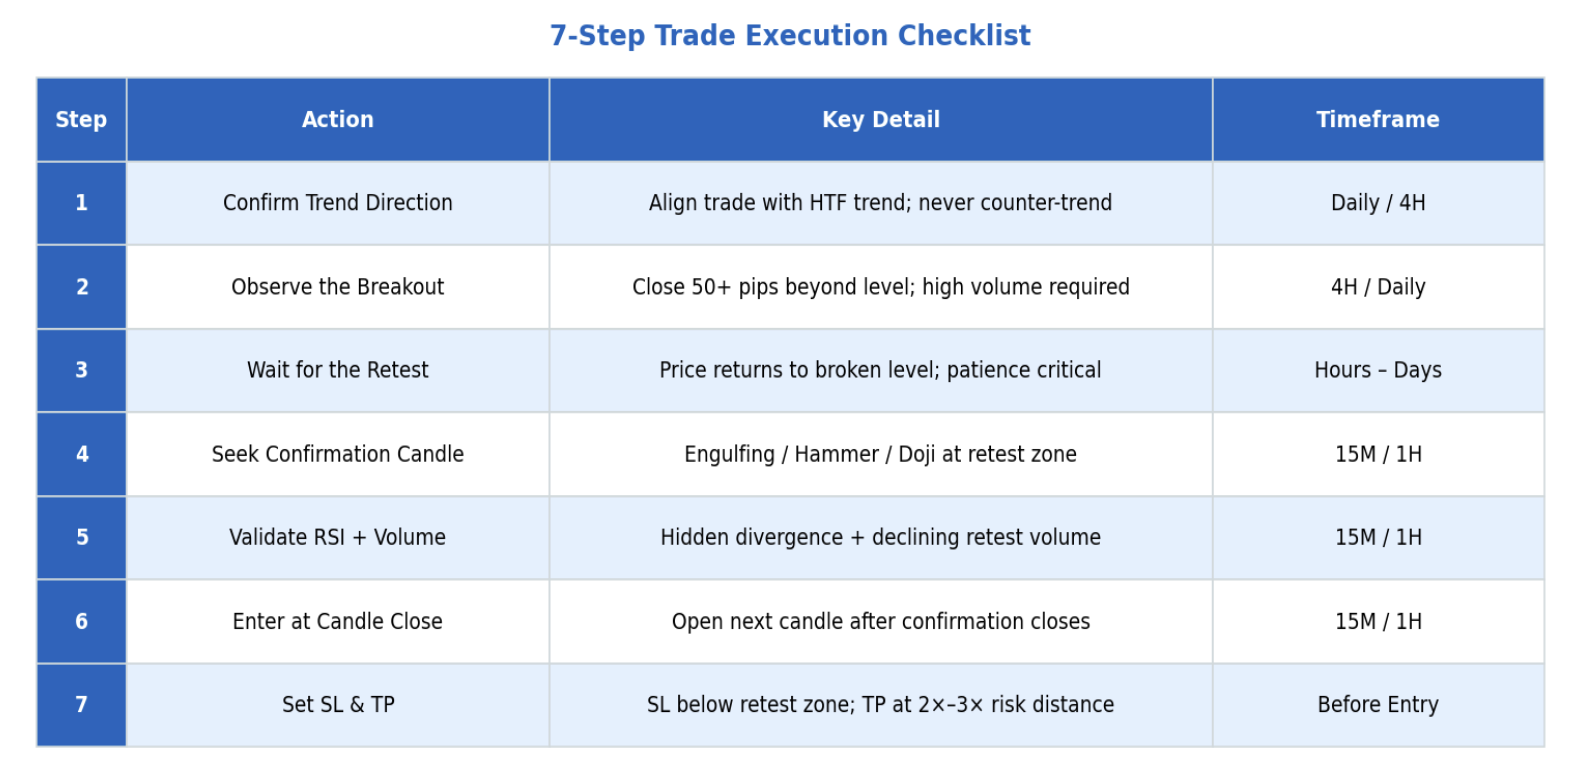
Here's exactly how to execute a trade using this strategy from start to finish.
Step 1: Check if the trend is confirmed on a larger timeframe. You want to make sure the overall trend is in line with the direction of your trade. Never trade against the trend.
Step 2: Observe the breakout. Watch for whether or not the price closes at least 50 pips away from the key support or resistance level that has been broken by an increase in volume. You cannot consider weak or indecisive closes to be breakouts.
Step 3: Be patient and wait for the retest. The price should return to the level that was recently broken. This could happen in as little as hours or take up to days to do. Being patient is a part of the strategy.
Step 4: Look for confirmation. Find a 1-hour or shorter chart to search for an engulfing candle, hammer, or some other reversing pattern at the same place where the price retested.
Step 5: Use the RSI indicator and volume to confirm the trade. Check the RSI for a hidden divergence and ensure the volume was very low during the retest. It's a high-quality setup when both signals occur together.
Step 6: Execute the trade. As soon as your confirmation candle closes, you would like to enter your trade at the open of the next candle.
Step 7: Determine your stop loss and take profit exit target area. For a long trade, your stop loss should be placed just below the retest zone. Your take-profit exit target area should be 2 to 3 times the distance of the risk you took in the trade.
Example of Forex Trading with this Breakout Retest Strategy - The EUR/USD broke the 1.1200 level on the Daily chart. I waited for a pullback to this level. The price on the 15-minute chart returned to the 1.1200 area, with a decrease in volume and hidden bullish divergence on the RSI indicator. A bullish engulfing candle formed and closed exactly at the 1.1200 breakout, thus I entered into a long trade at 1.1205. My stop loss was at 1.1185, and my take profit was $1.1245. The amount for my risk was 20 pips, and the reward was 40 pips.
Example of a Stock Trade with this Breakout Retest Strategy - The TSLA broke below the 50-day average at around $240. On the 1-hour chart, the price returned to this same level of $240, forming a hammer with low volume. The RSI showed hidden divergence. The overall setup was confirmed, and I entered a long trade at $241 with a stop loss of $237 and a take profit of $249.
This is the most actionable form of the best break-and-retest trading strategy. Each step is designed for a specific purpose, and you will not be left guessing.
7. Advanced Variations: Double Retest and Multiple Breakouts
The addition of more sophisticated chart setups to your trading plan enhances the structure of your plan once you are confident enough with your basic trading setup.
The double retest refers to an additional confirmation of a price move after it has crossed a support or resistance level, pulled back, failed to confirm on the first try, pushed below where support would be found, eliminated weak sellers who may have pushed too far out of the market, and returned to what would be seen as a successful support retest.
The volume that returns with a second retest tends to produce a much more reliable potential entry point because the original short sellers from the first retest have been removed from the market due to the stop losses that were hit during the previous failure.
As a result, the subsequent movement upward following a successful second retest will be much larger because those shorts who would typically sell again at the first retest are now gone.
Another advanced breakdown setup occurs when multiple breakout levels from previous trending moves create possible support or resistance for a downward move.
Your ability to build your price structure knowledge will create additional entry points off the different support or resistance levels for entry.
The use of different tools that can confirm a trade through the assistance of various MACD crossovers can be combined to give you a clearer understanding of how strongly the relation to price is moving.
Since there is so much fluctuation in the market and lots of uncertainty about the future, traditional Use by traders relies on a unique set Fixed At It Will Change Based On Actions Occurred But Does Not Have Fixed Numbers That Will Provide Absolute Freedom Like You Would See With The Movement Of A Trading Pair.
Exit quickly if your retest fails - if you have taken a position after retesting and the price creates strong impulse momentum and breaks through the level immediately after your retest, you should exit immediately. This indicates that the trade has failed. Avoiding your loss will help avoid larger losses if you have an active trade.
Short-term trades on both NASDAQ and S&P500 typically provide many opportunities for double retests, especially during earnings seasons, giving participants a lot of volatility along with many opportunities for retracement to enter trades on the same day.
8. The Psychology Behind Why This Strategy Works
Technical setups do not operate in isolation; rather, they are a product of human behaviour. The break and retest pattern represents the collective psychology of traders in the market.
The fear of missing out creates panic among traders when a price breaks resistance, causing them to want to enter. However, some traders will chase the price, while others have enough discipline and will wait it out. Both types of traders will help create the retest.
The retest represents where the price will settle back near its original level or establish an equilibrium point for the price. This occurs either when profit takers exit the market or when new buyers cautiously test whether they want to enter the market. A true demand level can be established if the price bounces off the break level. If not, it will display itself as a false break very quickly.
Many inexperienced traders enter positions during the initial breakout and therefore place their stop loss far away from their entry price, or do not use a stop loss at all. As the market is still confirming demand through the retest, the inexperienced trader gets shaken out of their position right before the larger breakout occurs, while others are unable to enter trades at exactly what they expected.
To successfully wait for the retest takes discipline, and that discipline is your trading edge. Most retail traders have difficulty waiting idly by while prices move without them, while professional traders will sit tight because they know a better entry point is coming.
This is why the psychology of trading cannot be separated from the strategy of trading. It is both the strategy, with the technical setup as the map and the discipline to follow the map instead of randomly changing course.
9. Backtesting and Historical Performance
Verify a strategy based on historical data before risking your own money, which builds confidence and shows weaknesses in a strategy by backtesting it as follows, using multiple timeframe assets and multiple global market assets. A great break and retest strategy should show you a win rate between 55% and 65% when backtesting over time, if executed with quality setups.
Backtesting requires looking back at historical price charts of EUR/USD pairs, AAPL stock, or the price of Gold. Identify all recent breakouts at key price levels and mark all recent price retests back to key price levels. Record whether each retest has held or failed. Record the entry price for all valid trades, stop loss points, and take profit points so you can establish a winning percentage and average Reward to Risk ratio.
Backtesting with RSI and volume filters helps improve the win rate. Where both filters create a valid setup, those trades win more than the same types of trades based on price action only.
Keep your results organised in a simple spreadsheet tracking the date, asset, breakout point, retest point, confirmation method, entry, stop, target, and outcome. Reviewing the results of 50 to 100 trade setups, you will start to see statistics indicating which asset and timeframe produce more clean setups based on your trading style.
In addition to the confidence of historical validation, this helps set performance expectations. Although the average win period of any strategy is less than 50%, the average regular statistical variance of your historical win rate indicates that losing streaks like five consecutive losing trades are not a reason for concern, but rather typical statistical variation in your trading method.
10. Position Sizing and Risk Optimisation
No matter how good your strategy is, if your position size is out of proportion with your account size, you'll blow up your account. This is one of the most forgotten aspects of trading.
The general rule of thumb is that you should never risk more than 1 to 2% of your account on any individual trade. So if you have $10,000 in an account, you should only be risking $100 to $200 per trade. Then you must calculate your position size based on the amount you risked and the distance you will put as your stop loss.
Using an ATR-based stop loss will help you further refine your stop loss calculation. You can use an ATR indicator to look at the volatility level of the market, whereas with a standard stop loss, you will set a fixed number of pips from the 'retest' zone. Thus, when the level of volatility is high, you'll use a wider stop loss, and when the level of volatility is low, you'll use a tighter stop loss. The amount you risk will remain the same; just the size of your actual position will change depending on the current conditions in the market.
Another concept related to position size is that of tiered position sizing. When you have the utmost confidence in the quality of the set, i.e. an established trend on multiple time frames, a reversed RSI divergence, volume conformation and a strong reversal candle, you will take the full position size. An established trend in one time frame with volume confirmation would be half of the full position size.
This asymmetrical approach allows you to take advantage of the A-grade setups without risk of loss to a B-grade setup, and over the long run, by utilising this break and retest strategy, will compound your returns rather than giving them back to the market on needless trades.
11. Trading Break and Retest on Tradewill
Execution is more important than theory.
To begin your trade on Tradewill, you'll want to filter your assets so that you're trading with high liquidity. The EUR/USD, AAPL, Gold, and major indices each provide you with enough volume and clarity of price action to set up a clean retest. Trading in low liquidity can leave you with erratic price movements, which will leave you with unreliable support and resistance levels.
Next, superimpose your volume indicators and RSI directly on top of the chart you have created. Set alerts at important levels of support and resistance so that you will receive notifications of price coming back to retest the level instead of being glued in front of the screen for hours on end. As soon as you get your alert, you'll want to switch to a lower timeframe to look for your confirmation candle before taking your entry.
12. Conclusion:
Once your setup has formed, before placing your trade, define all three of your entry parameters: your entry point, your stop loss, and your take profit. With Tradewill's order management tools, you can define all three before placing the trade, thus taking away the emotional component of the decision-making process after you're committed to the trade.
Use Tradewill's chart assembly tools to mark your breakout zone and your retest zone on the chart you've created. Having a clean and clutter-free chart that clearly identifies your key level will help eliminate second-guessing your trade when you're waiting for a confirmation.
Ready to put the strategy to work? Open your Tradewill account today and start identifying high-probability break and retest setups on real markets with the tools built for serious traders. Your next clean entry is one retest away.
Disclaimer: The content of the blog does not represent any position of Trade W, does not serve as any trading-related decision advice, and does not endorse any third-party.