
 Trade W
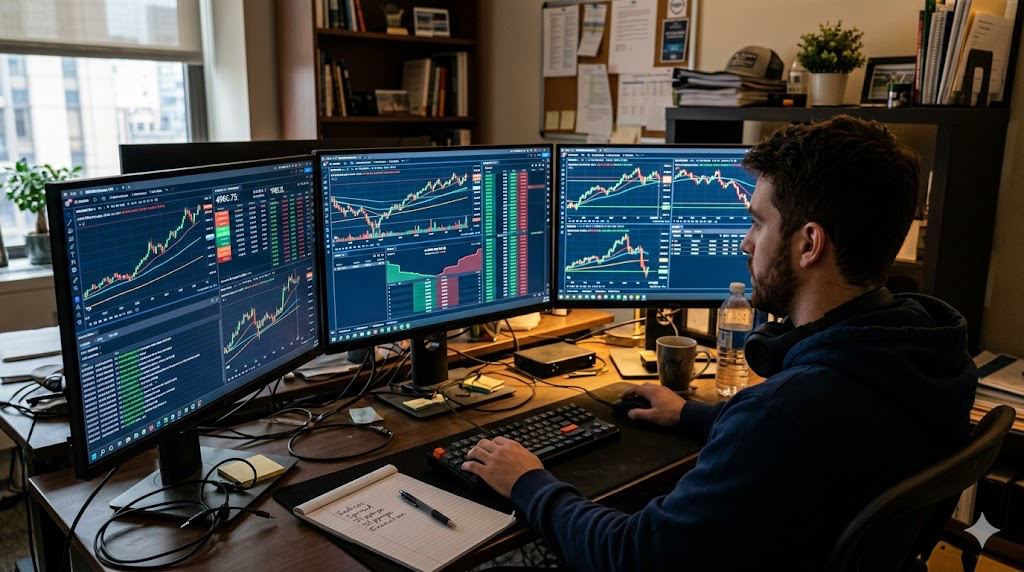
Most retail traders begin trading indices with the assumption that all brokers provide a similar marketplace. As a result, this belief can contribute more to long-term losses than many individual bad trades. Traders often read broker reviews and compare spreads and minimum deposit requirements when deciding which broker to use, but they frequently fail to understand how broker selection can directly affect their overall trading performance.
When trading index CFDs, you are effectively trading your broker's pricing engine, execution architecture, and liquidity aggregation system rather than the underlying S&P 500, NASDAQ 100, or Germany 40 index itself. It is common for two traders to enter the same index trade at the same time, apply the same strategy, and trade in the same direction, yet one trader may generate a profit while the other incurs a loss. The difference in outcome is often not the result of strategy or timing but rather the quality of execution provided by the broker, which many traders fail to evaluate or measure.
This guide will help you understand how to assess brokers based on the factors that genuinely affect trading profitability rather than on the factors that marketing departments would prefer you to focus on.
What Indices CFD Trading Actually Is
When you trade Contracts for Difference on the S&P 500 (US500), NASDAQ 100 (US100), and DAX (GER40), you are not investing directly in an asset listed on an exchange. Instead, these indices, along with many others, are synthetic products created by brokers using index data sourced from exchanges such as the Chicago Mercantile Exchange (CME), the Intercontinental Exchange (ICE), or other proprietary data providers. In addition to these feeds, brokers use liquidity aggregation systems, often referred to as liquidity providers, to obtain pricing for the underlying index. They then apply broker-specific adjustments to determine the final execution price displayed and traded on their platform.
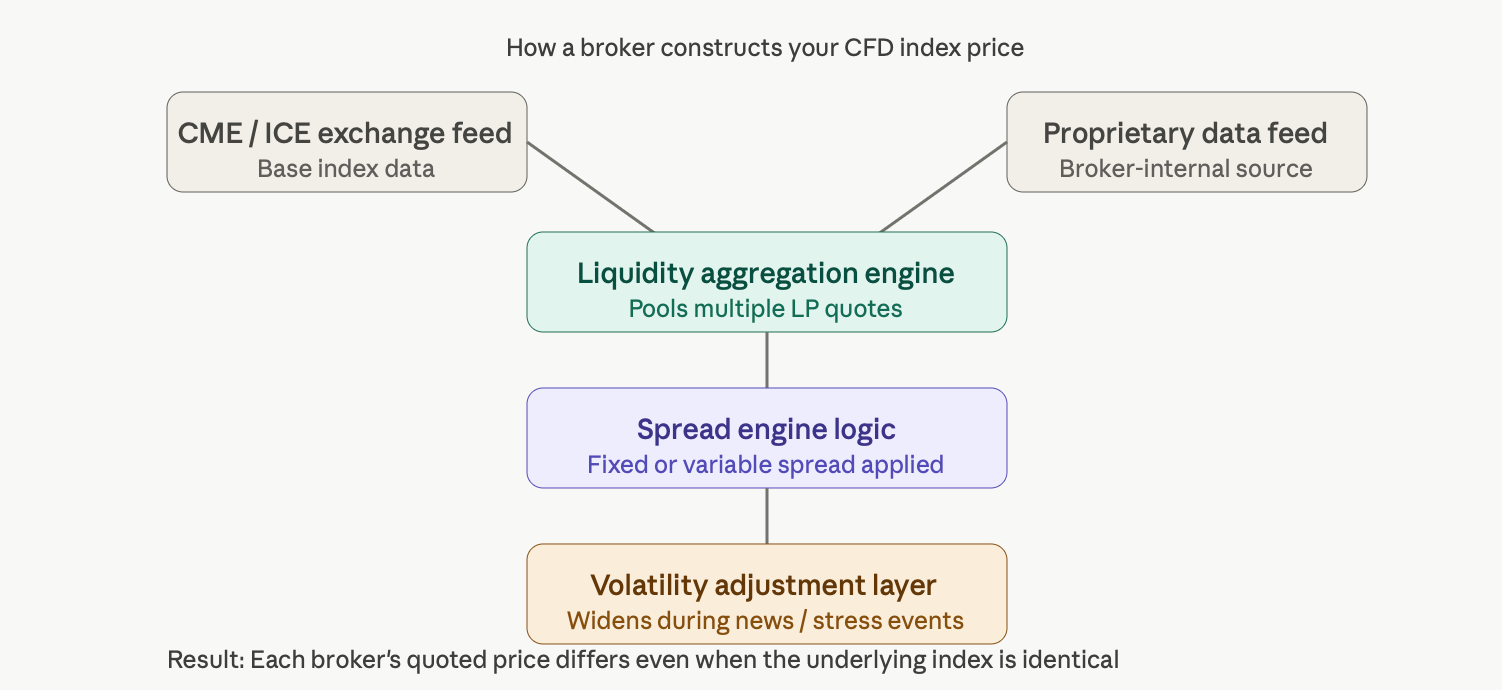
Because there is no universal CFD index price, each broker uses its own methodology to construct pricing for products linked to the S&P 500, NASDAQ 100, and DAX. As a result, it is not uncommon for two brokers to display the same quoted price for an index, such as the US500 at 5000.0, while using entirely different execution processes to arrive at that price.
A broker's pricing architecture can generally be described in four layers. First, the broker receives a base index feed from an exchange or data provider. Second, the broker applies liquidity-related adjustments or markups to the underlying price. Third, the broker uses a spread engine to determine the width of the bid/ask spread. Fourth, during major macroeconomic events, the broker applies its own pricing logic to expand or reduce trading costs based on the volatility of the underlying market.
Consequently, execution results can vary significantly from one platform to another. Two brokers may display the same quoted index price while applying different methodologies at each of these four layers. This helps explain why traders can experience materially different execution outcomes despite trading what appears to be the same market.
If you want to understand how algorithmic systems and institutional liquidity interact beneath these layers, the Quant Trading Masterclass and how Algorithmic Strategies Are Revolutionising Forex, CFDs & Crypto Markets lay out the foundational framework you need to make sense of what's actually happening.
The Real Cost of Trading Indices
When markets are moving rapidly, the spread may not be the most significant component of your total trading costs. However, it is often the metric most brokers use to promote themselves because it is highly visible and easier to compare than other, less obvious trading expenses.
Your total cost of trading indices is determined by a combination of factors, and the four primary components are:
-
Spreads: These are the most visible trading costs and are typically the figures that brokers advertise.
-
Commissions: These charges apply on a per-trade basis when trading through an ECN pricing model. Active traders often underestimate the cumulative impact of commissions, particularly during periods of high-frequency trading, where these costs can compound significantly over time.
-
Swaps and Financing Charges: When a position is held beyond the daily rollover period, financing charges are applied. These costs vary across indices, which means that holding positions in one index, such as the NASDAQ, may result in materially different financing costs than holding positions in another index, such as the DAX.
-
Slippage: Slippage occurs whenever there is a difference between the price at which you intended to execute a trade and the price at which the trade is actually filled. This represents an often-overlooked trading cost because it is frequently only recognised after execution. During periods of extreme market volatility, slippage can exceed the cost of the spread by a factor of three to ten times. For active day traders, slippage can become the dominant trading expense during these market conditions.
Understanding all four components is essential when evaluating the true cost of trading indices, as focusing solely on spreads can lead to a significant underestimation of the expenses that affect long-term profitability.
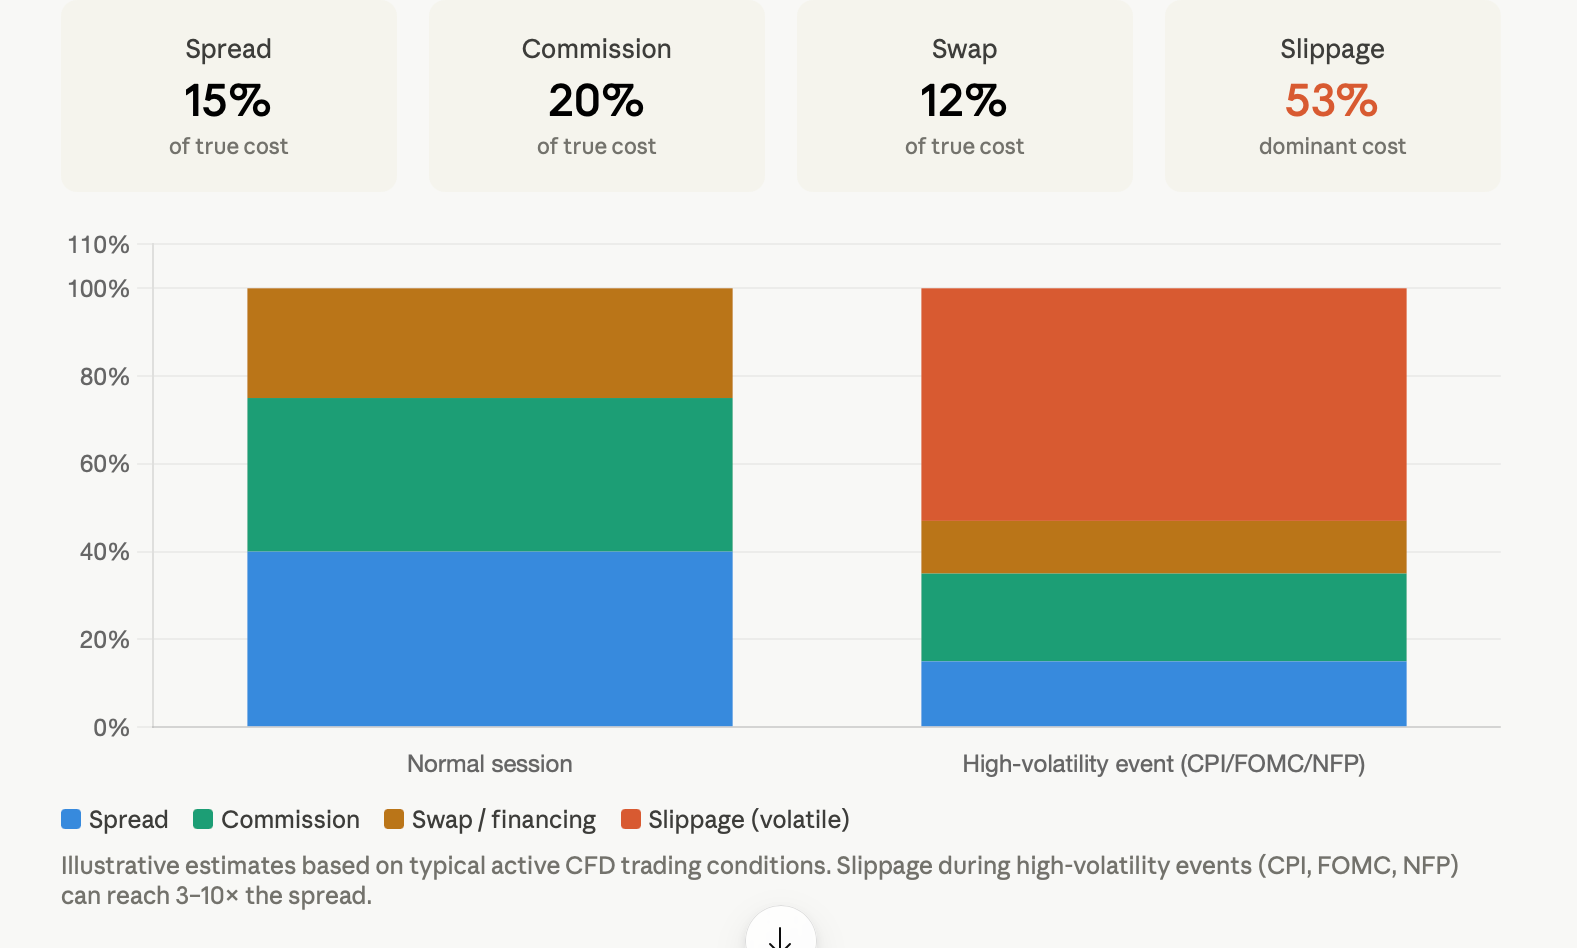
The true total trading cost formula is:
Spread + Commission + Swap + Slippage = Total Cost. Any broker evaluation that stops at the spread comparison is missing more than half the picture, and during volatile events, it's missing most of the picture entirely.
To understand how swap and carry mechanics work within CFD structures, the Carry Trade Explained: How to Profit from Interest Rate Differentials in Forex explains the interest rate mechanics that feed directly into indices' overnight financing costs.
Execution Quality: What Actually Decides Your Trading Outcome
Execution quality can produce significantly different trading results over time. When evaluating a broker, it is important to understand the components of execution quality beyond the price displayed on your screen.
Order execution speed, typically measured in milliseconds. The speed of a broker's order-routing infrastructure is critical when trading NASDAQ stocks or stock index CFDs during periods of heightened volatility. The slower the order-routing process, the greater the likelihood of receiving a less favourable execution price while the market is moving rapidly and execution timing becomes increasingly important.
Liquidity depth and order-fill quality: This refers to whether you receive a fill at the price displayed on your screen or whether your broker's order-routing system must execute your trade at a different price level because the available liquidity at the quoted price has been exhausted. When brokers have limited access to deep liquidity pools, traders are more likely to experience what is commonly referred to as "price gapping" during periods of rapid market movement.
Requote logic, which refers to a broker's policy of rejecting a requested execution price when liquidity is limited and then offering an alternative price instead. Traders who rely on breakout strategies or news-driven trading are particularly affected by requotes because precise entry and exit points are often critical to their performance. Over time, the cumulative impact of multiple requotes can become a significant drag on overall trading results.
Understanding how slippage behaves during macro events like CPI prints, NFP releases, and FOMC announcements is explored in the FOMC Meeting Minutes 101: Predict Interest Rate Trends and Maximise Trading Opportunities guide, which explains exactly when these high-slippage environments emerge and how to position your trading plan around them.
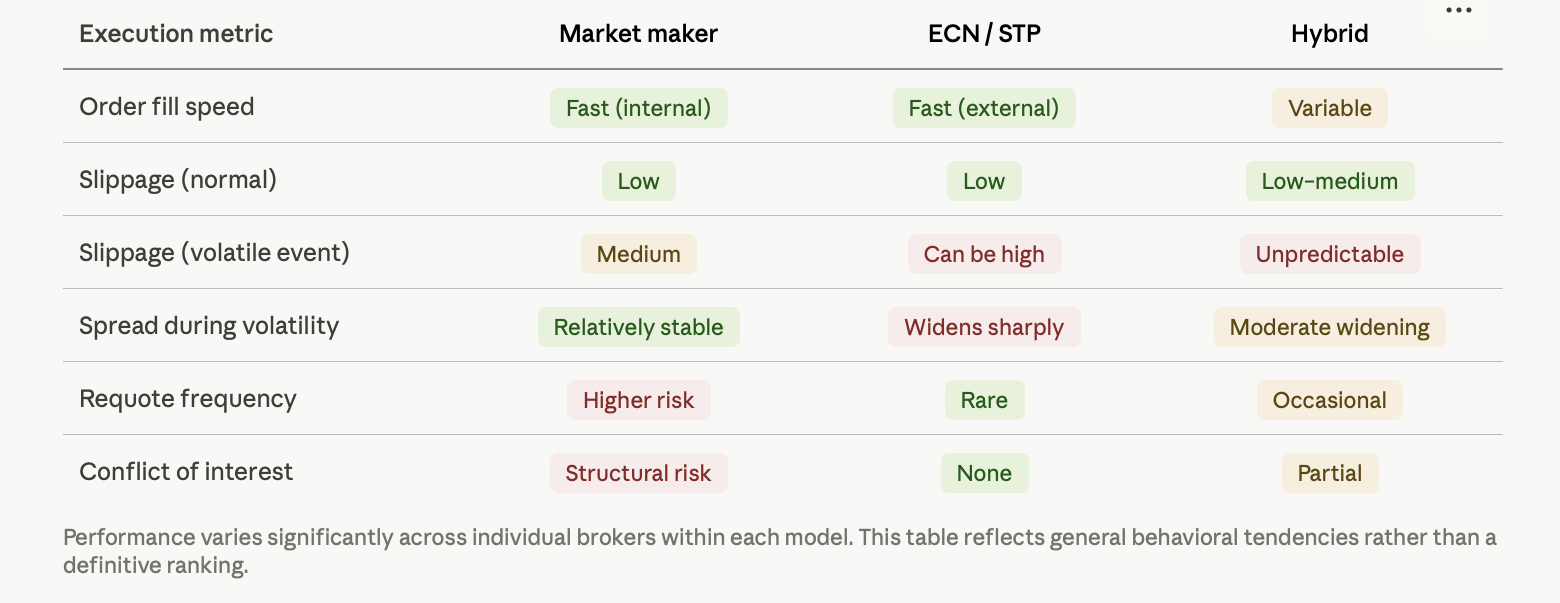
A key point is shown in the table above: while both brokers display the same spread, differences in market conditions and execution quality can result in different trading outcomes over time. A standard broker comparison chart is unlikely to show this information, nor is it typically included in the materials that brokers provide to prospective clients.
Index Volatility Structure: US100 vs US500 vs GER40
Different indices exhibit different levels of volatility. Therefore, broker selection should reflect the characteristics and behaviour of the specific index being traded rather than relying solely on a generic execution quality rating.
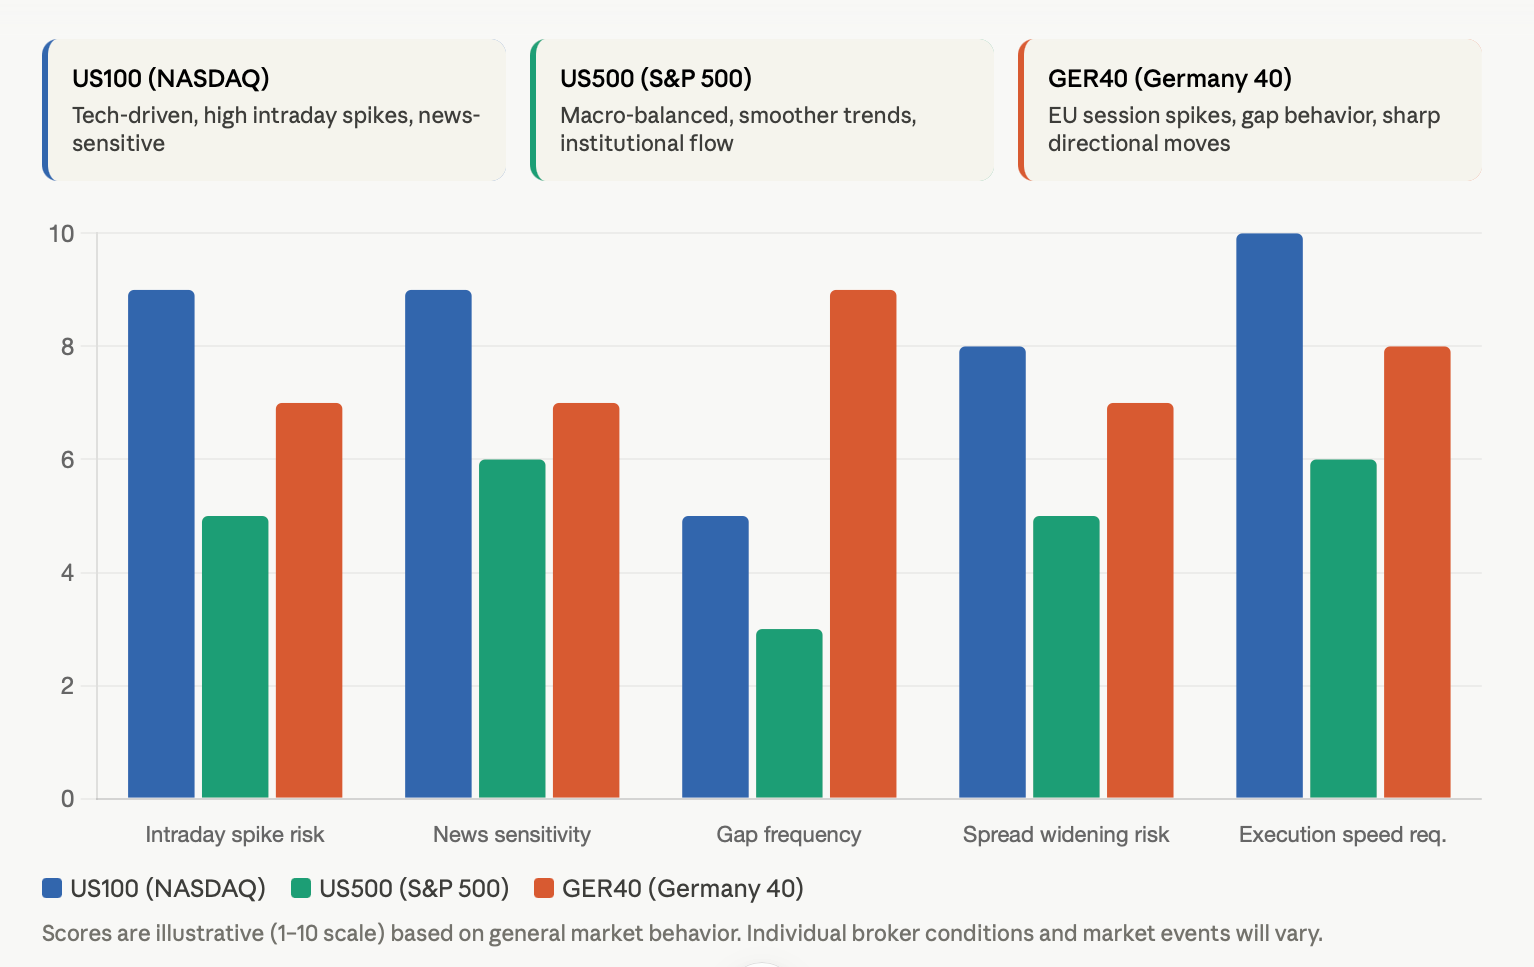
For example, the NASDAQ 100 (US100) is often more volatile than the S&P 500 (US500) because it is influenced by technology-sector earnings releases, interest rate expectations, and developments related to artificial intelligence (AI). Intraday price spikes are also more common in the NASDAQ due to the speed at which market sentiment can change. As a result, execution speed becomes particularly important when trading the US100, as even small increases in order-routing latency can affect trade outcomes during periods of heightened market activity.
The differing characteristics of these indices create distinct trading considerations. The US500 is generally more influenced by broad macroeconomic trends and institutional capital flows than the NASDAQ. Price movements in the S&P 500 often tend to be smoother and more stable, making spread consistency across trading sessions an important factor for traders evaluating brokers. In this context, spread stability may be as important as execution speed.
This distinction becomes even more apparent when comparing the US100 and US500 with the GER40. The GER40 often experiences strong directional movement during the European market open and can be particularly sensitive to European Central Bank (ECB) policy announcements and major German economic data releases. Periods of political uncertainty in Europe can also contribute to sharp price movements. Consequently, minimising slippage is an important consideration for GER40 traders, especially during the first hour of the European trading session when volatility and trading activity are typically elevated.
For traders who want to layer technical analysis tools on top of these indices to read institutional participation signals, the Mastering Forex Volume: How to Read Market Activity Like a Pro guide translates directly to indices trading contexts.
Why Traders Lose in Indices
Here is the grammar-corrected version with the structure preserved and no unnecessary rewriting:
All three types of structural failure patterns identified in index trading that lead to losses are broker-related or, in the case of multiple asset classes, execution-related failure patterns rather than strategy-related ones.
Traders overly optimise for the lowest spread, causing them to move towards brokers that advertise very tight quotes yet provide poor execution quality on live trades. If a one-pip tighter spread is rendered meaningless because your average trade experiences three pips of slippage, then the headline spread becomes one of the least predictive measures of your actual trading costs.
A lack of execution awareness when trading macroeconomic data compounds over time because traders tend to participate most actively on the days when obtaining a quality fill is most difficult. Macro events typically cause slippage to exceed the average spread by a significant margin. It is important to understand this when trading major macroeconomic events such as CPI releases, NFP reports, or FOMC decisions. These events create conditions where slippage on multiple fills can exceed the average spread several times over. The quality of execution, or lack thereof, during these events can have a significant impact on a trader's ability to achieve consistent results. The Quantitative Easing Explained: What Forex Traders Need to Know guide covers the macro policy environment that generates many of these high-volatility episodes and helps frame how to approach them structurally.
Trading indices when liquidity is low means there will be worse average execution prices, since fill times are also usually longer. The Asia session often has much reduced liquidity for trading the US500 and GER40, resulting in much wider average spreads and increased risk of slippage when trading with any broker. The timing of trading around the peak liquidity region on the relevant market is just as important in determining your execution cost as is the selection of your broker.
How to Actually Evaluate a Broker for Indices Trading
Instead of looking at a broker's advertised spreads and claims about their product, experienced indices traders are going to evaluate brokers by using five measurable dimensions that are representative of true trading conditions.
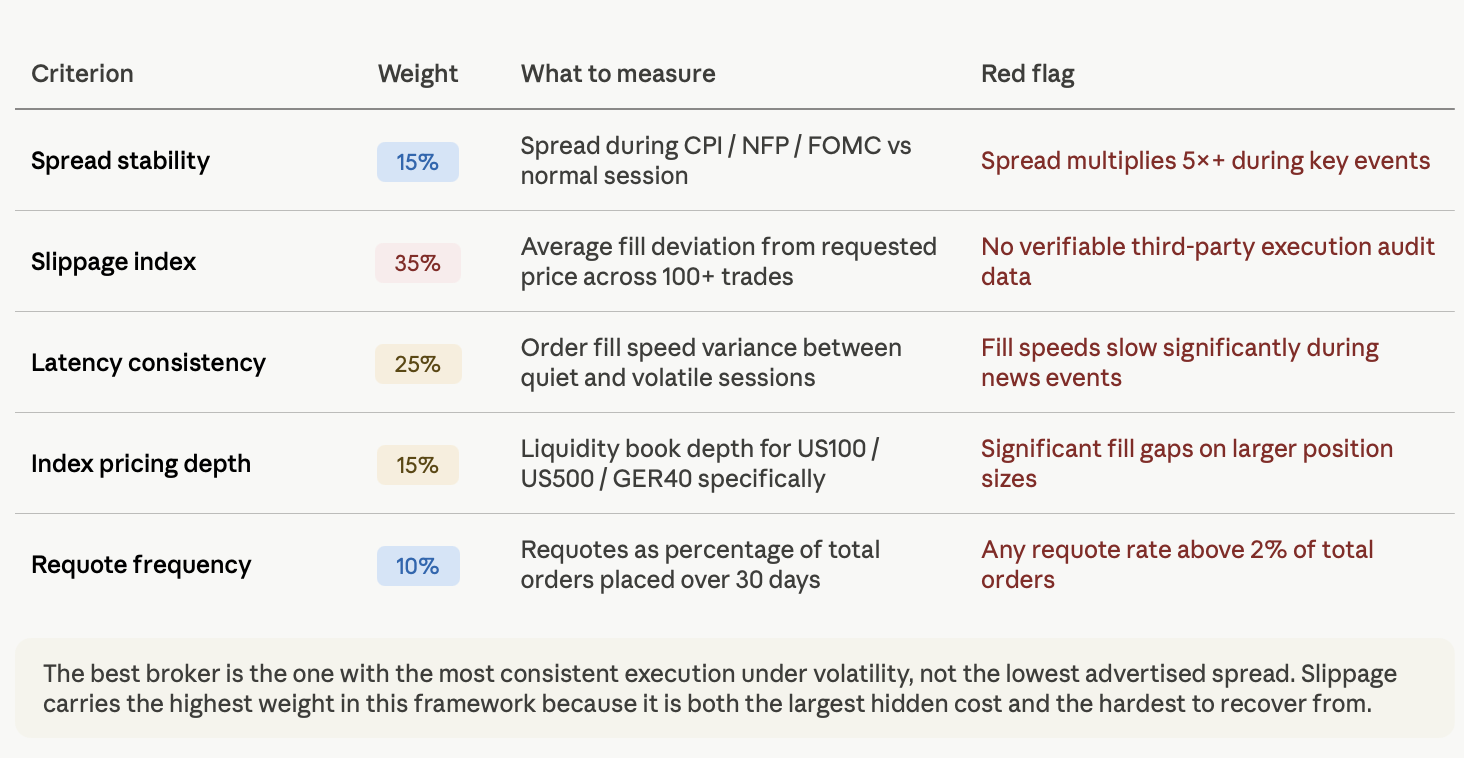
The decision principle that will drive this framework is very simple; the best broker has the most consistent execution during periods of volatility, not necessarily the one with the lowest headline spread. Slippage has the largest overall impact because it is both the largest hidden cost and the metric that most traders do not assess until it is too late and has negatively impacted their return on investment.
Matching Your Strategy to the Right Execution Environment
Different styles of trading interact differently with a broker's execution quality; therefore, what works well for scalping may not work as well for swing trading. An ECN model is best suited to scalping due to its ultra-low latency and minimal slippage. However, this model is only beneficial for scalpers if adequate liquidity exists in the market. For example, if a trader is using a scalping strategy on the NASDAQ during the U.S. trading session and trades through an ECN broker with deep liquidity, they are in a much stronger competitive position than if they were using a market maker with a fixed but wider spread.
In comparison with scalpers, breakout traders can tolerate higher spreads, but those spreads need to remain relatively stable. Breakouts typically occur during periods of strong momentum, when a stock begins moving sharply, and these are also the periods during which bid/ask spreads tend to widen. Therefore, breakout traders are generally better served by a broker that offers stable but slightly wider-than-average spreads than by a broker that offers tight but erratic spreads.
Understanding trend reversal signals is only half the equation here: your execution model determines whether you actually capture the move at the price you saw.
News trading is the trading style that relies most heavily on execution quality. Therefore, slippage control is essential. When placing stop orders ahead of major events such as FOMC releases or CPI releases, your broker must provide sufficient liquidity to execute those orders without excessive deviations from the intended price. Situations such as these often expose the weaknesses of poorly selected brokers and can result in some of the most significant trading losses.
Swing trading places greater emphasis on swap costs because positions are typically held overnight and accrue financing charges over a multi-day holding period. A broker with tight spreads but unfavourable overnight rates can cause a position that has been directionally correct across multiple sessions to become less profitable. In this regard, Carry trade mechanics are more important for swing traders to consider than many traders realise.
The Asymmetric Information Problem in Broker Marketing
Broker marketing relies heavily on visible metrics, creating a bias in how traders choose brokers. While comparison sites usually display spreads and, in some cases, commissions, they almost never include execution quality. This is because such data is often proprietary, difficult to standardise, or may reflect poorly on many of the larger advertisers within the sector. This bias creates an asymmetrical information environment in which retail traders often select brokers based on metrics that are easy to present and compare, rather than on metrics that are more indicative of trading outcomes.
For example, a broker may advertise spreads of 0.30 pips on the US500 and provide those spreads during relatively quiet market conditions. However, that same broker may deliver lower-quality execution than another broker offering spreads of 0.60 pips but providing better execution quality. During periods of volatility, the difference in quoted spreads may become insignificant because the costs associated with trade execution can outweigh any advantage gained from a narrower spread.
Retail traders often discover this through experience. They may find that their live trading results consistently lag behind their backtested results by a noticeable margin, despite using the same strategy. In many cases, this gap can be attributed to execution-related factors associated with live trading, including slippage, requotes, and spread widening during the periods when trades are executed.
Understanding cyclical economic patterns and fiscal policy shifts can help traders anticipate when high-volatility conditions are likely to emerge, which gives them time to evaluate whether their current broker handles those environments acceptably before real positions are at risk.
The Only Metric That Actually Tells You About a Broker
All components of execution quality can be represented through one measurable metric: the average deviation between the requested fill price and the actual fill price during periods of extreme volatility.
Using a demo account, record both the requested price and the actual fill price during well-known macroeconomic events over several weeks. Calculate the average difference between the two, using a minimum sample size of 20 to 30 events to produce a statistically reliable measure.
This number, when considered alongside a broker's spreads, helps determine the actual cost of using that broker based on the level of market volatility at the time the order was submitted. If you are able to achieve consistent execution quality during volatile conditions, you can reduce trading costs on individual trades while also obtaining a more reliable basis for evaluating trading performance by comparing backtested results with live results. Accurate execution reduces the gap between expected backtested performance and actual trading outcomes, improving the ability to assess strategy performance.
Broker selection is not primarily a cost decision but a risk management decision. Therefore, like other risk management decisions, the selection process should be approached thoughtfully rather than based solely on the lowest quoted spread in a broker comparison table.
If you're building out a more systematic approach to indices trading, it's worth also understanding quantitative trading strategies and how execution quality interfaces with algorithmic systems, especially if you're planning to automate any part of your approach.
Ready to trade indices where execution quality is taken seriously? TradeWill's CFD indices trading infrastructure is built around low-latency fills and transparent pricing, not just attractive advertised spreads. Explore TradeWill's indices trading environment and see the difference an execution-first design makes to your actual results.
Disclaimer: The content of the blog does not represent any position of Trade W, does not serve as any trading-related decision advice, and does not endorse any third-party.