
 Trade W
Indicators do not provide perfect predictive results for all traders; therefore, there is still the possibility of losing when using an indicator. Understanding the difference between expectations and results is what this article addresses.
New traders generally spend significant time trying to find an indicator that works for them. They will try using indicators like Relative Strength Index, Moving Average Convergence Divergence, and Bollinger Bands, but may not have success with any of these tools. As a result, they begin to believe that it simply is not possible to be a successful trader.
The issue is not the indicator, but the way you are using it. Once you understand how an indicator works and its relationship with previous price movement, it changes your trading approach.
In this guide, I will explain how indicators work, the importance of market structure versus individual tools, how to combine various indicators into a trading system, and what causes the majority of retail traders to lose money.
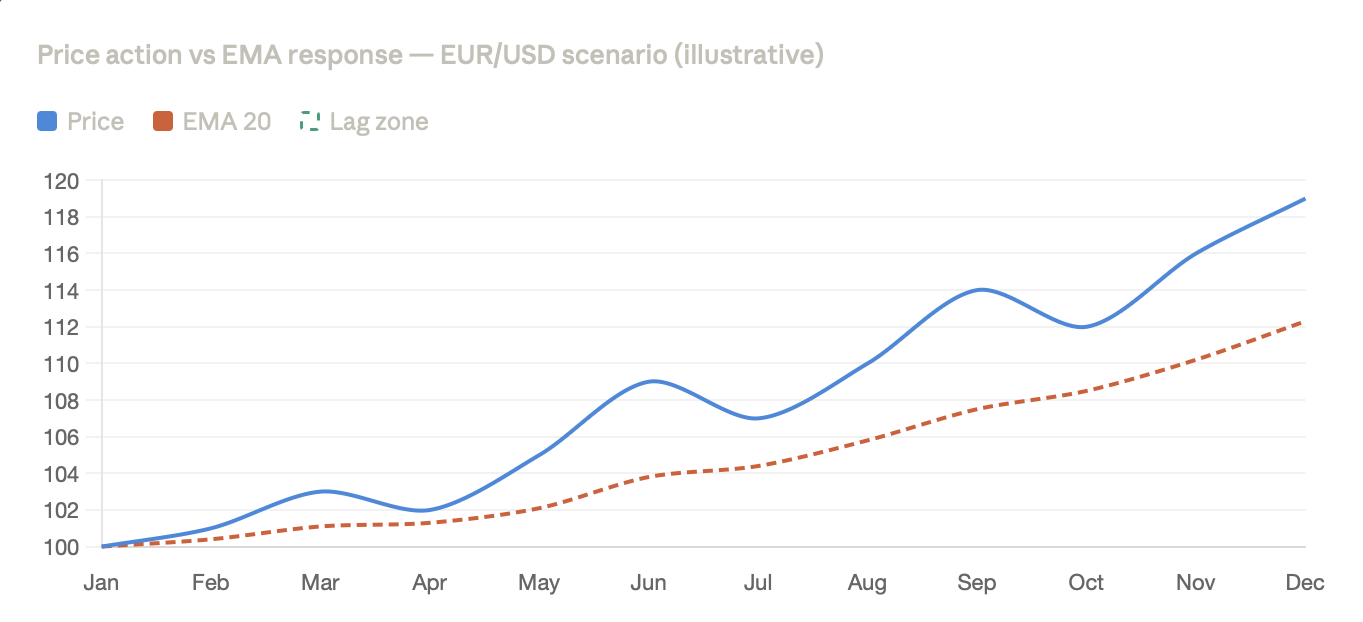
Indicators have three purposes: to show the direction of trends, to assess price momentum, and to calculate potential levels of volatility. These are the only ways in which indicators can serve a trader. Indicators do not take into account support or resistance levels, do not account for news events, and do not account for where institutions have placed their orders.
A trading signal and an indicator signal are not two things that can be used interchangeably, nor are they two aspects of the same signal. A trading signal is generated by context, methodology, or a rule-based system, whereas an indicator signal is based solely on price behaviour derived from an equation.
Why Market Structure Matters More Than Indicators
Understanding market structure is the first step, and using indicators is the second step.
Most traders do not understand or utilise their indicators correctly according to the current market conditions. For example, a Relative Strength Index signal will look different in a ranging market compared to the same RSI signal in a strong trending market.
There are three typical states for the Foreign Exchange Market: ranging, trending, and breakout, and each market state requires its own set of tools to trade effectively.
In a trending market condition, indicators such as moving averages and Average Directional Index work well because price will typically respect the trend signaled by the moving average acting as a dynamic support or resistance line. Conversely, in a strong uptrend, the RSI signal is generally useless because the RSI indicator can remain in the overbought level throughout the entire uptrend. This causes traders attempting to short an overbought EUR/USD pair to be continuously stopped out of their short trades.
The reverse happens in a ranging market, where the RSI and Stochastic Oscillator provide solid trade signals, while moving averages get whipsawed in both directions multiple times, resulting in false signal after false signal.
During breakout market conditions, a similar approach is taken by using Average True Range and Bollinger Bands to measure the compression and expansion of the price range. When volatility is compressed, a potential breakout is setting up. When volatility expands, the breakout is confirmed.
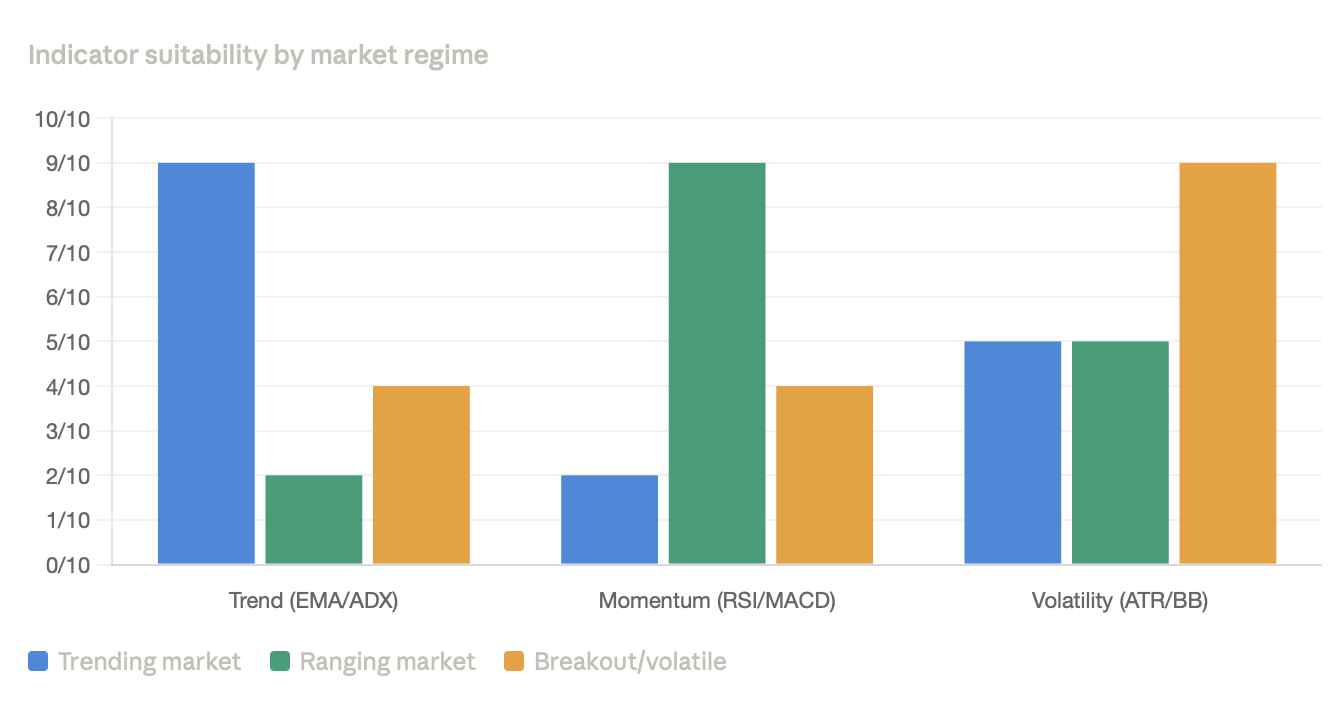
The chart above shows the pattern clearly. No indicator category scores high across all three regimes. This is why traders fail when they pick one indicator and apply it to every chart regardless of conditions.
No Indicator Works Best in Every Market Condition
The search for one perfect indicator reflects a desire for certainty in an uncertain market. Professionals don't work that way. They use indicators as inputs into a structured decision system, each tool serving a specific role.

Indicators within a trading system have three specific purposes. The first type of indicator is used to determine when to enter a position. The second type of indicator is used to confirm the major trend or direction of the asset being traded before executing an entry. The third type of indicator is utilised to determine how much room to allow your position in relation to your entry before deciding that your hypothesis has been invalidated, examples being Average True Range or volatility-based measures.
When you try to use one indicator for all three of these functions, you will be working with potentially conflicting data. By establishing a trading system in which each of these three tools performs only one job, you will find that your overall trading picture becomes much clearer.
Full classification of forex indicators
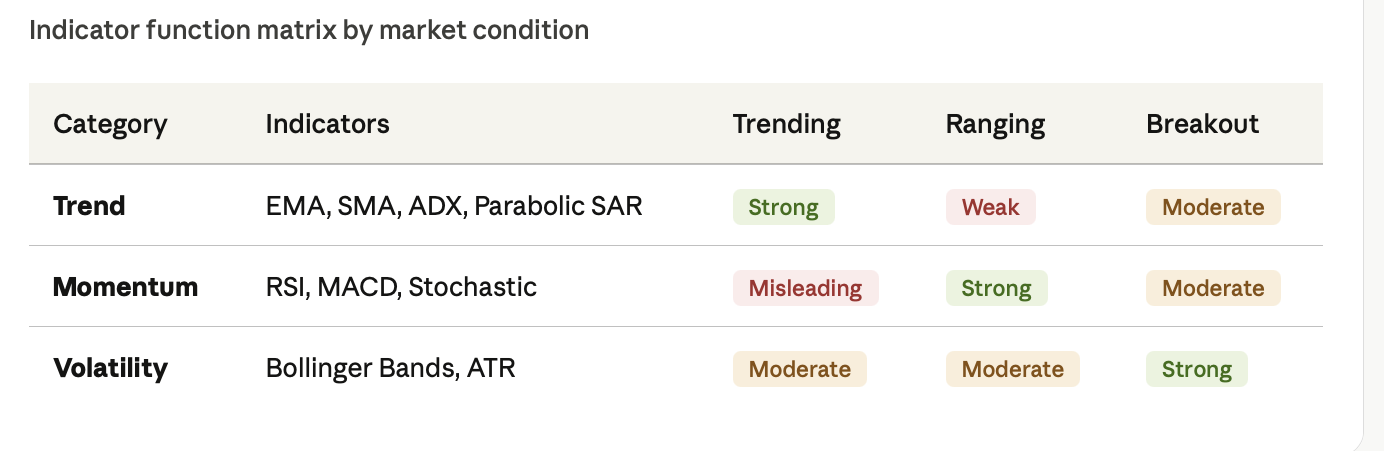
Professionals organize indicators by function. Here's the complete taxonomy.
Moving Averages
Both simple moving averages (SMA) and exponential moving averages (EMA) smooth out price data to show the direction in which price is moving. The EMA200 is the preferred EMA for many institutional traders. The Average Directional Index is a numerical measure of trend strength. A value above 25 indicates a true trend, while a value below 20 suggests the market is drifting sideways, making trend-following tools less reliable.
The Parabolic SAR indicator trails behind price and switches sides when the trend changes direction. It is clear and easy to read, but it can also generate many false signals during sideways markets.
Momentum Indicators
The Relative Strength Index oscillates between 0 and 100, with readings above 70 indicating overbought conditions and readings below 30 indicating oversold conditions. The RSI works well in a ranging or sideways market. However, in a trending market, overbought RSI readings can persist, and using them alone to make trading decisions can cost you money.
The Moving Average Convergence Divergence shows the relationship between two moving averages, typically EMAs of price over specific periods. Traders watch for these moving averages to cross to identify changes in momentum. Divergence between MACD and price is considered one of the stronger signals in technical analysis and often precedes major reversals in price, especially in BTC/USD.
The Stochastic Oscillator works similarly to the RSI but uses a different calculation. Both indicators serve the same purpose, so if you decide to use one or both of these tools, it is recommended that you deeply understand the one you choose before attempting to use them together.
Indicators of Volatility
Bollinger Bands are two standard deviation lines plotted above and below a moving average. A compression of the bands indicates a decrease in volatility, while an expansion of the bands indicates an imminent price move. Gold is one market where strong Bollinger squeeze setups can often be found before price breakouts, especially on the daily or 4-hour chart.
Average True Range shows the average price differential for a given time frame, but it does not predict the direction in which price will move. Instead, ATR shows how much the price typically moves once it reaches your stop-loss level. Therefore, it is essential for establishing stop-loss levels that give trades enough room to breathe without being arbitrary.
How professional traders combine indicators into systems
The transition from thinking about indicators to thinking about systems is the biggest shift a trader can make. Indicators alone cannot generate profits, but systems can.
A trading system includes: the markets to enter based on desired market conditions; indicators that validate the current market conditions; full entry and exit rules to determine when to enter and exit a trade; and risk management for each individual trade based on a defined risk level.
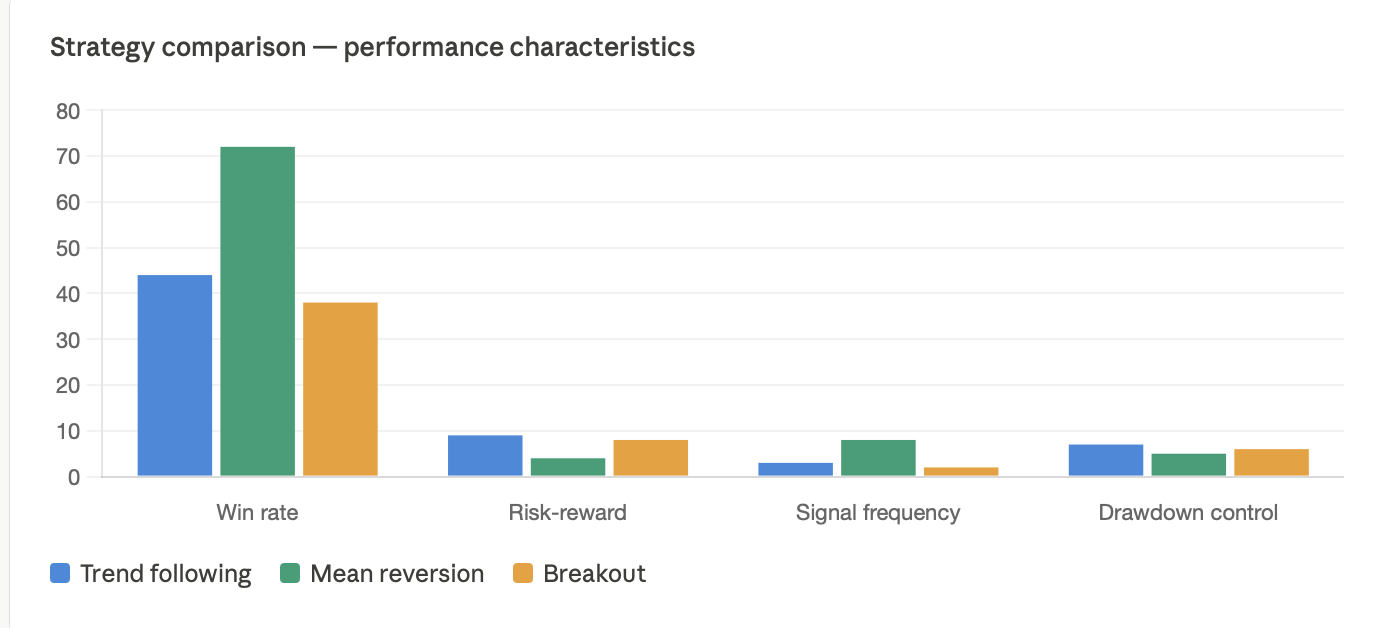
A trend-following trading system establishes trend direction using both the 200-period Exponential Moving Average (EMA), while the existence of a true trend is confirmed by an Average Directional Index value greater than 25. Trades can then be entered (BUY/SELL) on general price retracements to the EMA in the direction established by the EMA and ADX, while the stop-loss can be placed at the last swing low.
The EUR/USD pair on the daily timeframe has consistently exhibited this market behavior when backtesting this trading system from 2020 through 2024, demonstrating that as long as there is ADX confirmation, the system has maintained a positive expectancy on longer timeframe trades.
Mean reversion system
A system based on mean reversion measures can be developed by combining Bollinger Bands and the Relative Strength Index to create an effective mean reversion setup for GBP/USD during consolidation periods. Look for a price touch at the lower Bollinger Band, an RSI reading below 30, and then a reversal candle to provide an entry point for going long, with a target at the mid-line of the Bollinger Bands. A tight stop-loss can be placed just outside the lower Bollinger Band. Before deciding whether to trade this setup, you need to ensure that the market is ranging and not in a downward trend. Average Directional Index readings below 20 can be used to confirm a range-bound market.
Breakout system
A breakout system can be created using the Average True Range, which can measure whether a market's volatility is contracting as well as confirm volatility expansion when used alongside Bollinger Bands. When the ATR indicator reaches or falls below its lowest reading of the past 2 to 3 weeks, the market is often forming a squeeze, confirmed by the narrowing width of the Bollinger Bands. The first candle that closes outside the Bollinger Band, combined with an ATR expansion, can trigger an entry signal for a breakout trade. The combination of Bollinger Bands and ATR produces some of the strongest breakout structures on BTC/USD.
 Why traders fail even with good indicators
The indicators aren't the problem. Here's what actually goes wrong.
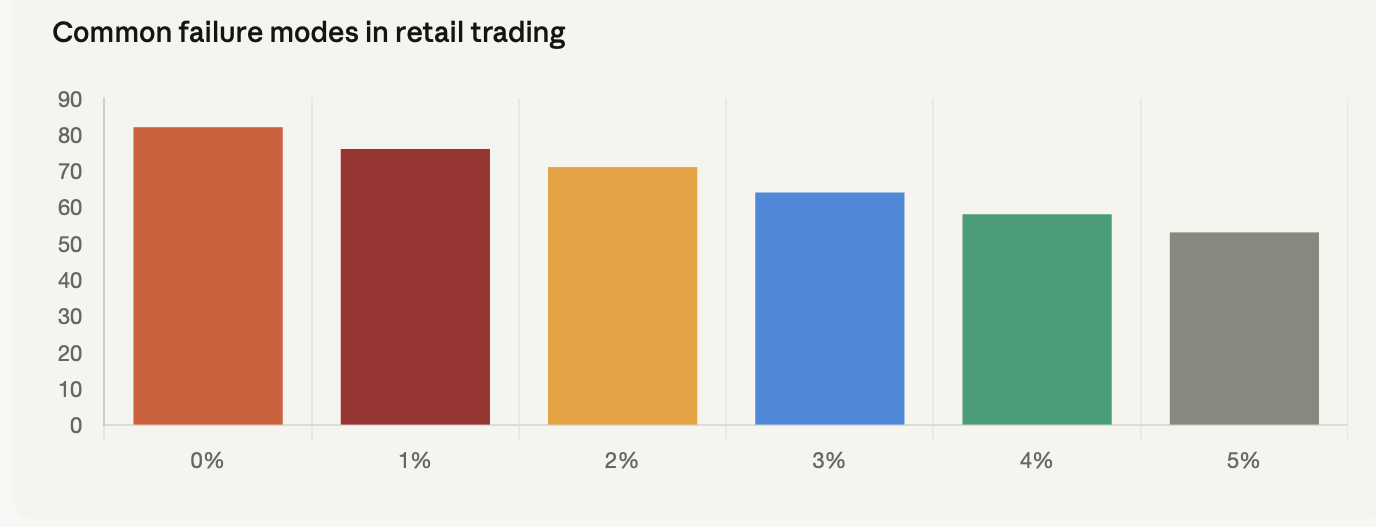
There is a reality to indicator overload. When too many indicators are placed on a chart, all covering the same price action in different ways, they create disturbance and noise rather than providing clear direction. Each additional indicator introduces potentially conflicting data and causes the trader to hesitate when action is required.
The concept of overtrading will increase your losses. An Relative Strength Index reading of 35 is not, by itself, a valid reason to take a trade. There must be valid structure, context, or a favourable risk-to-reward ratio associated with the setup. Traders who react solely to an indicator signal without these criteria will consistently drain their accounts over time.
Each time you make an emotional trading decision, you are overriding the system. You identify an entry as valid, and the system says to enter, but because you lost the previous three trades, you decide not to take it. Then you watch that trade go on to gain 140 pips. Meanwhile, you believe you protected yourself, but instead you damaged your discipline and psychological consistency.
Traders who do not backtest are forced to guess whether their trading system will be successful. The purpose of backtesting is to determine which systems may not work, which systems have a measurable edge, and whether a particular system performs effectively under specific market conditions. Without this process, traders often end up operating without evidence that their approach can consistently generate profits.
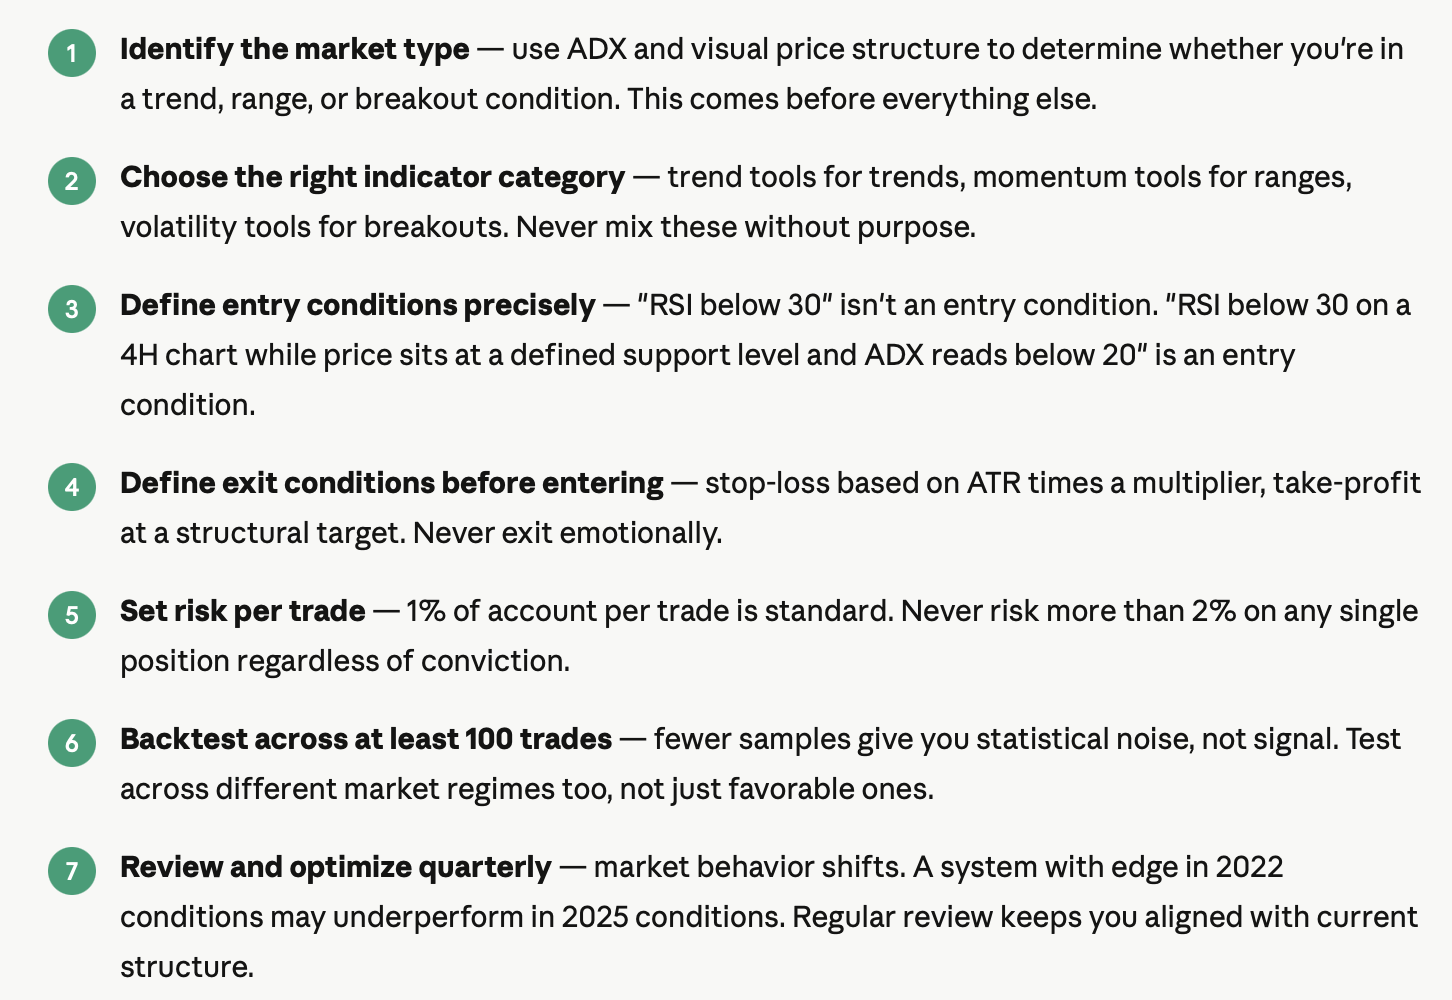
How to build your own forex indicator strategy
Follow this sequence. Don't skip steps.
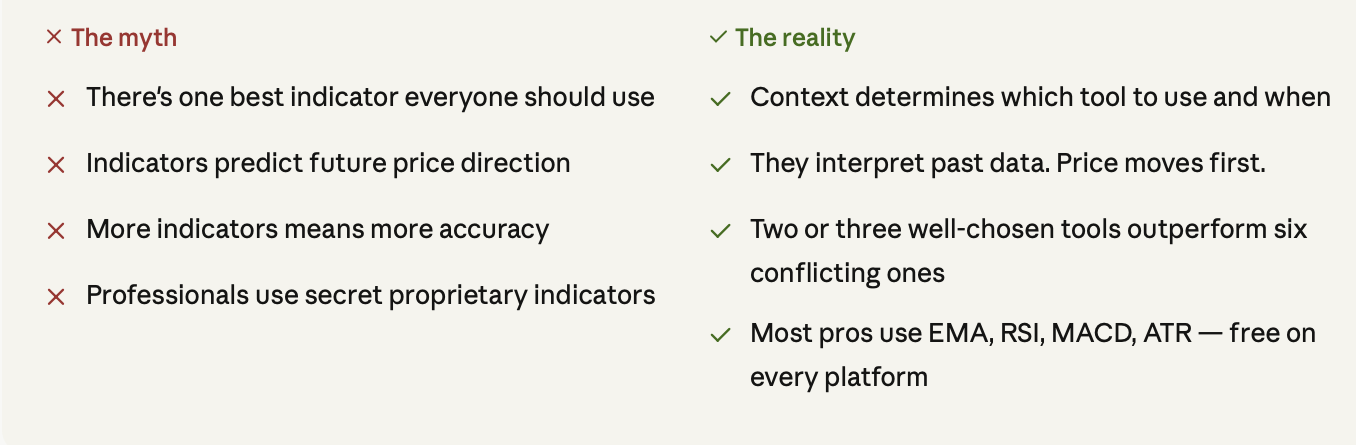
 Common myths about forex indicators
 FAQ
FAQ
Frequently Asked Questions
What’s the best indicator for beginners in Forex trading?
The combination of EMA (Exponential Moving Average) and RSI (Relative Strength Index) works particularly well for beginners. EMA helps identify the overall direction of the trend in a clean and simple way, while RSI helps highlight moments when price may be overextended. Together, they perform two different functions without creating excessive chart noise or analytical confusion.
Can one indicator make you consistently profitable?
No. Consistent profitability comes from the design of the overall trading system, proper risk management, and the discipline to follow rules consistently over time. A single indicator cannot provide all of these elements on its own.
What indicators do professional traders actually use?
Most professional traders build their systems around a core group of widely known tools, including EMA, RSI, MACD, Bollinger Bands, ADX, and ATR. The indicators themselves are not secret. What differentiates professional traders is the structure of the system surrounding those indicators, including execution, risk control, and market context.
Which indicator is the most accurate?
No indicator is universally accurate. Every indicator performs well under certain market conditions and poorly under others. Accuracy depends far more on market structure and context than on the indicator itself.
Should I combine multiple indicators?
Yes, but only when each indicator serves a distinct purpose. For example, using an EMA for trend direction, RSI for timing, and ATR for volatility and risk management creates a balanced structure with minimal overlap. Adding multiple indicators that perform the same function usually duplicates information rather than improving decision-making.
Tradewill provides traders with real market context, integrated analytics, and a trading platform designed to support individual trading systems rather than forcing users into rigid default configurations.
Disclaimer: The content of the blog does not represent any position of Trade W, does not serve as any trading-related decision advice, and does not endorse any third-party.