

 Trade W
The Basics of Block Trades: The Big Deals of Financial Markets
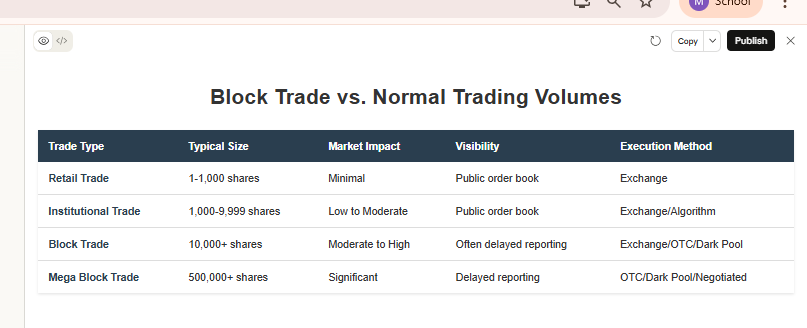
Retail investors may trade a hundred shares at once, but institutional investors execute trades that involve millions of shares at a single time. These block trades are large trades of securities that generally involve at least 10,000 shares or $200,000 worth of stock and can cause a significant ripple in the markets.
Block trades are not everyday retail trades. These blockbuster trades are heavyweight events related to institutional investors including pension funds, hedge funds, mutual funds, and sovereign wealth funds. The idea of block trades originated in the 1960s when the New York Stock Exchange developed special rules to accommodate these large trades that were literally too large to be accommodated by ordinary markets without creating chaos.
The importance of block trades
Block trades matter for three primary reasons: price discovery, liquidity signals, and market intelligence. When large institutional investors move large positions, they have likely conducted substantial research and made a calculated decision usually period or based on information that retail investors do not yet have. Block trades will also show where liquidity exists in the market and can provide early indications of a changing institutional sentiment and the price action to come.
Core Characteristics and Execution Methods
Size and Liquidity Factors
While technically defined as 10,000 shares, a block trade's actual impact hinges on the liquidity of the stock. A 10,000-share trade in Apple is hardly impactful if a company trades millions of shares each day. Conversely, 10,000 shares in a smaller company could significantly impact the price if the overall trading volume for the day was 5-10%. To assess the size and impact of a large stock trade, professional traders have the "5% rule."!. If the daily trading volume in shares is 200,000 and your trade size is 10,000 shares, then you are potentially initiating a block trade transaction and you should plan accordingly. The "5% rule" provides a practical measure of daily volume.
Three Main Methods of Execution
On-Exchange Trades occur through a regular public market during normal hours of trading. They have the benefit of being transparent and allowing market liquidity access. However, the downside is visibility. The opinion of the trade is there for everyone to see and therefore can be opposed as you are getting filled.
Over-the-Counter (OTC) Trades occur directly between the two parties, usually involving a broker-dealer intermediary. OTC trades are off of the public order book, thus limiting the immediate price impact. Statistics show that as much as 40% of trading occurs off-exchange in the US equity markets, and investment banks even have desks or dedicated personnel managing these transactions.
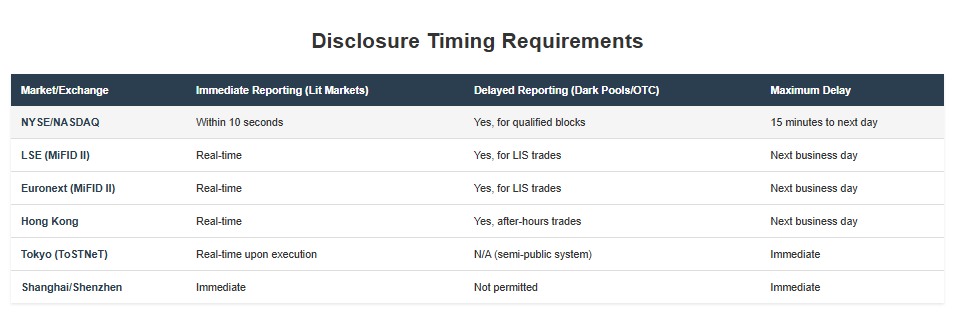
Dark Pool Trading can be thought of as blending. Dark pools are private exchanges on which institutions can trade large blocks of size without giving the rest of the market any information about what they are doing. The executed trades become public information, but only after a delay, typically 15 minutes. There are over 40 dark pools in the US, which operate simply to allow institutions to trade size without giving the market any sign that they are trading the stock.
Timing and Price Impact
Many block trades are either pre-market (4:00 AM to 9:30 AM ET) or post-market (4:00 PM to 8:00 PM). Throughout the day, after-hours trading is roughly 8-10% of total daily volume for major stocks; the volume primarily comes from block trades.
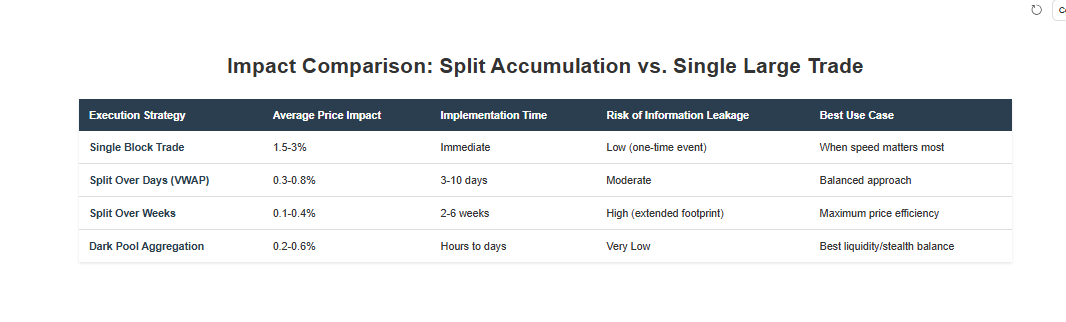
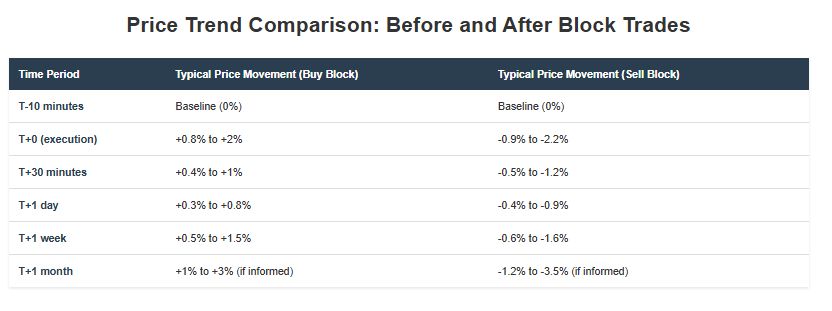
Block trades always move prices, at least for a short time. Academic research has shown that a 5% of daily volume block trade will move prices about 0.5-1.5% in the direction of the trade, probably strongest for the first few minutes and then dissipating over time as the market digests it.
Institutional Investment Strategies
Accumulation Strategy
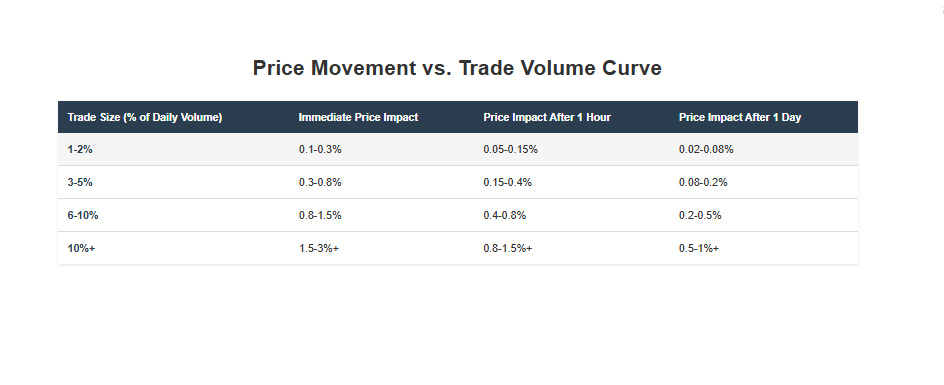
Markets cost you the impact cost when you periodically build large positions. As you accumulate position, your buying builds volume that raises the price of each subsequent purchase. This can add a market impact cost easily equal to 2-5% of the total position cost.
The answer is strategic execution. Large buyers typically separate their trading into smaller blocks over days, or weeks. They typically will utilize techniques such as volume-weighted average price (VWAP) execution in which they pace their buying to the given price the natural rhythm of trading. Execution of the buy will occur in subtleties of pacing. Sophisticated buyers such as funds will also utilize other algorithms such as "implementation shortfall" or "participate" algorithms that manage the speed of execution to price while disguising the true intention of the buy.
One of the best examples of this was Warren Buffet's Berkshire Hathaway which spent approximately five months accumulating a $1 billion position in Occidental Petroleum in early 2022. Berkshire acquired shares of Occidental Petroleum a little bit at a time and did not go all in at one time, which clearly evidenced their intentions of minimizing impact of their aggregate purchases of a large volume of Occidental shares. The stock price still rose approximately 18% during its accumulation time frame.
Disposal Strategy
Disposal of a position can be even more difficult than buying. When institutions liquidate large positions, being largely in less liquid names, they risk inducing a selling panic, triggering the sell down of price more than valid for a liquid market. Through slurred execution, a seller can easily cost 5-10% of the value of a position from sell impact.
Smart sellers use several approaches: selling into strength (executing larger blocks on rising days when there's natural buying interest), dark pool aggregation (splitting sell orders across multiple dark pools), or pairing block trades with derivative hedges to maintain economic exposure while exiting physical stock positions.
Market Impact and Price Discovery
Short-Term Price Movements
Research by the Journal of Financial Markets that analyzed more than 50,000 block trades, identified this pattern:
-
Short-term impact (first five minutes): prices move 0.8 to 2% in the direction of trade,
-
Short-term correction (five minutes to one hour after trade): 30 to 40% of the price move reverses,
-
Trend stabilizing (one to six hours): prices establish a new equilibrium,
-
Permanent impact (end of day): 50 to 60% of the price move persists during the day.
The rapid increase in price to the mechanical pressures of executing large orders. The correction is the point where market makers and opportunistic investors step in and provide liquidity. The longer-term component is the informational content, or signal, that was generated when someone with a strong level of resources and research conviction established a strong position.
Long-Term Trend Indicators
Although the individual block trades create short-term price noise, a pattern of block trading represents a signal of a longer-term trend.
- Stocks that have received a sustained period of block buying (multiple large purchases over multiple weeks) average outperformance of their sector by 2 to 4% over the following three months,
- Sustain period of block selling substantially underperforms their sector by 1.5 to 3% over the following three months.
Institutions do not trade hundreds of millions of dollars on a whim. Sustained block buying often suggests several smart opinions have reached relatively positive views on a company's prospects.
Global Regulatory Differences
The US market deals with block trades with comparatively low regulation, having a visible bias towards reporting as opposed to pre-approval. In the EU region, under MiFID II regulation, similar trades have a more rigorous reporting regime, including detailed reporting of transactions, and involves the implementation of "double volume cap" mechanisms which limit dark pool trading of equity instruments. The Asian markets have the most varied approach, with China taking the most restrictive view and requiring reporting of such trades immediately and publicly.
Risk Management
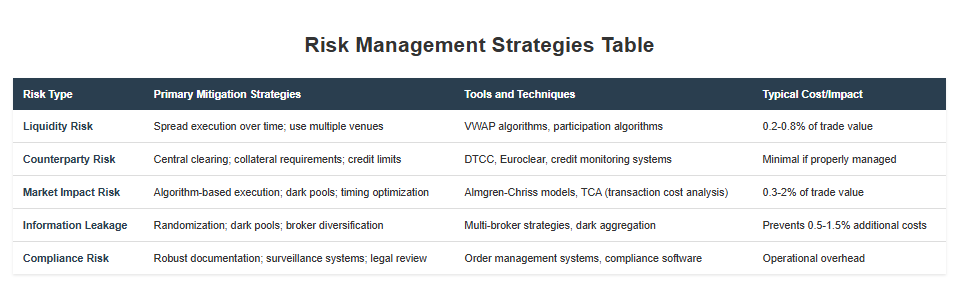
Liquidity Risk is the risk a trade cannot be executed for a desirable price due to a lack of counterparties willing to fill a trade. Institutions that trade assign or measure liquidity based on factors such as Average Daily Volume (ADV), bid-ask spreads, market depth, volatility, and market impact models. Counterparty Risk is the risk of whether the counterparty actually settles the transaction with you. Exchange-traded transactions rely on clearinghouses to guarantee trades, but some trades executed over-the-counter (OTC), which are block trades, require direct settlement between counterparties. The acute awareness Institutions became aware that the risk of counterparty default was due in part to the 2008 financial crisis and the defunct trader Lehman Brothers. Market Impact Risk is the risk a trader's transaction price moves due to their own trading, resulting in an unfavorable price prior to completing their order. Market impact risk can occur in two parts- There can be temporary impact, meaning the price moves against the trader but later partially recovers, and then there is permanent impact which happens when the price moves and stays at a worse level due to the trader's transaction.
Information Leakage Risk is when a trader leaves indicators of their trading to the market, which other traders can make assumptions about. If they believe a trader is building a large position, they can front-run a trader and increase a trader's cost by buying the asset ahead of the trader.
Practical Applications for Investors
Key Takeaways
-
Sprucing up smart money with an example: While sustained block buying over two or three weeks may be a positive signal, you shouldn't chase every block trade, no matter how large it is. You need to ask yourself whether it is accumulation, a one-time event, the type of institution trading, and whether only one institution is moving in the direction of the trade or they are following another institution.
-
Be cautious to not trade right after the execution of large blocks: When big blocks hit the tape, larger prices tend to become delayed. Waiting around 30 to 60 minutes often yields better prices to buy or sell because the temporary impact of large block executions often reverses in time.
-
Look for patterns of block trades: A single block trade can at times be noisy, yet the activity of a few large trades in the same direction over a span of several days can make for more compelling evidence. Institutions seldom all misstep through the same misadventure at the same time.
-
Small blocks can reveal market sentiment: When heavy block selling takes place in a market pullback, it indicates defensive positioning. When heavy block buying takes place in a recovery situation, it indicates institutions see value.
-
Look to ETF block trades to gauge sector rotation: The block trades made by ETFs in a sector can illustrate where institutional funds are rotating. Use this information to adjust you sector allocations.
Block trades are way more than just large transactions; they are insights into institutional intent, markers of market liquidity, and key drivers of price discovery. Studying block trades can allow investors to interpret market signals, obtain a better understanding of execution strategies, and develop a better intuition into market microstructure.
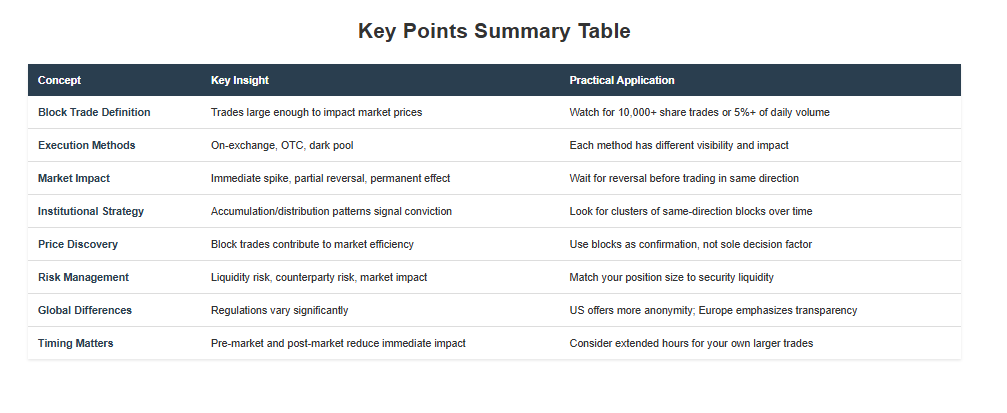
Whether you're a retail investor observing institutional flow, or a professional managing a large position, understanding the concepts behind block trades provides you with a strong analytical framework for effectively navigating financial markets. For more information, please register on tradewill.com today.
Disclaimer: The content of the blog does not represent any position of Trade W, does not serve as any trading-related decision advice, and does not endorse any third-party.