

 Trade W
Why Bollinger Bands Are a Must-Know Trading Tool
If you have ever watched a price chart and asked yourself, 'When can I buy or sell?' you are not by yourself. Many traders will ask the same question: Is this the right time? This is where Bollinger Bands can assist.
Bollinger Bands were invented by John Bollinger in the 1980s and are among the most widely used technical indicators when trading. They have three lines represented on a price chart: a Middle Band (which is a simple moving average), an Upper Band and a Lower Band. The bands of the Bollinger Bands will expand and contract based on market volatility, so it gives you a graphical sense of what the market is doing at the moment.
Let’s say you are watching a basketball game. The court has boundary lines that keep the ball in play. The Bollinger Bands work in a similar way; they are simply indicating the boundary lines where the price typically moves. If you see the ball (price) bouncing against the boundary lines, it tells you something interesting might be happening; it may bounce back toward the centre or it may break through and head into new territory.
Professional traders utilise Bollinger Bands in every major market. Regardless if you're looking to trade Apple stocks or Tesla stocks, following the S&P 500, trading forex pairs (like EUR/USD) or speculating on Bitcoin, Bollinger Bands will help identify volatility and turning points. In 2019, when the stock market volatility peaked, many S&P 500 traders used Bollinger Bands to catch trend reversals before stocks moved sharply in price, transforming uncertainty into opportunity.
What is so helpful about Bollinger Bands is that they not only provide entry and exit signals. They are also a visualisation of something even more primal: market volatility itself. When the bands loosen, you are seeing volatility increase and big moves occurring. When the bands tighten, you observe calmness or consolidation in the market. In that respect, Bollinger Bands take on less of a crystal ball and more of a market thermometer; they show you what temperature the market is running at.
With Bollinger Bands in your skill set, you can provide yourself with an edge over firsthand trading experience, regardless of whether you are a brand new beginner or an advanced trader. They aren't magic, but they do provide context that just observing price action won't provide.
Understanding the Components and Calculation of Bollinger Bands
To begin trading using Bollinger Bands, it’s best to understand the mechanism of how they work. The math isn’t hard, it’s one of those things where once you understand the math of the indicator then everything else will follow.
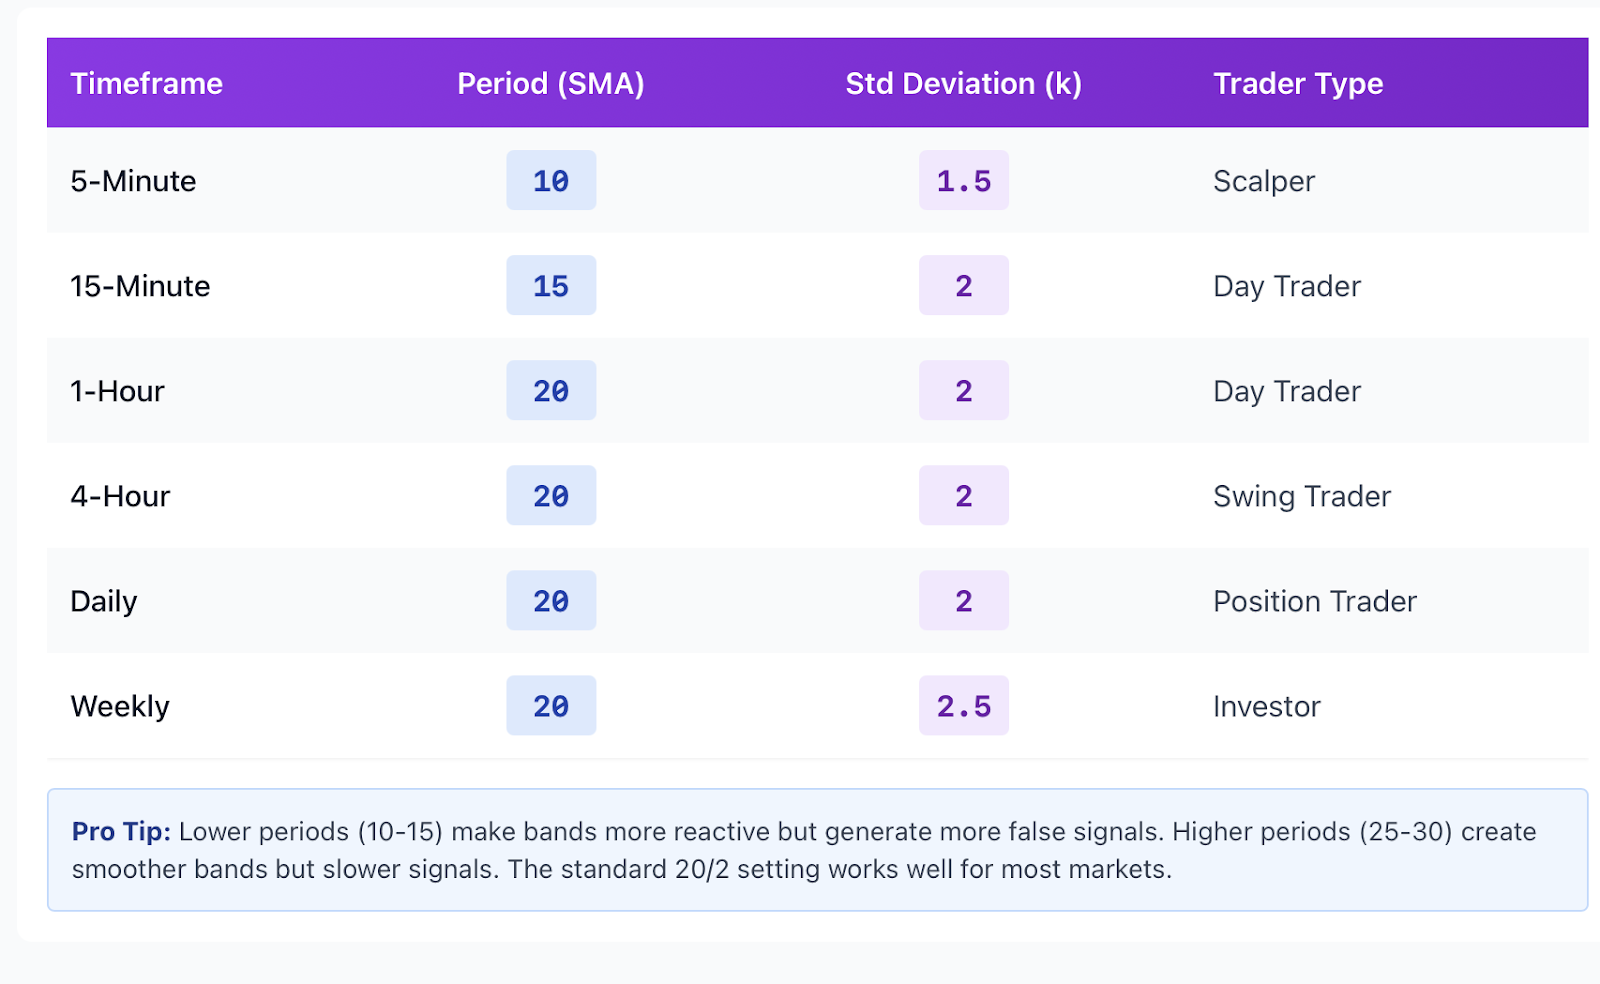
The Middle Band is a Simple Moving Average (SMA) and will most usually be set with a period of 20. The SMA takes the closing prices of the last 20 candles - days, hours, or minutes - based on your timeframe. The Middle Band, or the SMA is the representation of the "average" price behavior over the period that you have selected.
The Upper Band and Lower Band are calculated by adding and subtracting from the Middle Band whereas this is a multiple of the standard deviation. This formula can be summarized as:
Upper Band = SMA + (k × Standard Deviation)
Lower Band = SMA - (k × Standard Deviation)
The "k" value is usually assigned to the value of 2 meaning the Upper and Lower Bands will fall two standard deviations away from the middle band (SMA). Standard deviation is a measure of how spread out the price is and is basically a measure of how volatile the market is. When prices have larger swings the standard deviation (and thus the bands) would widen. When the price is moving calmly then the standard deviation would reduce and the bands would narrow.
To illustrate this in a way that's easy to digest, consider price movement like waves hitting a beach. In times of calm, the waves are small and close together. In stormy waters, the waves are larger and separated. Bollinger Bands represent the distance between calmly measured waves and the most extreme waves over the measurement period of your choice. The larger the waves, the wider the bands.
To better demonstrate, let's use EUR/USD on a daily time frame. If your 20-day SMA is 1.1000 and your standard deviation is 0.0050, and you decide to use k = 2, the Upper Band would be represented by adding together the following: 1.1000 + (2 × 0.0050) = 1.1100. The Lower Band agreed upon would be represented as follows: 1.1000 - (2 × 0.0050) = 1.0900. Day-to-day volatility would adjust the respective bands based on volatility.
You can adjust the parameters based on your trading style or philosophy. Short-term traders may decide to utilise a 10-period SMA with 1.5 standard deviations in order to get signals quickly. On the other hand, long-term investors may decide to maintain the 20 periods and keep k = 2 in order to decrease volatility. Any changes in your selected settings would also affect the frequency with which price intervenes with either band, and the sensitivity of the signals themselves.
There is also a direct correlation between the width of the Bollinger Bands relative to market trends. Wide bands indicate a strongly trending market, which we define as price movement in one direction with higher volatility, while narrow bands indicate a consolidation in the price, implying low volatility and are often the calm before the storm.
When we are watching Bitcoin price action, we notice that prior to large rallies or crashes, the bands, when drawn on the chart often squeeze tight, meaning the market is gathering momentum. It is not simply just to understand these components to put it into practice. Once you understand what causes the bands, you will be able to visualise their signals with conviction as opposed to going on and merely following them blindly.
Basic Bollinger Bands Trading Strategies
Now let's address the practical part – how do we approach actual trading with Bollinger Bands? Let’s discuss the most common strategies that you will find in various markets and timeframes.
Touching Upper Band to Sell / Lower Band to Buy
The simplest of the Bollinger Bands strategies. When price touches or breaks above the Upper Band, price is overbought and you are looking for selling opportunities. When price touches or breaks below the Lower Band, price is oversold and you are looking for buying opportunities.
You can think of the price movement like a rubber ball bouncing around in an enclosed room. When the ball hits the ceiling (the Upper Band), it’s likely to bounce back down. When it hits the floor (the Lower Band), it’s likely to bounce back up. The bands are dynamic and act as levels of support and resistance which can shift based on market conditions.
On the S&P 500 daily chart, the price sometimes touches the Upper Band during a strong move up before pulling back towards the Middle Band to decide what the price is going to do next. A trader who sells near the Upper Band and buys near the Lower Band is taking a mean reversion trade; that price is likely going to come back towards the mean or average priced traded.
However, this strategy is primarily effective when traded within a ranging market. If the market is in a strong uptrend, price can "walk the band," whereby price can hover near the Upper Band for an extended period of time. If you sell each time price touches the Upper Band, you may find yourself fighting a freight train.
Middle Band as Support/Resistance Strategy
The Middle Band (the 20 period SMA) often acts as a dynamic support/resistance level. During an uptrend, price will remain above the Middle Band and use it as support. During a down trend, price will remain below the Middle Band and regard it as resistance.
When prices are above the Middle Band and pull back to touch it, it's generally a buy signal during an uptrend. When price is below the Middle Band and rallies back to touch the Middle Band, it's generally a sell signal during a down move. The Middle Band can be used as your trend filter.
Bollinger Band Squeeze (Breakout) Strategy
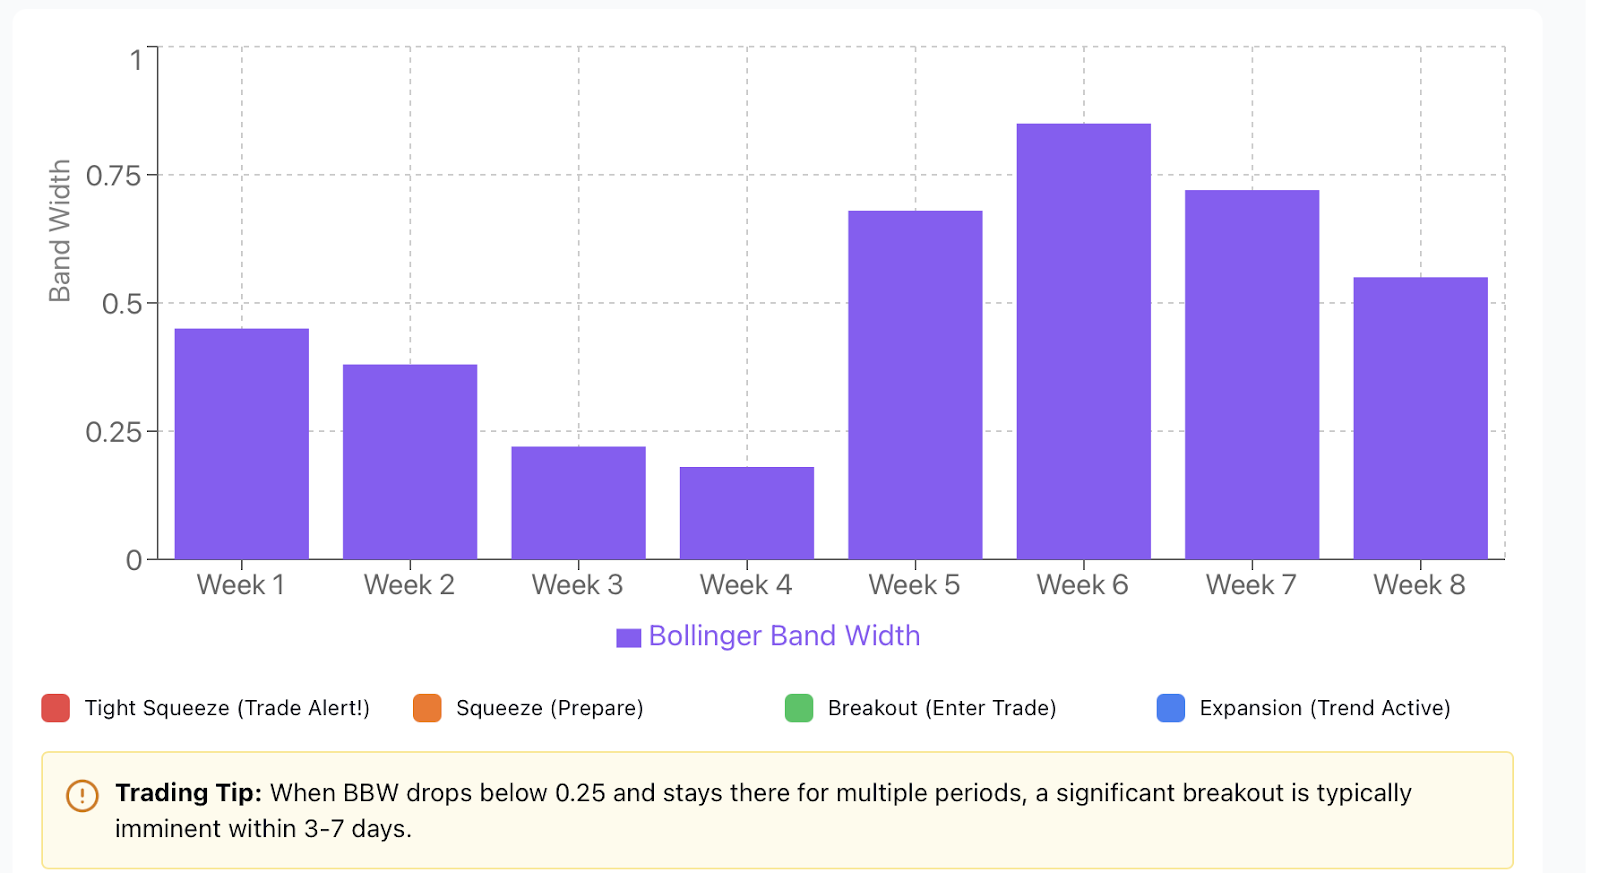
This is where trading gets a little interesting. A "squeeze" occurs when the bands narrow considerably, which indicates exceedingly low volatility. Markets are not quiet for long periods of time. A squeeze generally precedes a big move (up or down), which we will talk about later. However, the squeeze bands, alone, do not give the direction of the breakout.
Visualise it as partially compressing a spring. The tighter you jam the spring, the more explosive the spring's release. During the 2020 gold consolidation, we saw multiple daily squeezes. Each time the bands contracted significantly, there was an explosive breakout event within a few days, providing ample opportunity for many traders who were prepared to profit from the breakouts.
To trade squeezes, you want to spot the bands narrowing down to their tightest levels in recent history. Then wait for a decisive breakout to occur above the Upper Band or below the Lower Band. Whichever level breaks is your trade direction. Many traders utilize the Bollinger Band Width Indicator (BBW) to have a numeric value of the squeeze; when the BBW is at multi-month lows, be assured a breakout is imminent.
The Bollinger Band Width Indicator
Bollinger Band Width is a measure of the distance between the Upper and Lower Bands. The formula for Bollinger Band Width is:
BBW = (Upper Band - Lower Band) / Middle Band
BBW has a high value when trending, volatile markets are occurring. Conversely, BBW has a low value when ranging, quiet markets are occurring. By measuring BBW over time, you can identify different market regimes and respective trading strategies accordingly. Trade breakout strategies when BBW is expanding. Use mean-reversion strategies when BBW is well above average but is starting to contract.
Trend-Confirmation Use
Let the trend be your friend, even when using Bollinger Bands. The best traders use the bands to confirm trends, not contradict them. That's why if the overall market is trending up (price is above the Middle Band), your best action is to buy when price touches either the Lower Band, or touches the Middle Band. Don't be concerned with potential "sells" at Upper Band until the trend is potentially reversing.
The reverse is true in downtrends. If price is below the Middle Band, look to short when price rallies to either the Upper Band or that touches the Middle Band. again, don't try to catch falling knives because price touched the Lower Band.
Risk Management
Strategies mean nothing without proper risk management. When following even potential Bollinger Band setups, consider placing stop-losses just outside of opposite band. If you're buying at lower band, your stop might go just below the recent swing low or slightly below lower band.
Position sizing matters also. Just because you have a trade signal doesn't mean you should place your entire account at risk. Many professional traders risk no more than 1-2% of their accounts on each trade regardless of confidence level. Bollinger bands give you context and timing but discipline keeps you in the game long enough to be profitable.
Advanced Bollinger Bands Strategies and Indicator Combinations
After you've become proficient in the fundamentals, it's time to turn things up a notch. Bollinger Bands are much more effective when combined with other indicators. This is how traders use it.
Bollinger Bands + RSI: Filtering False Breakouts
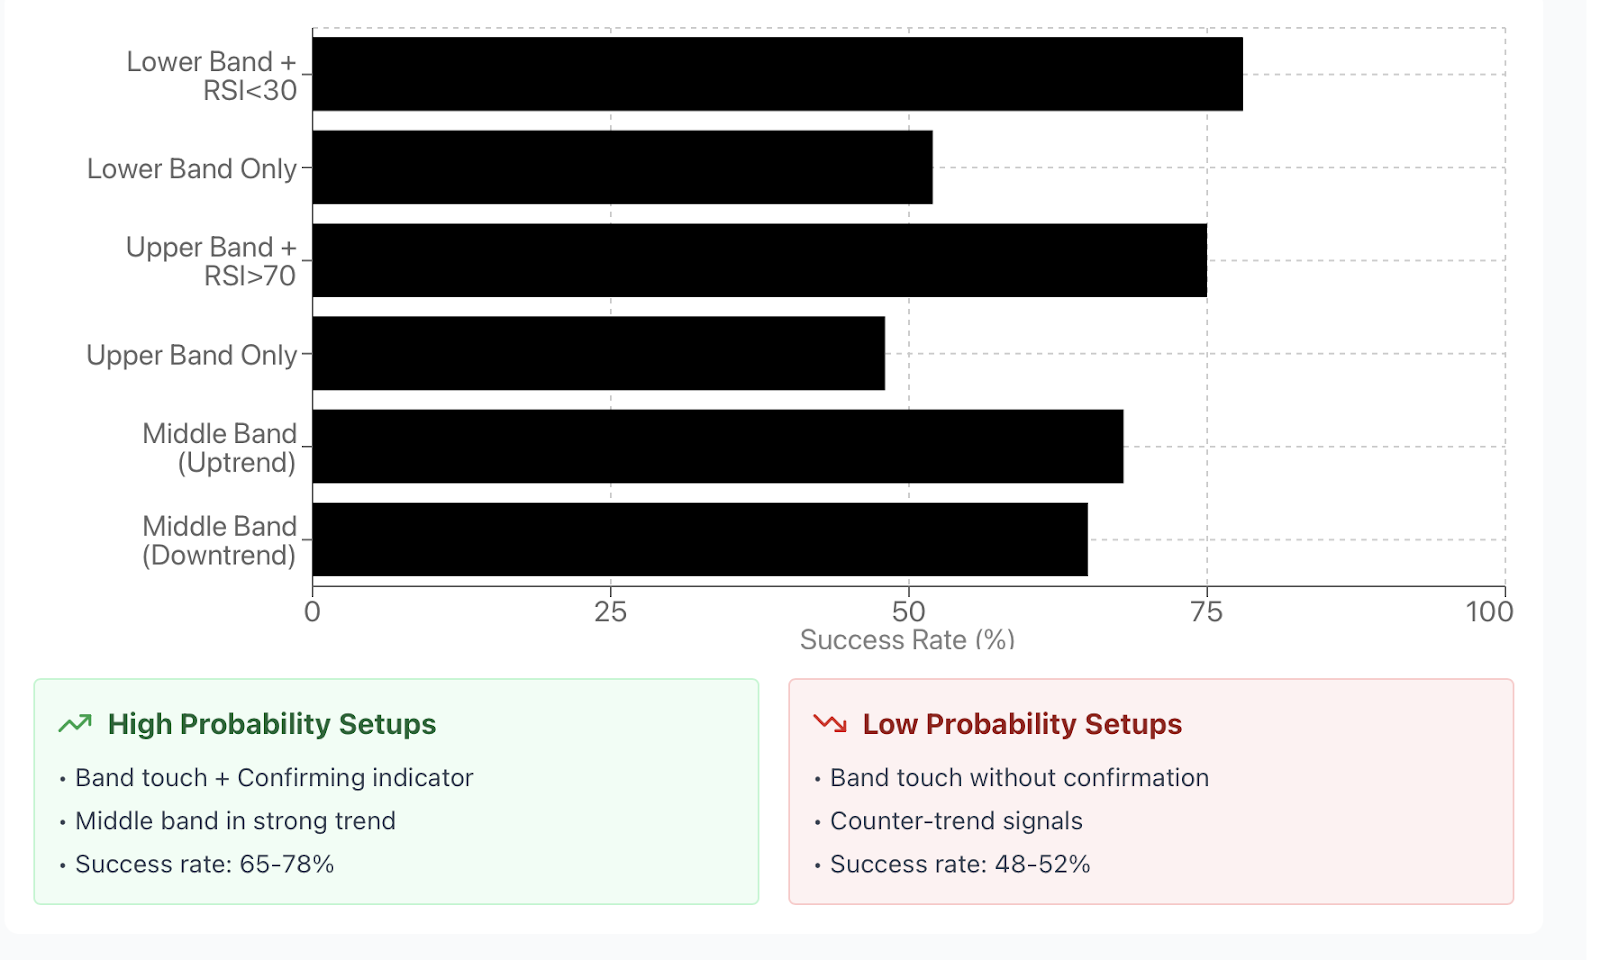
The Relative Strength Index (RSI) is a measure of momentum and overbought/oversold conditions. When paired with the Bollinger Bands, the trader can filter out low probability trades.
Here's the setup: Wait until the price touches the Lower Band before looking to buy, and check to see if the RSI is below 30 (oversold) which confirms that momentum has reached an extreme. Now, if the price touches the Upper Band, you will only consider selling if the RSI is above 70 (overbought).
This pairing drastically reduces false breakouts. Oftentimes, price will touch the bands a few times during choppy markets with no meaningful reversal. The RSI is used a second opinion to see if momentum is backing that move as well. If traders traded the 2021 rally of the Nasdaq 100 and waited for the RSI to confirm on the touches, they would have avoided several false breakouts and stayed in profitable trends much longer.
Bollinger Bands + MACD: Confirm Trends
The Moving Average Convergence Divergence (MACD) indicator is useful for determining the strength and direction of trends. The MACD can be combined with Bollinger Bands to create a solid trend-following system.
Bollinger Bands help identify zones of potential reversals, then you can use MACD to confirm the trend direction. For example, the price is at the Lower Band of a downtrend, you would wait for the MACD to provide a bullish crossover (the MACD line crossing above the signal line) before entering long. This ensures you are not trying to catch a falling knife entering when the momentum is actually shifting.
In an uptrend when the price comes down to the Middle Band, check the MACD. If the MACD is still positive and not showing bearish divergence, you are probably looking at a legitimate buying opportunity. However, if the MACD is starting to weaken, it could be an indication that the trend is losing momentum and you may want to be cautious.
Multi-Timeframe Strategy: Combining Daily and Hourly Signals
Professional traders never consider a single timeframe. They consider multiple timeframes to build a holistic picture. Below is a strong multi-timeframe methodology:
-
Check the daily chart to determine the primary trend. if price is above the Middle Band on the daily, you are in an uptrend.
-
Go to the hourly chart and monitor for price to touch the Lower Band or Middle Band on that timeframe.
-
Enter long on the hourly chart knowing the daily trend is with you.
Above methodology provides you the ability to enter trends at a better price with diminished stop-losses. If you trade EUR/USD, this methodology is gold. The daily chart is determining the big picture (uptrend, downtrend, or a range) and you are looking for an entry point on the hourly chart.
Think of it in terms of zooming in and out on a map. The daily chart is your overall view of the terrain, and the hourly chart is the close-up view of the exact turn you have to make. The combination of both provides confidence and precision.
Backtesting: Validating Strategy with Historical Data
Before you start putting in and putting at risk real money, use backtesting to help validate your strategy and approach before you risk real money. Backtesting means we take the rules of our trading to past market data to see what would have happened to our parameters. Many platforms make it relatively easy to backtest.
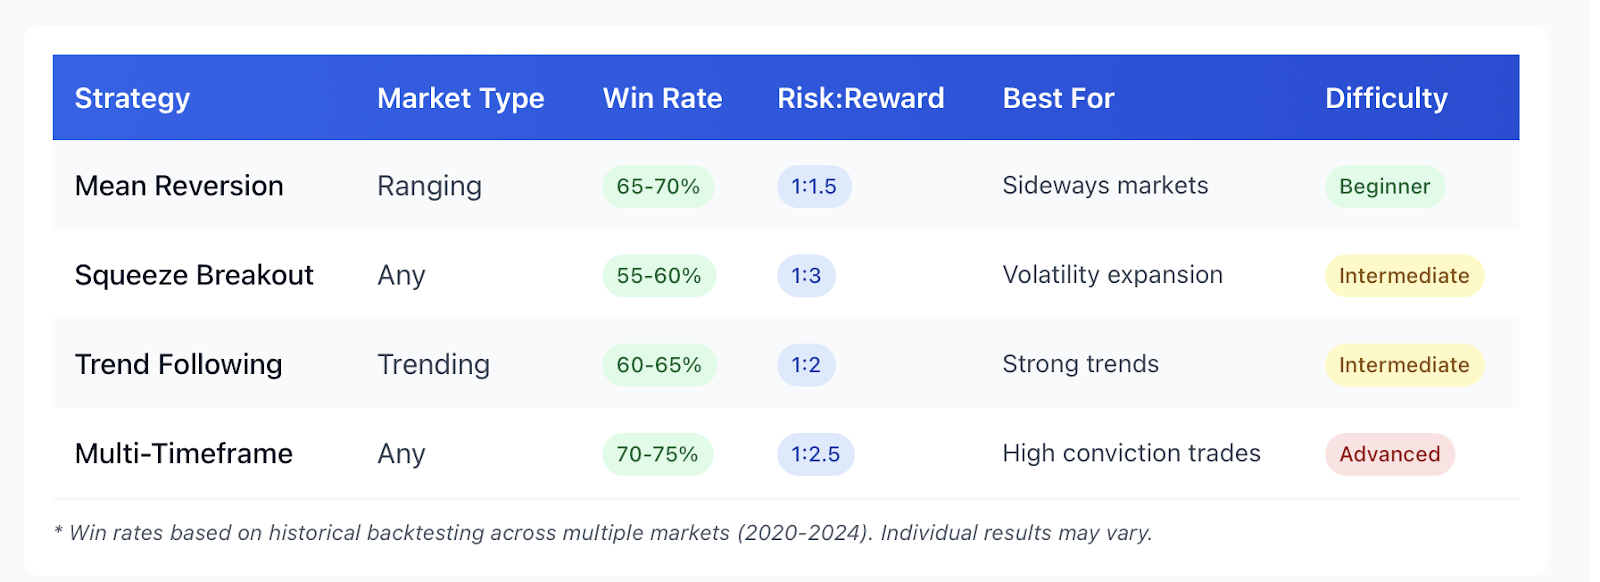
Backtest your Bollinger Bands strategy across multiple markets and timeframes and track win rate, average profit per trade, maximum drawdown, and so on, to confirm whether your approach really has an edge or whether you are just gambling. For example, perhaps you find out that buying the Lower Band works pretty well with forex markets, but not with crypto. Or, your outward squeeze breakout is good on daily timeframes, but inconsistent on 5-minute timeframes.
Backtesting removes the guesswork and puts you on a data basis! Just because past performance does not guarantee future results is okay (but still is certainly better than trading prospectively without an idea about results). Tweak your parameters for backtesting again and repeat until you have a plan or approach that you resonate with.
Real-World Example: EUR/USD Multi-Timeframe Analysis
To summarize everything together with a practical example. Think about a trade on the EUR/USD on a typical day:
-
Daily chart: The price is above the 20-day Middle Band, and the daily trend is bullish. The Upper Band is at 1.1200, the Middle Band is at 1.1000, and the Lower Band is at 1.0800.
-
1-hour chart: The price has just touched the Lower Band at 1.0950 (meaning the market is pulling back in the daily bullish trend). The RSI on the 1-hour just dipped to 28 (oversold), and MACD has begun to show early signs of a bullish crossover.
This is your setup to trade. You would buy at 1.0960, with a stop-loss at 1.0920 (below the 1-hour Lower Band) and a target at 1.1100 (more or less at the daily Middle Band). You are backed by the daily bullish trend, the pullback on the hourly chart gives you an entry, and the RSI and MACD confirm that momentum is potentially shifting.
In this case, you stacked probabilities in your favor by using and combining the lower timeframe with a higher timeframe and indicators. You are not guessing, you are trading in context with confirmation and a plan.
Common Mistakes and Cautions with Bollinger Bands
The most sophisticated tools can easily fail if they are used incorrectly. In this article, we’ll discuss the Bollinger Bands errors we see most often, as well as how to avoid them.
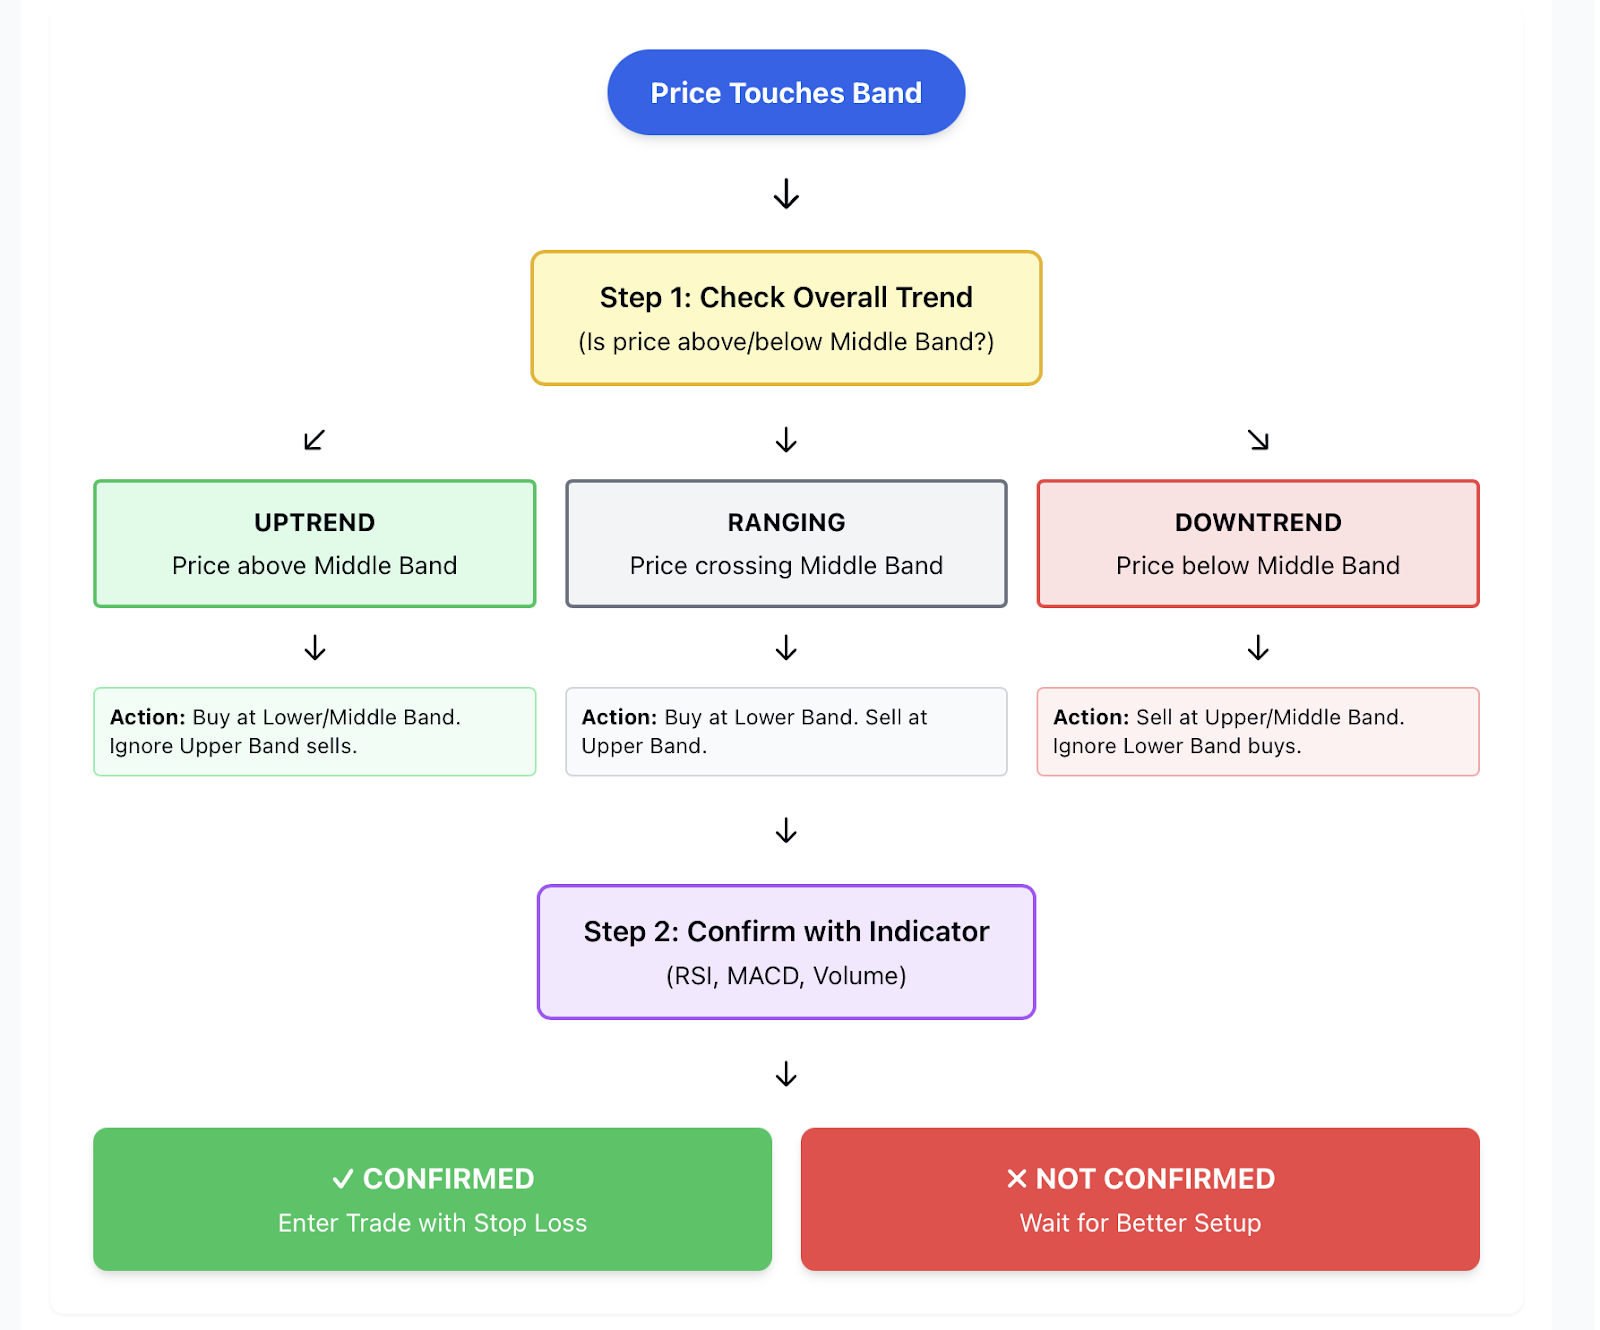
Error: Blindly Chasing the Upper/Lower Bands Without Context of a Trend
The biggest mistake new traders make is treating a band touch as an automatic signal—if price touches the Lower Band, we buy; if price touches the Upper Band, we sell. It sounds simple right?
Not so fast. In a strong downtrend, price can remain near the Lower Band for weeks, resulting in constant “buy” signals that incur losses. In a strong uptrend, price tends to walk along the Upper Band, so every “sell” will result in loss as well.
Like our analogy of basketball mentioned earlier—even if the ball hits an out of bounds line, it does not guarantee the ball will start moving back toward the middle of the court. If it is pushed by a strong wind (trend) caught in that direction, it may remain by that out of bounds line; possibly even crossing the line! Before you act on your Upper/Lower band touch, always check the broader context first.
Error: Not Considering General Trend
Bollinger Bands are indicators of volatility, and do not provide general trend indicators—when the bands are outside proportion to their normal volatility. They take the price and volatility into consideration, and suggest where the price is located in relative proximity to average moving for a recent time period, but they cannot tell you whether likely moving averages are up, down or sideways over the longer term.
Trend analysis should always be used in conjunction with Bollinger Bands. Is the market trading above or below significant moving averages? Are you observing an uptrend with higher highs and higher lows, or a downtrend with lower highs and lower lows? What is the fundamental context?
During the downturn in the U.S. stock market in 2022, many traders were hurt buying "oversold" signals at the Lower Band expecting them to rebound quickly. However, the bias was down; they rebound, but it was only just a temporary reflection before the larger decline continued. They would have saved a large sum of capital had they respected the trend.
Be Cautious: Combine with Volume, Indicator Context, and Macro Context
Bollinger Bands work best as part of a complete trading system. Check the volume - is the band touch taking place at the high or low volume? High volume will add conviction to the signal. Low volume will indicate weak interest and a higher probability of a false move.
Check for confirmation with other indicators like RSI, MACD, or stochastic oscillators, and don’t ignore the macro picture. Are central banks raising rates? Is there a geopolitical crisis arising? Technicals don’t exist in a vacuum.
Think of trading as a house. An example would be a Bollinger Bands can be seen as one crucial support beam but a house can’t be built with just one beam; you will need walls, a roof, and a foundation. Likewise, to build a robust trading strategy, you will need to analyze volume, and use indicators, risk management, and stay aware of fundamentals.
Watch for False Breakouts
Squeeze breakouts can be very rewarding trades; however, they can also be a trap. The price sometimes breaks out of a squeeze and triggers entry and stop orders only to reverse back inside the bands. This is called a false breakout, which negatively penalizes traders who chased the trade too aggressively.
To avoid a false breakout, wait for confirmation. Don't take the buy or sell signal the instant the price breaches a band, wait for a candle to close directionally decisive outside the band. Alternatively, waiting for a retest of the broken level can further mitigate false signals.
Historical data indicate that false breakouts are more prevalent in choppy, low-volume market conditions. If there is a major news event or during market lulls, add an extra level of caution to breakouts.
Bollinger Bands Are a Tool, Not a Guarantee
Ultimately, just keep in mind that no indicator is perfect. Bollinger Bands, for instance, will give you probabilities and not certainties with setting up trades, and the setups suggested in terms of probabilities can fail and lose. The markets are based on human psychology, news events, and so many variables that no indicator distills to a full representation of price movement.
So use Bollinger Bands as a guide, not a 100% sure way to trade direction. You also need risk management, emotional management, and learning over time. The traders that do well are not the ones with the perfect indicator, but the ones that identify good risk, adapt and evolve as conditions change
Conclusion and Practical Trading Tips
Bollinger Bands are highly adaptable trading instruments. They allow you to visualize volatility, identify potential reversal areas and identify timing for entries in trending or ranging markets. However, like any instrument, they need to be understood and practiced to use beneficially.
Let's review the main ideas:
The Band formula: Middle Band = 20-period SMA / Upper Band (Lower Band) = SMA ± (2 x Standard Deviation). You have now have adaptable support and resistance levels that adjust to market volatility.
Plain strategies: Buy at the Lower Band ; Sell at the Upper Band in ranging markets; Use the Middle Band as trend support/resistance; Trade squeeze breaks when bands are in contraction (squeeze); Confirm your trade with trend direction before you take the entry.
Advanced strategies: Use Bollinger Bands in conjunction with RSI to filter erroneous signals; Use tools like MACD to confirm your trend; Use multiple time frame analysis to correlate big picture trend with more exact entry; backtest your method before you start trading it live.
Risk management: Place stops outside the opposite bands; always use 1-2% risk per trade; Don't overtrade because you see a signal; Quality over quantity always.
Common Errors: Don't go ahead and blindly use the band touches without confirmation of the trend. Don't trade without volume and other indicators. Look out for false breakouts especially in low-volume situations.
Are you ready to put this to work? I would recommend starting on a demo account. Run these strategies in multiple marketplaces—stocks, forex, cryptos, commodities. You will begin to see how Bollinger Bands act differently in trending conditions vs. ranging conditions. Keep a journal of your trades and essentially track what worked and what didn't.
Start with one or two strategies. Get the squeeze breakout down, or the multi-timeframe strategy, before heading into trying to use every technique. Slow down and the confidence will come, but only if you scale position sizes, only when you have proved consistent profit.
Don't forget, trading is not a sprint, it is a marathon. We are not trying to get rich quick. We are trying to build a reliable edge we can call on consistently over time. Bollinger Bands give you that edge, but only if you use them with discipline and risk management, along with your patience.
Ready to take your trading to the next level? Stop guessing and start trading with confidence. Grab your free Bollinger Bands cheat sheet and join thousands of traders who've transformed their technical analysis game—your breakthrough trade could be one squeeze away.
Disclaimer: The content of the blog does not represent any position of Trade W, does not serve as any trading-related decision advice, and does not endorse any third-party.