

 Trade W

Understanding the bond market involves more than just knowing that when interest rates rise, prices fall. There is a hidden factor in determining how an investor is going to react to interest rate risk. This is referred to as "bond convexity," which is an indicator of additional price movement based on the measurement of the bond's Duration.
The best way to understand Convexity is to think of duration as a straight line between interest rate changes and price changes. Convexity is similar to a curve on the regression line of price changes in the bond market. During a volatile rate environment like 2026, the difference between being able to protect your bond portfolio versus seeing it crash could depend on how you factor Convexity into your investment decisions.
What is Bond Convexity? Understanding Bond Price Curvature
Bond duration has been the most popular measure for many years for estimating how much a bond's price will change due to interest rate changes. For example, if you have a bond with a five-year duration, and interest rates rise by one per cent, your bond's market value should drop about five per cent.
Unfortunately, bond duration is only a small part of determining the relationship between bond prices and interest rates because it is only relevant to small changes in interest rates. Bond price and interest rate volatility do not follow a straight line, but rather form a curved line.
The term bond convexity refers to the way that a bond's sensitivity to interest rate changes will be different at different points in time. Bond Convexity uses complex mathematical calculations to find out how bond prices change with respect to interest rates; It finds the second derivative of the bond price curve. Although it sounds difficult, in practice, convexity is an excellent tool for measuring how much a bond has changed in terms of its sensitivity to interest rates.
The formula looks like this:
Convexity = [P(y-) + P(y+) - 2P(y0)] / [P(y0) × (Δy)²]
Where P(y-) is the bond price if rates fall, P(y+) is the price if rates rise, and P(y0) is the current price.
For example, take a U.S Treasury Bond that has a coupon rate of 4% and is currently priced at par (i.e., $1,000). This bond would have an approximate duration of 8.5 years. If there is an increase in market interest rates from 4% to 5%, the expected change in price of the treasury bond can be predicted, using the duration of the bond, to be 8.5% for an approximate new price of $915 ($1000 - $85).
However, the actual price for the bond is closer to $922 ($1000 - $78), which means that there is a $7 discrepancy between the predicted market price based on duration and the actual price of the bond. The reason for this difference is referred to as "convexity." As interest rates rise, the decrease in market price for the bond is slightly less than predicted based on theoretical duration alone, due to the curvature of the yield curve.
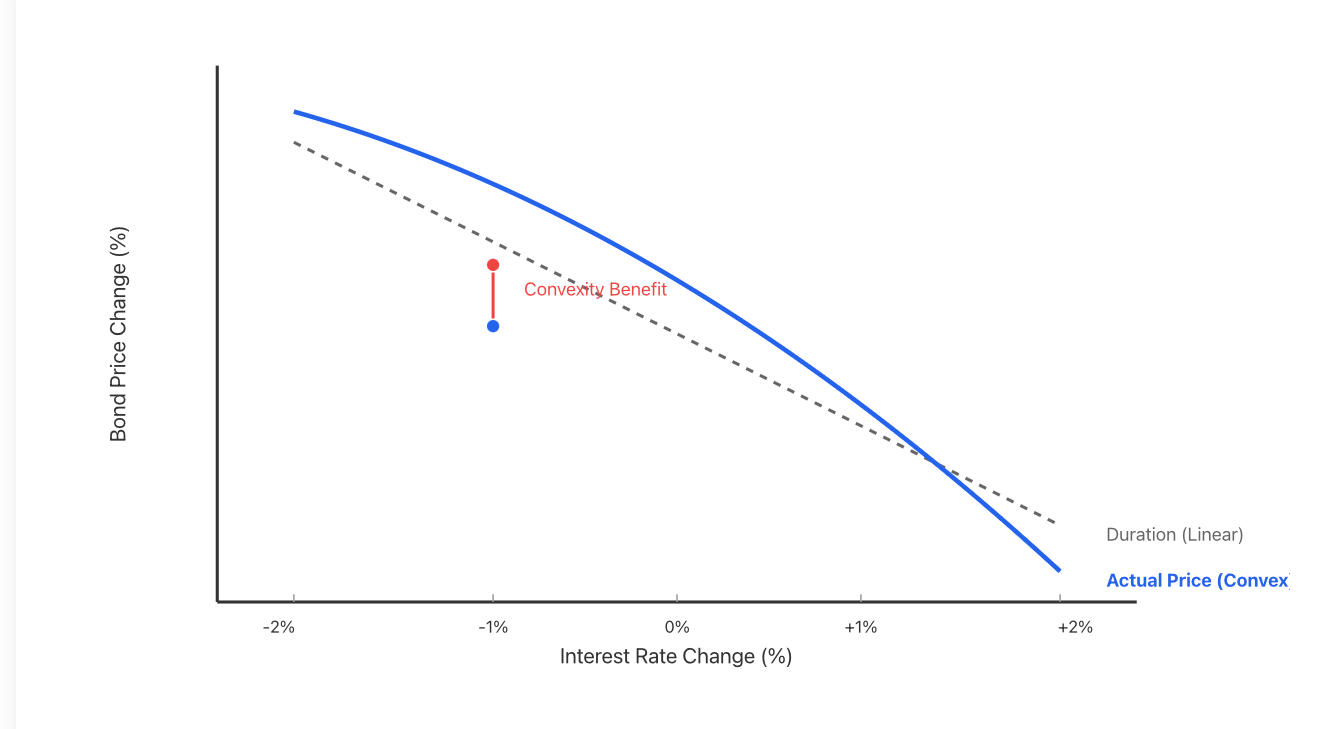
To visually explain this concept, one can use the example of a traditional savings account. If I were to deposit $1,000 in a savings account for one year at a 3% interest rate, I would expect to receive $30 interest. If I double the interest rate to 6%, I would expect $60 in interest. Therefore, this is a straight-line relationship between the deposit amount and the amount of interest.
On the other hand, a bond has a non-linear return profile. If I purchased a bond with a 4% yield, and at the end of the year the yield decreases to 3%, then my bond value increases by an additional 9%. But if my bond yield increases from 4% to 5% during the same year, then the market price for my bond decreases by only 8%. Therefore, the return on bond investments is affected in a curved manner between the yield and the price.
This has important implications in the real world. After the 2022 rate shock, as the Federal Reserve raised interest rates by 4.25% in the course of 12 months, those bonds that had higher convexity were negatively impacted in greater amounts than what Duration models would have indicated. The investors who understood the concept of convexity were able to better manage the impact of interest rate changes on their bond investments.
Conclusion: Duration provides a general guideline of the sensitivity of bond prices to interest rate changes. However, Convexity reflects the non-linear nature of the relationship between bond yields and bond prices, which cannot be accurately captured by Duration.
Positive vs Negative Convexity: How to Interpret Bond Curvature
There is a difference in the quality of convexities, with both the sign and magnitude being important when assessing it.
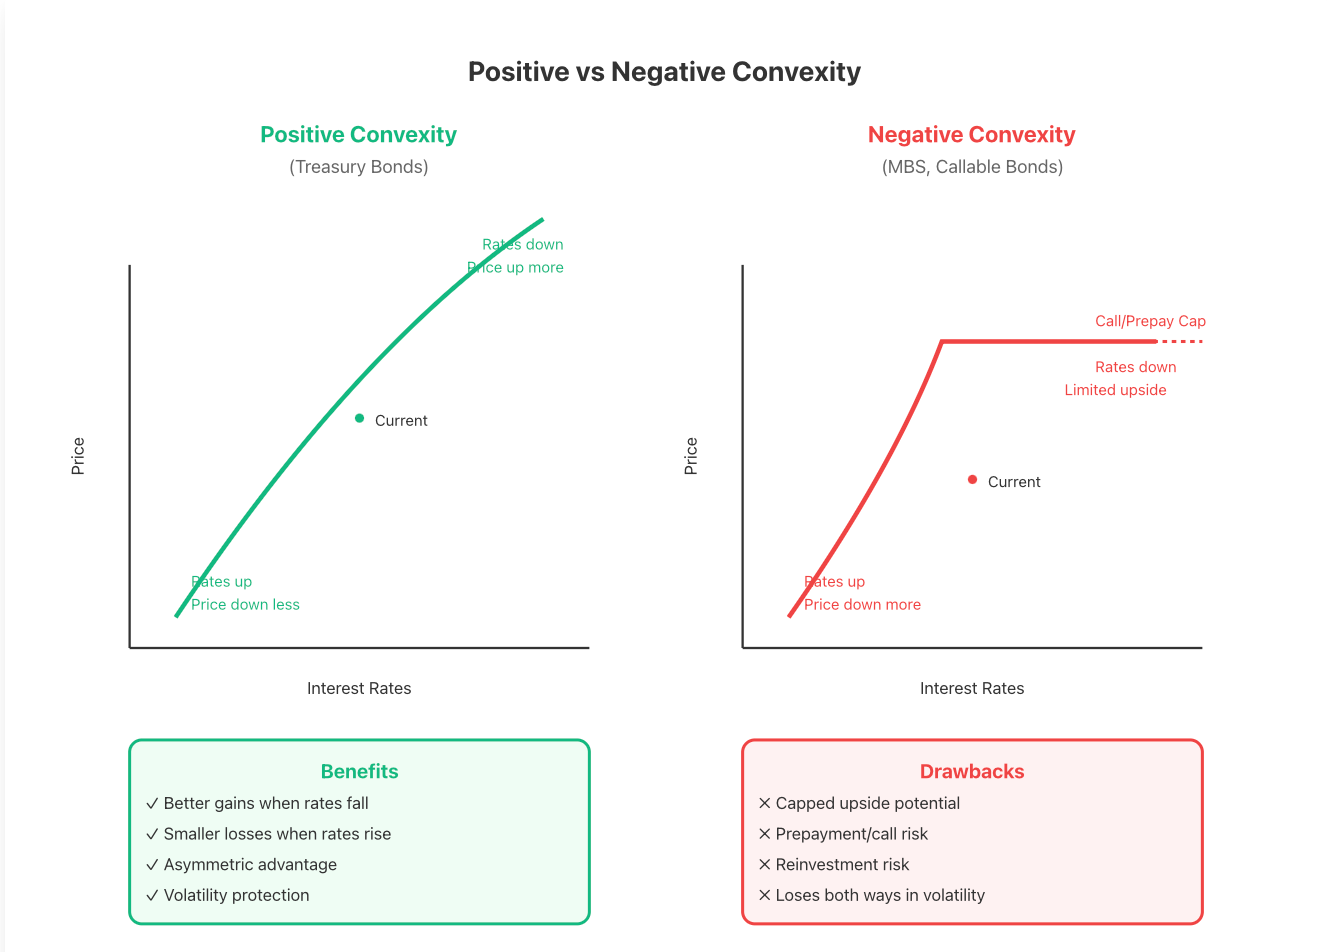
Positive convexity is often associated with the majority of plain vanilla bonds. Positive convexity indicates that as rates decrease (a 1% drop), the value of the bond will increase at a higher rate than it would decrease if interest rates were to rise (a 1% increase). As stated previously, a 10-year U.S. Treasury bond has positive convexity; therefore, if interest rates fell by 1%, an investor would receive a 9% increase in the value of their bond, whereas if interest rates increased by 1%, the value of the bond would decline by only 8%, resulting in asymmetrical returns that favour the bondholder.
When plotted graphically, a positively convex bond would have a price curve that is upward sloping when the interest rates are low compared to the negative asymptote of the price curve when the interest rates are high.
Negative convexity has the opposite effect of positive convexity. It typically can be found in mortgage-backed securities (MBS) and callable bonds. In this case, there is an embedded option that ultimately reduces the potential returns for investors of either asset type.
Taking an example of a callable corporation, borrowers have the right to call the bond if interest rates decrease significantly; therefore, if a borrower were to call a corporate bond, the bond's value would increase, but it would be capped at the maximum call price as interest rates decline. As interest rates rise, the bond price would decline, but the bondholder would miss out on capital appreciation.
Like MBS, historically, homeowners would have refinanced their existing residential mortgages as interest rates decreased. As such, the mortgages would have been paid off early, resulting in an investor being forced to reinvest at lower interest rates, causing the bondholder to receive little or no capital appreciation.
The most suitable analogy is to assume positive convexity as a spring. When you compress a spring (an increase in interest rates), it pushes back with force; when you pull it to an extent (a decrease in interest rates), it stretches back further. With negative convexity, like glue, you would not be able to have the bonding force for movement in either direction, but you would primarily be limited to the gain potential.
In 2008, the difference between negative and positive convexity became extremely clear. As the Federal Reserve slashed interest rates to zero, the bondholders of plain vanilla Treasury bonds were inundated with massive capital appreciation. Over 13% gains to Treasury bond funds that year. In contrast, most MBS investors realised limited capital appreciation or incurred losses due to prepayment risks imposed on the holders, therefore, removing positive convexity.
For a more professional example, we can analyse a 10-year U.S. Treasury Bond with a duration of 8 and a convexity of +85 compared to an equivalent MBS with a duration of 8 and a convexity of -20. In a stable interest rate environment, both bonds would provide similar performance. Yet, should interest rates change by 2% in either direction, the Treasury bond would provide significantly better capital appreciation.
Key Takeaway: Positive Convexity means you could receive greater benefits from the fluctuations in interest rates. Negative convexity means that your investments will incur a high level of volatility. Keep this in mind before an increase in interest rates.
The Pitfalls of Negative Convexity: Risks in MBS and Callable Bonds
The following explanation describes how negative convexity can arise, as well as its associated dangers.
Negative convexity arises from perverse structural incentives inherent in first-position fixed-rate residential mortgages (such as MBS), whereby the mortgage issuer has the right (also called an option) to call or prepay the mortgage. Therefore, MBS will produce a cash flow for the investor in the event of refinancing. Consequently, when a borrower refinances at a lower interest rate, that borrower will often take advantage of this “free option” provided by the mortgage issuer to call and prepay the mortgage.
For example, a corporation may issue a twenty-year callable bond with a call provision of up to ten years; after five years, the corporation may call the bond and incur a cost of paying back the bondholder at the par value plus an additional sum for call premiums. The callable bondholder would have an appreciation of $150 in value per bond based on the bond's yield, which could earn as much as 6% because of falling interest rates.
On a similar basis, MBS experience the same impact of negative convexity on an aggregate basis. MBS experienced substantial cash flow prepayment due to the rise and fall of interest rates. When interest rates fall by 2% (from 6.5% to 5.25%), the borrower of an MBS will often refinance their mortgage. Thus, when most homeowners are refinancing their mortgages, a bondholder would receive a prepayment of their initial investment immediately before the reinvestment of their principal into fixed-rate MBS with lower yields available.
The analogy can be similar to that of a homeowner prepaying their mortgage. If a homeowner has a rental home and, after interest rates decline, the homeowner decides to purchase the rental property. The rental property owner loses their steady stream of rental income, along with incurring costs in attempting to find and retain a new tenant.
Many distressed MBS investors learned about this phenomenon during the 2003-2004 refinancing wave, when interest rates fell from 6.5% to 5.25%. Their returns were 6% to 8% below that of non-callable Treasury securities.
The impact of negative convexity on callable corporate bonds is equally as damaging. For example, when the Federal Reserve lowered interest rates in 2020 to zero, many corporations were able to refinance many of their outstanding debt securities. Consequently, most bondholders who anticipated a future gain from declining interest rates instead experienced losses.
Things get worse in volatile environments. As interest rates continue to swing dramatically, the negative convexity risk in these bonds becomes exacerbated. As an example, bonds with negative convexity will lose both through rising rates and also through falling rates. Thus, a bondholder will find themselves caught in the middle of a negative convexity situation.
Mitigation techniques do exist. Investors should avoid purchasing callable bonds unless the yield differential offsets the negative convexity exposure which is typically a minimum of 0.5% to 1% more than a non-callable security. For investors in MBS, they should consider investing in tranches that offer the prepayment protection feature, or invest in commercial MBS where the likelihood of refinancing is less prevalent.
For investors who want to minimize their negative convexity risk exposure, many utilize the use of interest rate derivatives to offset the negative convexity risk, effectively repurchasing the options associated with positive convexity. Although they are a viable alternative, they increase the complexity and costs associated with potential future interest rate fluctuations.
To summarise, while negative convexity bonds may provide higher overall yields, the better the investors' yields may be at certain times, they substantially affect the investors' upside potential, potentially leaving investors with limited opportunities to recapture their original investment by repurchasing the call option associated with these bonds.
Interest Rate Cycles and Convexity: How Bonds Respond
Interest rates move in cycles. Understanding how convexity performs in each cycle will help you determine where to position your portfolio.
Rising rate environments: Duration hurts, and Convexity acts as a buffer. When the Federal Reserve raised Interest Rates in 2022-2023, the bonds with higher convexity were able to withstand damage from the rising Interest Rates much better than the duration indicated that they should. The curve was protective in that, as interest rates rose more quickly, prices for the bonds with a high level of convexity declined at a slower pace.
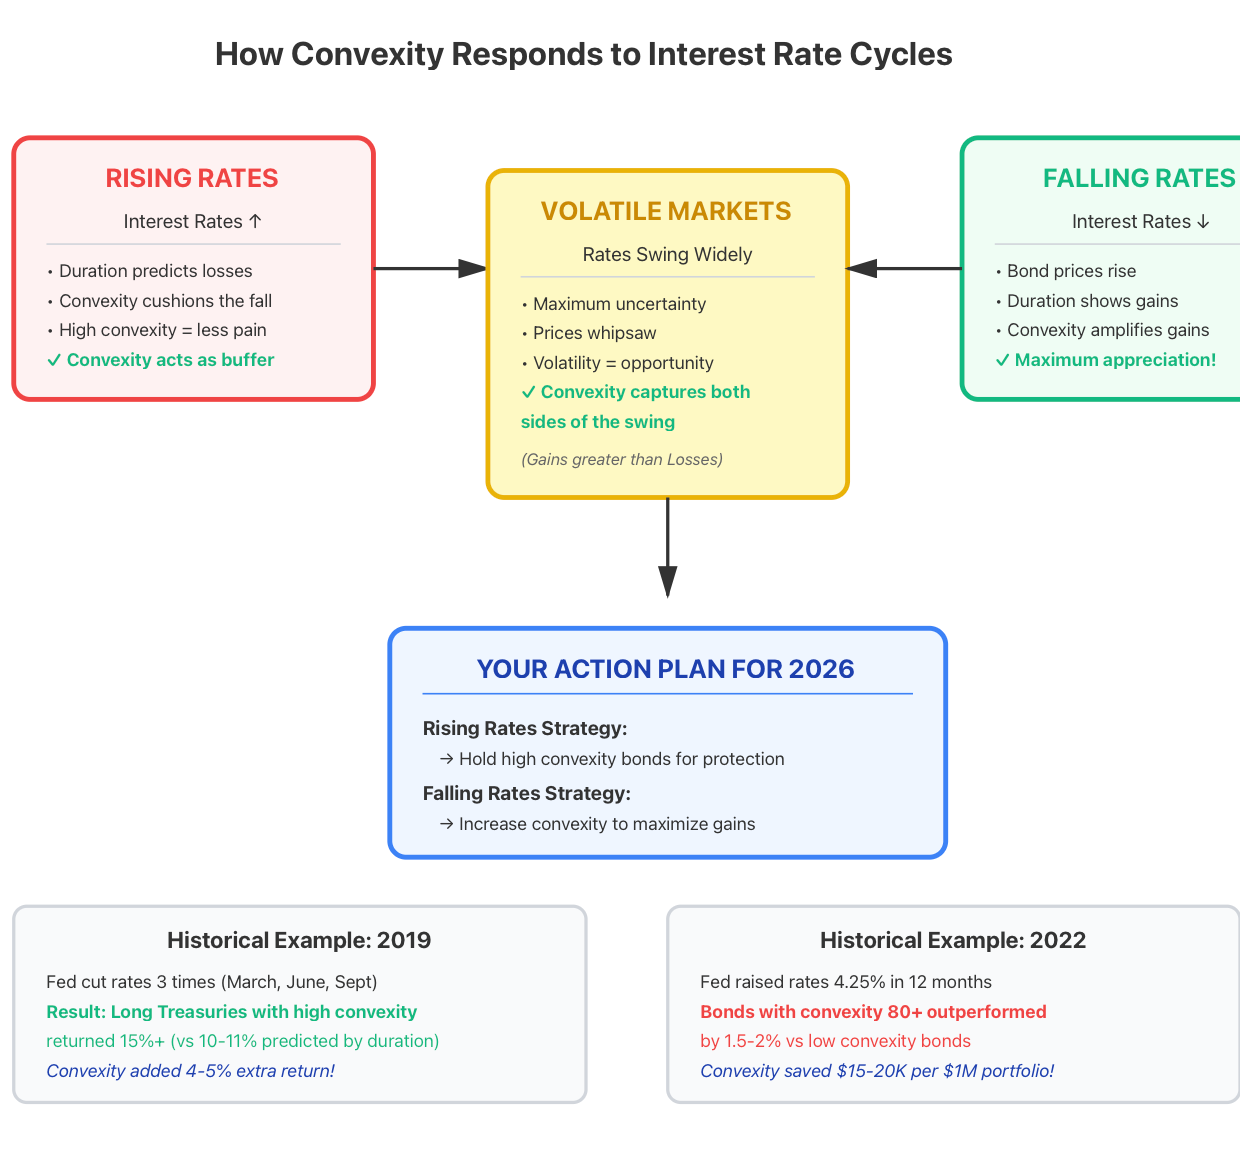
Bond convexity creates "shock absorbance". Think of how the suspension system of an automobile helps it to drive over the bumps in the road. An automobile with a good suspension system (high convexity) can handle the bumps in the road much better than an automobile without a good suspension system. The first bump hurts; subsequent bumps hurt less.
During the period from 2005 through 2007, when the European Central Bank was raising interest rates, Euro-denominated government bonds with high convexity outperformed lower convexity Euro-denominated government bonds by two to three per cent during the interest rate increase from two per cent to four and one-quarter per cent. All of the math worked in the high convexity bonds' favour.
Falling Rate Environments: This is where the true benefits of having positive convexity are realised. In a falling interest rate environment, positively convex bonds will capture increased price appreciation. A rate decrease of one per cent could yield an 8% total return for the first one per cent decrease; the second one per cent decrease could yield 10% total return.
For example, at the end of 2019, when the Federal Reserve refunded the general economy and began to cut rates three times (March, June, and September), long-duration Treasuries with high convexity returned in excess of 15%. Convexity stands to increase price appreciation beyond that which could be obtained through duration alone.
Volatile Environments: During prolonged periods of volatility and uncertainty, convexity becomes a necessity. In volatile periods when interest rates start and stop, the positive convexity enables you to capture larger price increases on the downside than you lose on the upside. You gain throughout the cycle.
As an example, think of yourself playing on a swing at a playground. If you push it gently (low volatility), you are only slightly in motion; if you push it harder, the swing will reach a much higher point with each swing.
A perfect example is the 2011 to early 2012 period during which rates on the 10-year U.S. Treasury bounced between 1.50% and 2.50% as the European fixed income markets ebbed and flowed. Bonds with convexity greater than 90 generated positive returns despite the rate ending where it began; the lower convexity bonds broke even or lost money.
For beginners, think of it this way. When you are on a bumpy road, duration is your car's weight and size. Convexity is your suspension system. While both are important, without a good suspension system, the bumps in the road will hurt much more than they should.
Key Takeaway: Convexity is not just about being able to predict where Interest Rates are going, but to survive (and perhaps profit from the volatility during the uncertain economic environment, e.g., 2026).
2026 Bond Market Outlook: How Convexity Shields Treasury Investments
As we advance into 2026, the uncertainty surrounding bonds continues to grow. Moving forward, Inflation has not moved below 2%. The Fed has no clear direction on how to reduce inflation. There could be some sort of geopolitical tension that will increase rates overnight. We are seeing now just how hard it can be to hold a bond given that scenario.
A great example of when convexity will be critical in your decisions is regarding a 10-year Treasury bond with about a 4.3% yield and approximately 8.5 years of duration with an approximate convexity of 85. In fact, here's how it looks in some examples for 2026.
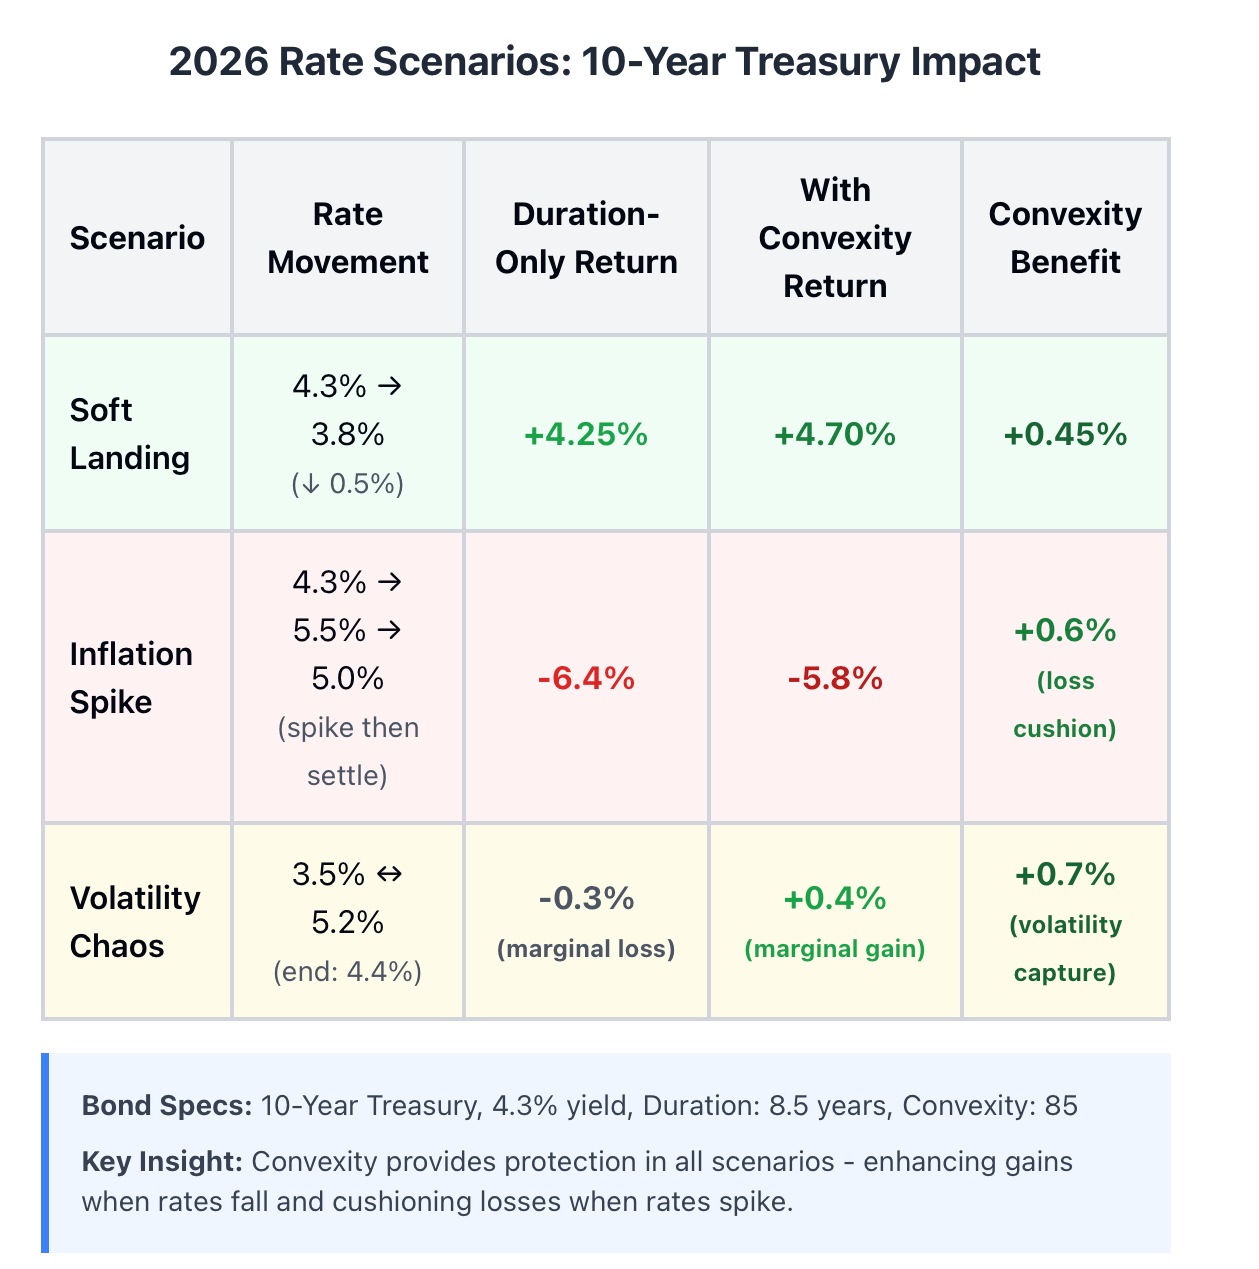
Scenario 1 - Soft Landing: Soft landing and rates drift down to approximately 3.8%: The duration for this scenario indicates an approximate gain of about 4.25%; however, when you take the convexity component into account, the actual return would be approximately 4.7%. The curve enhancement provided 45 basis points on this scenario.
Scenario 2 - Inflation Spike: Inflation spike, an approximate jump from 5.5% before settling at 5%: Duration for this scenario indicates an approximate loss of 10.2%, followed by an approximate gain of 4.25%. This would result in an estimated net loss of 6.4%; however, including the convexity component results in an estimated net loss of -5.8%. Convexity provides support to cushion the drop's magnitude as well as continue to amplify the recovery.
Scenario 3 - Volatility Chaos: Volatility Chaos would include a huge range from as low as 3.5% in the year to 5.2%, with an approximate year-end yield of 4.4%. Although the Duration shows a marginal loss throughout the year, the convexity component demonstrates a marginal gain throughout the year. Why? Because the downward volatility provides a greater positive impact on returns than does the upward volatility negatively impacts your returns.
You should view convexity as insurance against extreme volatility, without having to pay for the option, as it's built into the bond. A great historical comparison for bonds with extraordinary convexity to lower convexity bonds is the rate spike of nearly 5% in circumstances similar to that of 2022-2023; Treasuries with at least an 80% convexity outperformed all other types of bonds by between 1.5-2% on average. This may not sound significant until you consider when it's applied to a $1 million portfolio, where the difference amounts to $15,000-$20,000 in avoided loss.
For those of you unfamiliar with the shock absorber analogy to explain Convexity, think about driving an automobile across a bumpy road or other off-road terrain. If you were to use duration to gauge the size of the bumps, you would use Convexity to measure the quality of your vehicle's shock absorbers, and without quality shocks, you would be thrown all over the place by every bump on the road, whereas with a quality set of shocks, you could drive steadily through rough terrain.
If you expect to face uncertainty and volatility for the remainder of 2026, you will need to increase your exposure to convexity. Because of this uncertainty, investors are now increasing their Treasury convexity exposure and increasing their exposure to 10-year and longer Treasury bonds; even if that means they must accept increased duration risk, many investors are willing to do so when volatility is a greater concern than direction.
Key Takeaway: Investors in today's uncertain environment in 2026 cannot afford to overlook the importance of having adequate convexity to effectively hedge against extreme rate fluctuations as a result of market volatility.
Trader's Secret Weapon: Profiting from Positive Convexity in Volatile Markets
Positive convexity is not simply used defensively by professional traders; they are also opportunistic traders who take advantage of positive convexity in the market for profit.
The Setup: A trader can find a bond or bond futures contract trading at a low price with high positive convexity. Bonds such as long-term Treasuries from 20 to 30 years can have a high level of positive convexity (greater than 150), which will amplify the price movement of the bond significantly.
The Trade: When volatility of the interest rate occurs (such as Fed meetings, inflation reports, and geopolitical events), the positive convexity in the bond will often increase the returns that one would expect from holding the bond only based on its duration. Instead of receiving an 18% return when the rate drops 2%, a trader could receive 20-25% in actual returns. The additional 2-7% in returns will be a result of the positive convexity of the bond.
Here's a professional example from 2023: Let's look at the case of the 30-year Treasury on the day before the start of the bank crisis and the pivot by the Fed in March 2023. During that time, a trader who had purchased 30-year Treasury bonds with high positive convexity before the crisis experienced the yields on those bonds drop from approximately 3.9% to approximately 3.5% within a matter of weeks. The duration of the bond would have predicted returns of approximately 8%, while the actual return during that time was approximately 11%. The additional return of 3% would be due to the positive convexity of the bond.
This situation is comparable to a compressed spring. When a spring is compressed, as interest rates move up sharply, and subsequently released, interest rates move downward from their compressed state. The spring does not return to its original length, but rather bounces higher than it was originally compressed. This excess return will be the profit obtained by the trader.
Risk Management Matters:
Although there is the potential for an excess return from trading positive convexity, it is important to keep in mind that trading positive convexity is not without risk. If interest rates trend steadily in one direction without reversal, the trader may find that his returns on his investments are less than he would have obtained had he simply held a long-duration Treasury with a similar duration.
The reason is that the trader must have the same amount of volatility (not just movement) to make the most of his investments. The use of stop-loss strategies is essential to ensure that a trader will be able to sustain a profitable position on any given trade. A trader should use tight stop-limits (3-5% losses) when trading with leverage (such as bond CFDs). Although the profit potential is available from positive convexity, the leverage will create additional risk that a trader should be prepared for.
Position sizing must be correct as well. A trader should limit his allocation of active positive convexity trades to 10-15% of his entire portfolio. The remaining portion of the portfolio should be composed of diverse, balanced holdings.
Practical Implementation: Most retail investors can access long-term Treasury ETFs (such as TLT and GOVT) or bond CFDs on platforms such as TradeWill in order to partake in positive convexity trading. Trading using bond CFDs can have the added benefit of allowing a trader to use leverage, which will allow a trader to magnify both gains and losses, so it is best to start with a small position and then gradually increase the position size as the trader's experience grows.
Key Takeaway: Timing is the key factor with this type of trading. Buying permits entry into a position before the volatility increase becomes imminent, and selling after the interest rate fluctuations produce profit. These trades should be considered tactical and should not be converted into long-term buy-and-hold strategies.
Positive convexity is an effective strategy for generating improved returns during periods of high volatility if used properly, with discipline and the appropriate market characteristics.
Bond Portfolio Optimisation: Leveraging Convexity for Risk Management
Creating a Secure Bond Portfolio requires Coordinated Management of Bond Duration and Bond Convexity.
First, identify your target for duration; 7 years will mean sensitivity of approximately 7% for every 1% change in interest rates. You will use this duration target as a base to optimise your bonds by varying convexity.
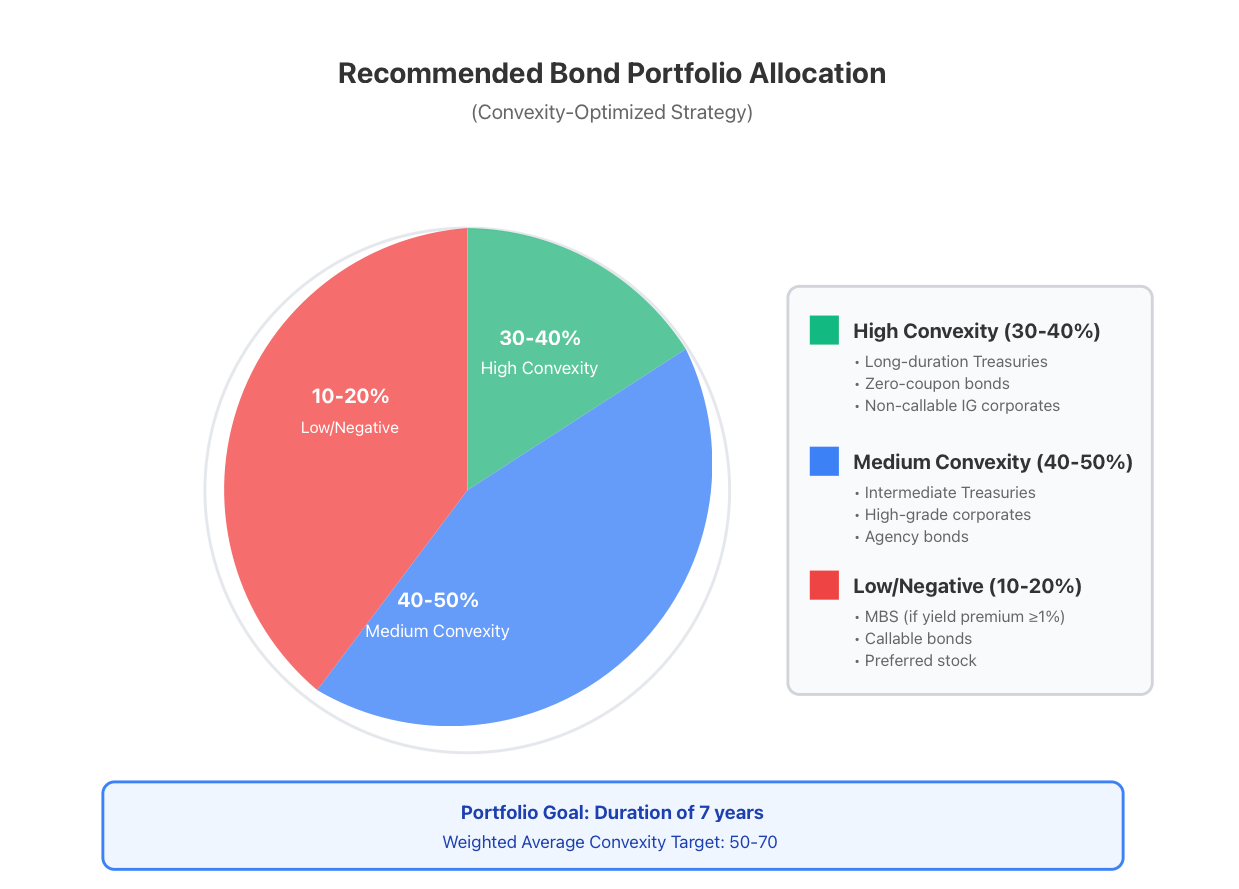
Allocate a Large Convexity Portfolio (30-40%): To achieve the maximum benefit from convexity, all bonds should be: Long Duration Treasuries; Zero Coupon Bonds; Non-Callable Investment-Grade Corporates. When interest rates change, these bonds will reduce the impact of the rate movement on your overall Bond Portfolio.
Allocate a Medium Convexity Portfolio (40-50%): To take advantage of some convexity and good yield, include: Intermediate Duration Treasuries; High Grade Corporates; Agency Bonds.
Allocate a Low/Negative Convexity Portfolio (10-20% max): Include only if the yield premium is significant (1% or greater over comparable duration Treasuries), and you can accept the risks associated with these types of bonds: Mortgage-Backed Securities (MBS); Callable Bonds; Preferred Stock.
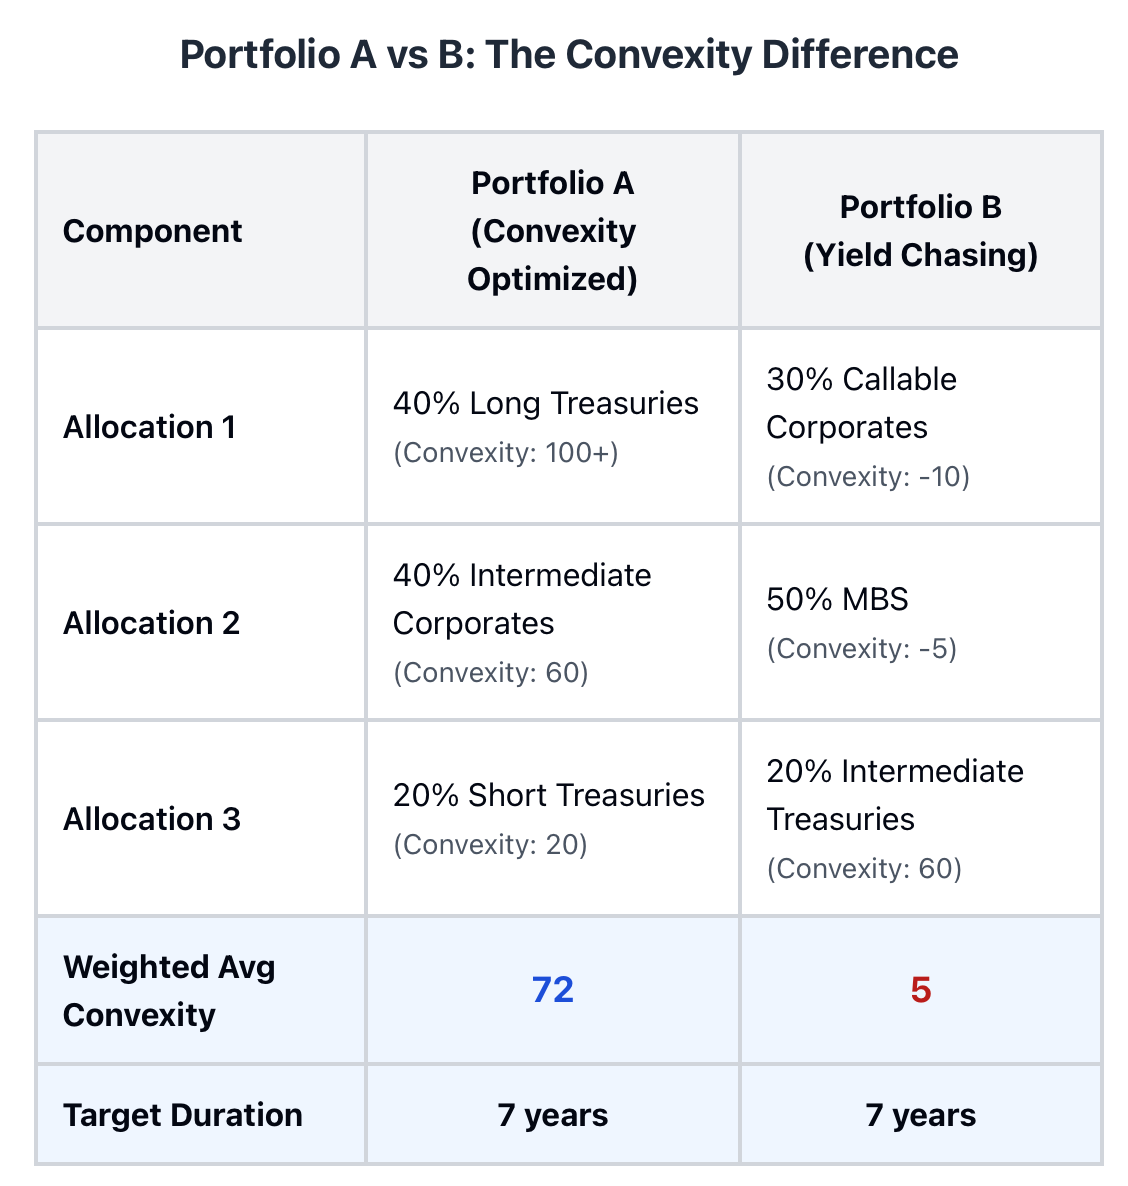
Let's simulate two portfolios, both with a duration of 7:
Portfolio A - Convexity Optimised:
-
40% long Treasuries (convexity 100+)
-
40% intermediate corporates (convexity 60)
-
20% short Treasuries (convexity 20)
-
Weighted average convexity: 72
Portfolio B - Yield Chasing:
-
30% callable corporates (convexity -10)
-
50% MBS (convexity -5)
-
20% intermediate Treasuries (convexity 60)
-
Weighted average convexity: 5
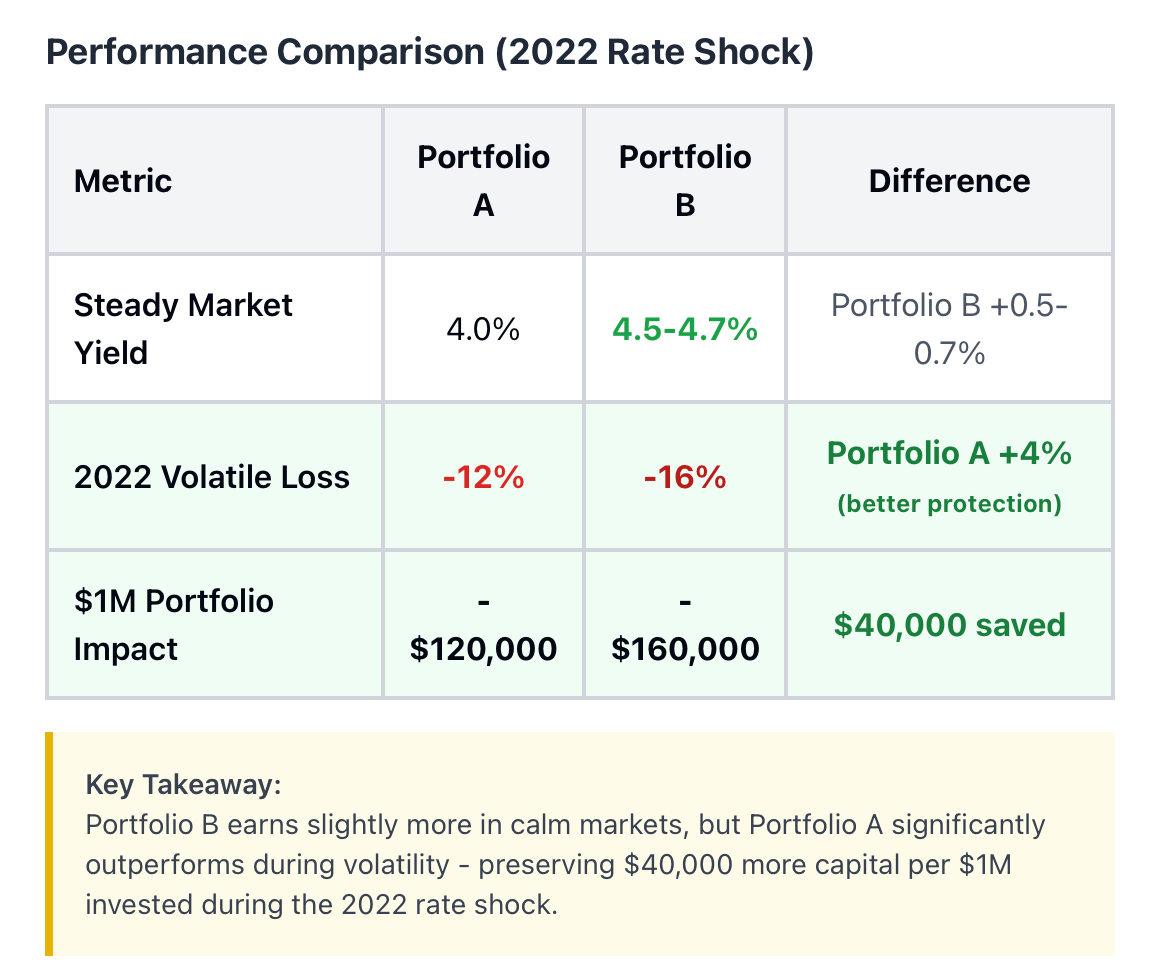
In steady markets, Portfolio B could lose 0.5-0.7% more per annum. However, when the 2022 rates went up and down, Portfolio A suffered just a 12% loss while Portfolio B was tasked with a penalty of 16%. Very significant capital preservation difference!
Just like a basket containing eggs! Duration tells you the number of eggs you have to carry. Convexity tells you how solid your basket is. An unsafe basket (low convexity) will drop down and break eggs easily. Hard baskets (high convexity) can withstand falls and protect eggs.
Rebalancing Strategy: Review convexity allocation quarterly. In a low-volatility environment where one may conduct yield chase, acceptance of lower convexity is feasible. A move into higher convexity may take place when uncertainty has risen (similar to 2026) at a sacrifice to yield.
This was supported by historical data. A portfolio with an average convexity exceeding 50 over the 2010-2023 studied periods has outperformed portfolios with lower convexity by an annual 0.8-1.2% on a risk-adjusted basis. The excess returns are achieved from improved handling of interest rate volatility.
Key Takeaway: Duration and convexity together create a truly optimised portfolio. Duration controls the core risk, and convexity handles the exposure to the volatility. Master these together to construct resilient fixed-income allocations.
Top Bond Convexity Misconceptions Every Investor Should Avoid
Convexity is a very misunderstood term in finance. Let us clarify the following four major beliefs that many investors hold regarding convexity.
Misconception 1: Longer Duration Always Means More Risk
Many investors believe that duration is the only metric for risk. Investors tend to stay away from longer bonds and classify them as automatically being of a higher risk than shorter bonds. This is false.
A 30-year U.S. Treasury bill (T-Bill) is likely to experience much less risk due to a higher amount of convexity that it has relative to a 7-Year MBS (Mortgage Backed Security), which possesses Negative Convexity. This occurs because the 30-Year T-Bill benefits from volatility in interest rates, but a 7-Year MBS would generally experience a significant decline in value as interest rates fluctuate.
In 2020, for instance, 30-Year T-Bills produced an 18% return, despite having a higher duration and therefore appearing to be a riskier bond, whereas many 7-Year MBS had only returned close to break even or losses of between 4 and 6 per cent, making convexity the primary driver of the difference.
Misconception 2: Higher Convexity Is Always Better
Not necessarily true. Very high levels of convexity may also be associated with a very long period of duration for which it applies. A Zero-Coupon bond with 50 years of maturity and therefore a significant amount of convexity, but also has an extreme amount of interest rate sensitivity.
In an environment of rising interest rates, such as the current rate increase in Q2 2023, the 50-Year Zero-Coupon bond with significant convexity offers no protection from a large loss in value associated with rising interest rates due to the fact that it is priced very high relative to current interest rates.
Higher Convexity will come with a yield reduction. When comparing two bonds with the same credit quality and issuer, the bond that possesses more convexity will generally have a lower yield than the bond with less convexity. Therefore, an investor is implicitly paying for that additional protection through a lower yield. In instances where the cost of protection is too high relative to the likelihood of an event occurring, this protection may not be worth the higher yield. Therefore, it is prudent to use an investor's view of the market's future volatility to determine the proper amount of convexity to attach to a particular investment.
Misconception 3: Convexity Alone Predicts Returns
Convexity is not a return indicator; rather, it is simply one measure of the sensitivity of an investment to changes in interest rates. For example, one would not expect a bond with a Convexity of 100 to automatically outperform a bond with a Convexity of 50. Instead, it will simply respond to interest rate changes differently than a bond that has a Convexity of 50.
In order to determine the return potential, it is necessary to assess the historical movement of interest rates relative to the market's future expectations of the potential movement of interest rates.
For instance, if interest rates continue to remain flat, an investor would likely experience minimal appreciation due to a bond's High Convexity. Conversely, if interest rates had increased significantly during the same period of time, an investor would have benefited from purchasing an investment with High Convexity.
To think of Convexity as an analogy to purchasing an automobile insurance policy, a High Convexity bond protects against potentially damaging events, i.e., the volatility of interest rates and would therefore cost more than a bond that has a lower level of convexity (lower yield). In instances where an investor has never experienced a vehicle collision, they may view the monthly premium for their automobile insurance policy as being wasted; however, when they have experienced a vehicle collision, they may feel blessed that they purchased the automobile insurance policy.
Misconception 4: Negative Convexity Is Always Bad
This is also a false belief. Together, Negative Convexity on a security will limit the potential upside on that particular investment; however, there are instances where investors are compensated for holding a security with Negative Convexity by the associated higher yields. In instances where interest rates remain stable during the investment period, a bond with Negative Convexity may outperform positively convex alternatives.
The most important aspect of investing in securities with Negative Convexity is that an investor should have a clear understanding of the potential for risk and reward before making any investment decisions. In instances where an investor has no current knowledge of their existing investments and/or interest rate environment, they may have held a bond that represents the downside potential of Negative Convexity, and the associated yield premium is significantly less than the associated potential for loss. In contrast, it would be considered acceptable for an investor to invest in a bond with Negative Convexity, provided that they understand the risks/rewards involved and the potential risks associated with a stable range-bound interest rate environment.
To illustrate, consider the following comparison: The risk of losing money due to inflation will have been less for an investor who purchased a 4% Savings account than for one who purchased a 4.2% T-Bill with Positive Convexity and purchased a 5% callable bond with Negative Convexity. In instances where interest rates are stable, the investor who purchased the Callable bond would have outperformed both the Savings Account and T-Bill. Conversely, an investor who had purchased a T-Bill would have outperformed the Callable Bond in an interest rate-volatile environment.
In conclusion, it is important to recognise that Convexity can be a very strong investment tool; however, it should not be viewed as the "magic bullet," but should rather be utilised in conjunction with a broader strategy of risk management.
Conclusion: Master Bond Convexity to Secure Your 2026 Investments
The benefit an investor receives from potential volatility can be measured by bond convexity. With the uncertainty surrounding interest rates in 2026, investors must know the bond curve to determine how to profit from market volatility. The key takeaway of the bond curve is that bonds with positive convexity will provide greater profits while mitigating potential losses. Bonds with negative convexity will limit a trader's profits just as they need to see larger returns. The duration of a bond tells the investor only the minimum information about the bond but bond convexity will illustrate how the bond should react when the market becomes volatile.
Investors with long-term treasury bonds and/or those trading bond CFDs for the purpose of profiting from volatility can take advantage of the benefits of convexity when they trade. Convexity illustrates that, rather than just a hope to profit from interest rate changes, by using convexity, investors will be able to guarantee profits based on these changes.
If you are interested in putting this knowledge into practice today with TradeWill, you can learn how TradeWill's advanced bond trading and CFDs allow users to profit and protect against fluctuations in interest rates through the use of convexity. Start building your risk-free bond portfolio for 2026 today!
Disclaimer: The content of the blog does not represent any position of Trade W, does not serve as any trading-related decision advice, and does not endorse any third-party.