

 Trade W

Introduction: Unlocking the Power of Bullish Divergence
Have you ever seen a stock drop to a new low and thought to yourself, is it going to bounce? This is known as bullish divergence.
Bullish divergence occurs when a stock or index is lower in price, but the technical indicator (such as RSI or MACD) does not corroborate that new low and shows the indicator made a higher low, meaning selling pressure is decreasing. Think about it like the market is telling you, "Hey, this down may be running out of steam."
Why is this important? Because if you can spot bullish divergence early, then you will be able to take advantage and begin buying before the rest of the market catches on. It is one of those rare signals that gives traders a small indication that the price may be preparing to reverse.
The beauty of this pattern is that it is equally applied to any market. Whether you are looking at Apple stock or the S&P 500, they are all the same principles. Stock traders apply this to time their entries on individual stocks, and index traders apply this to measure the overall market sentiment. For instance, a bullish divergence on the S&P 500 would infer that a market wide correction could be finishing.
For decades professional investors utilized this technique to identify bottoms in top tier stocks. In late 2018, when Apple dropped in price, its RSI made higher lows which illustrated price and momentum diverging. Experienced traders saw the divergence and began taking positions long before the stock moved higher. The same sequence happened during the COVID crash with the S&P 500 in March 2020, as divergences appeared just before one of the most powerful bull runs in history.
The important thing to understand is that bullish divergence is not a magic 8-ball. It is not a clear signal that the price will go up. Bullish divergence is an indication that momentum is changing. The price might go lower a little further, but selling pressure is subsiding. Smart traders begin to utilize the information from the divergence to begin establishing positions themselves or at least put the stock on their watchlists.
Ready to learn how to spot divergences for yourself? Let's dive into the mechanics of how price action and indicators can work together to reveal these hidden gems.
Core Concepts: How Price and Indicators Reveal Reversal Signals
Fundamentally, bullish divergence is about disparity between what you see and what is actually happening beneath the surface.
Here’s the setup: a stock makes a new low, falling below its prior low. You would assume the technical indicators would confirm this weakness by also making a new low. But they don’t. The RSI, MACD or Stochastic Oscillator instead makes a higher low. This discrepancy indicates selling momentum is actually diminishing, even with the lower price.
Now let’s dive into the main indicators traders use to recognize divergence.
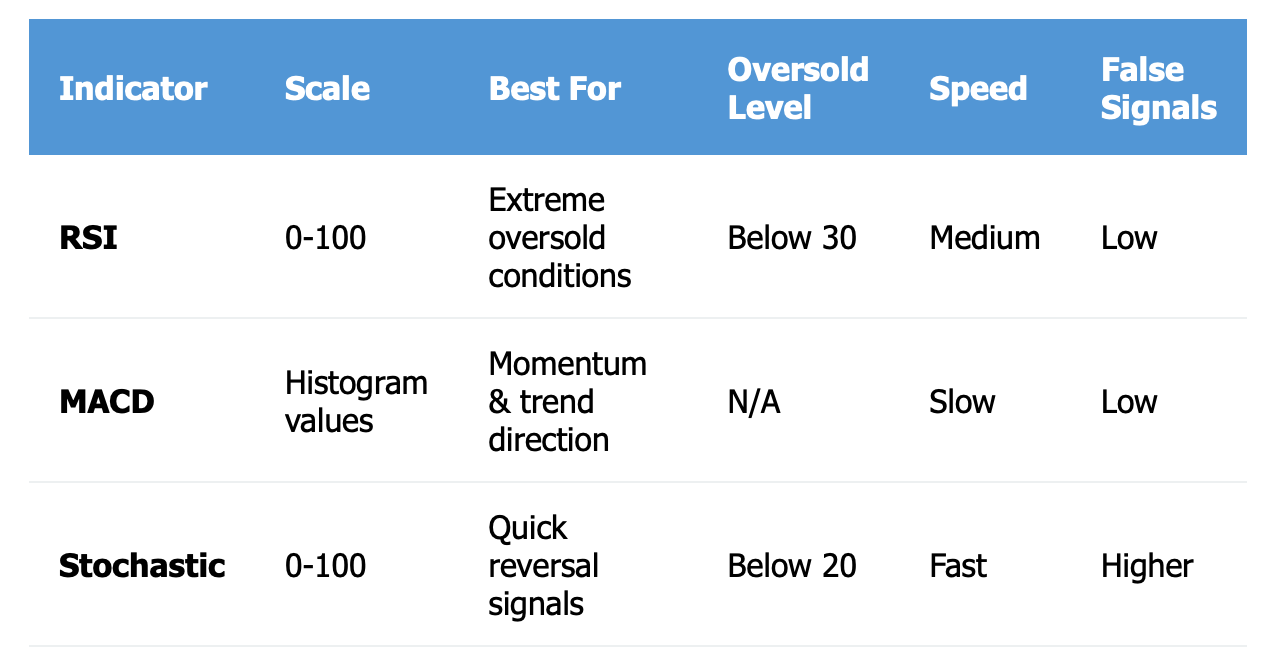
RSI (Relative Strength Index) measures momentum on a scale from 0 to 100. When price makes a new low RSI is greater than its prior low, that is your divergence setup. RSI can be particularly effective because it indicates oversold conditions (below 30), making divergence patterns easy to see.
MACD (Moving Average Convergence Divergence) is a measurement of the relationship between two moving averages. When price makes a lower low but the MACD histogram or signal line make a higher low, the divergence setup occurs. Many traders prefer this indicator since it displays both momentum and trend direction.
The Stochastic Oscillator assesses a specific stock's closing price relative to its price range over a certain period. Like the RSI, it operates on a 0-100 scale. Bullish divergence occurs when the price makes a new low, and the Stochastic bounces higher than the previous low.
This is an important consideration: divergence signals a possible reversal but not a guaranteed reversal. The pattern suggests a change in momentum, but forward price action may draw prices lower for some time before a reversal actually occurs, and this is important to think about because signals of confirmation are so critical.
For example, look at the S&P 500 in December 2018. The index fell significantly and after making a lower low on December 24, things started to turn. The RSI, although it was oscillating below 31 and had made a lower low on the December 24, started to make a higher low on the daily chart, which means downward momentum was deteriorating, even though the price action hadn't.
A couple weeks later, the S&P started a more than year long rally. Traders that spotted that RSI divergence received the earliest possible warning that the sell off was exhausting itself.
Another example look to Apple's price action in early 2019. The stock was getting hammered in late 2018 and was on a noticeable downtrend. In January, the MACD was putting in higher lows even while the price was still having trouble. That bullish divergence ultimately ripped from about $142 to over $200 by year end.
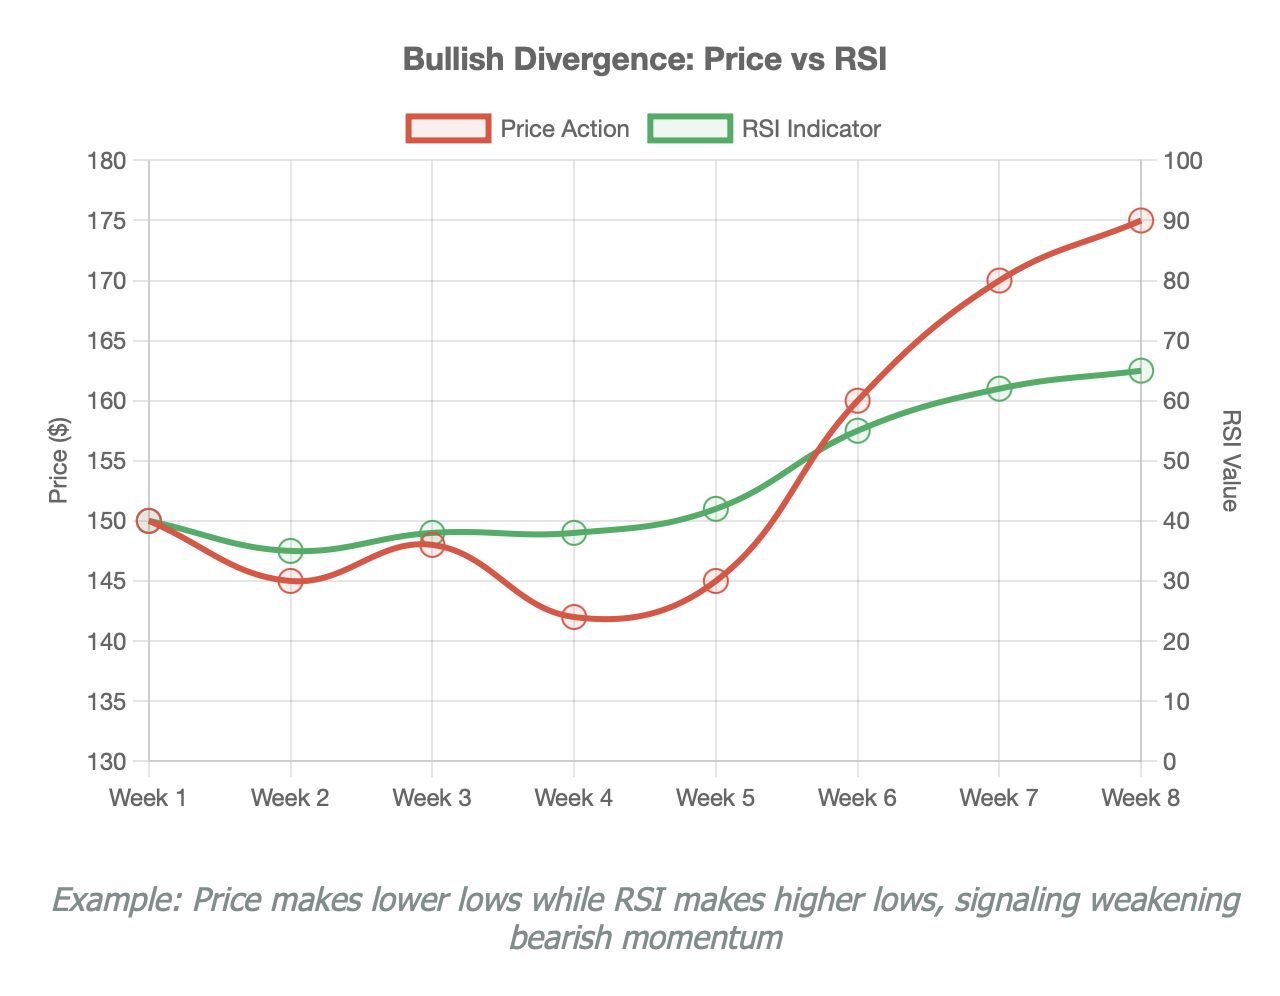
The connection between price and indicators reflects market sentiment. If price is making new lows but the indicator is not, the sellers are losing conviction. Maybe institutions are secretly accumulating shares. Maybe short sellers are starting to cover. Whatever the case, the bearish momentum is unraveling.
Indicators have varying degrees of effectiveness. RSI is best at demonstrating extreme oversold situations. MACD gives more context about trends. Stochastic gives faster signals, but allows for more false positives. Most seasoned traders don't focus on just one. They look for divergence on multiple indicators for stronger confirmation.
Seeing the relationship transforms how you view the chart. You are no longer just looking at price. You are now looking at the conversation between price action and momentum, and you can get a sense for the subtle shifts that may precede larger moves.
Types and Identification: Spot the Best Entry Points
Not all bullish divergences are the same. Knowing the difference between a standard divergence and a hidden divergence may make the difference between catching a reversal and getting stuck in a stronger downtrend.
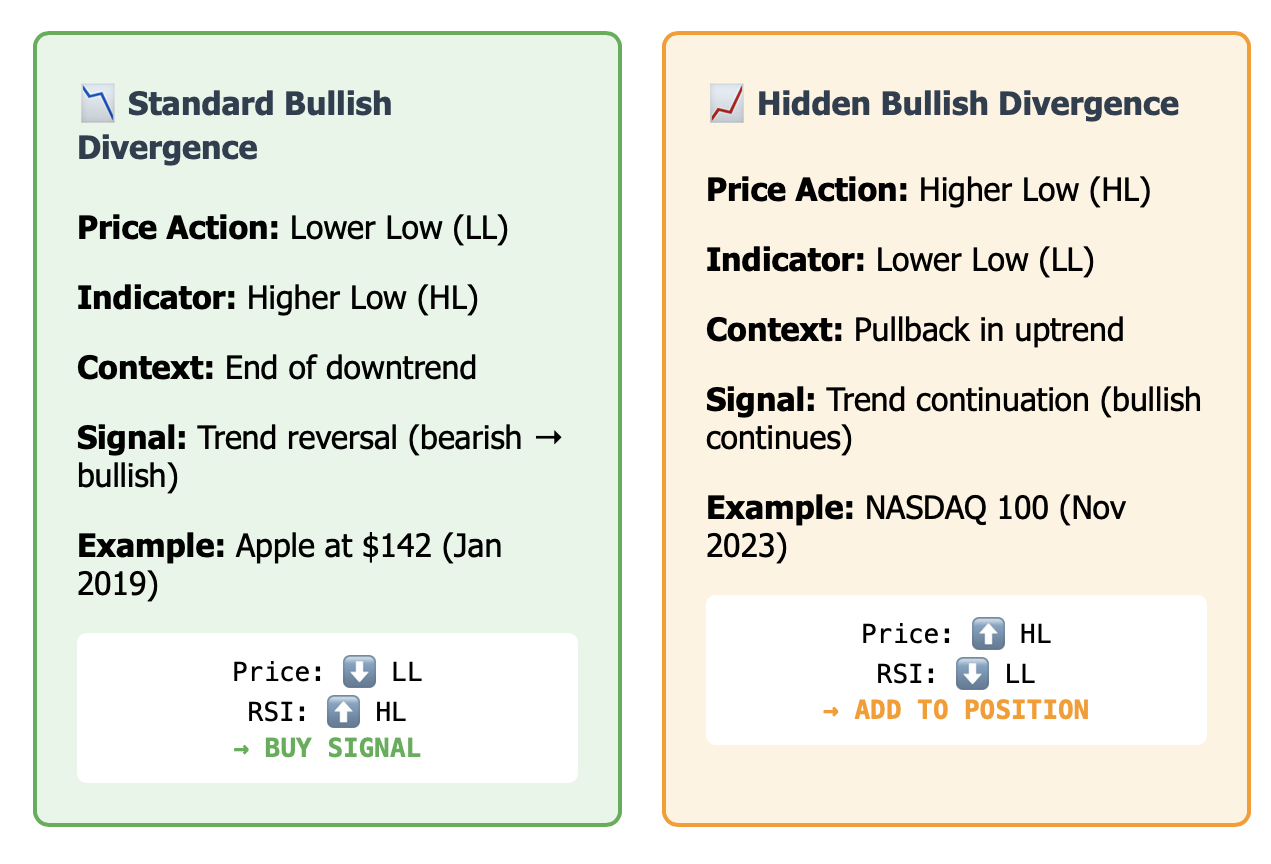
Standard Bullish Divergence is the classic pattern and usually the first one most traders learn. The price of the instrument makes a lower low, but your indicator (RSI, MACD, etc) makes a higher low. This divergence usually occurs at the very end of the downtrend and is indicative of a bullish trend reversal. Put simply, the market is giving you a signal that the downtrend is losing momentum.
Hidden Bullish Divergence is more subtle, but equally, if not more powerful. Price here makes a higher low (already showing strength), but your indicator makes a lower low. The divergence typically occurs while the market is trending up and occurs in the midst of a pullback that often leads to the continuation of the bullish trend. Basically, price action is confirming that the dip is a buying opportunity.
The distinction is important because they tell different stories. Standard divergence can help you catch reversals near the bottom, while hidden divergence can help add to winning positions during healthy corrections.
Identifying these patterns in real charts takes practice. Here's how to do it systematically:
Step 1: Identify the Price Lows
Place a marker on your chart where the price made recent significant lows. Don’t sweat the small intraday wicks. Mark the “swing lows” where price paused and built a bottom prior to bouncing.
Step 2: Examine Your Indicator
Now, observe the same time period on the indicator of your choice. Did prices make the same low, moving in tandem with the divergence in price, or is there a divergence?
Step 3: Check Multiple Timeframes
This is where the novice and pro traders part ways. A divergence has occurred on a 1-hour timeframe- neat. The same divergence occurring on both 1-hour and daily timeframes? That is much more reliable. Before acting on a divergence signal, review at least two timeframes.
Step 4: Consider Volume
A strong divergence will often be accompanied by lower volume on the price drops. If volume expands as price makes new lows, be wary. True capitulation will accompany high volume and will trump divergence signals in the short term.
Let's take a look at a practical example using the SPY ETF (the fund that tracks the S&P 500). In October 2023, SPY made a lower low right around $420, falling from its recent low at $425. The interesting part of this is that while SPY was making a lower low, the RSI made a higher low. Even better, this hidden divergence occurred while the 50-day moving average was still sloping upward, confirming the uptrend was still valid. The traders who recognized this divergence had an opportunity to enter very cheap for the subsequent rally to above $460+.
If we look at an individual stock, Apple is a textbook case from August 2024. The stock dipped below $209, making a lower low from the previous low of $215. The MACD histogram still had negative values but formed a higher low at the same time. This standard bullish divergence occurred before a rally that took Apple back above $230 within weeks.
The NASDAQ 100 shows evidence of beautiful hidden divergence in November 2023. After a strong rally, the index pulled back and made a higher low. And even as that occurred, the Stochastic Oscillator made a lower low. This hidden divergence then confirmed that the correction was simply healthy pause in the uptrend. Shortly thereafter, the index resumed its climb.
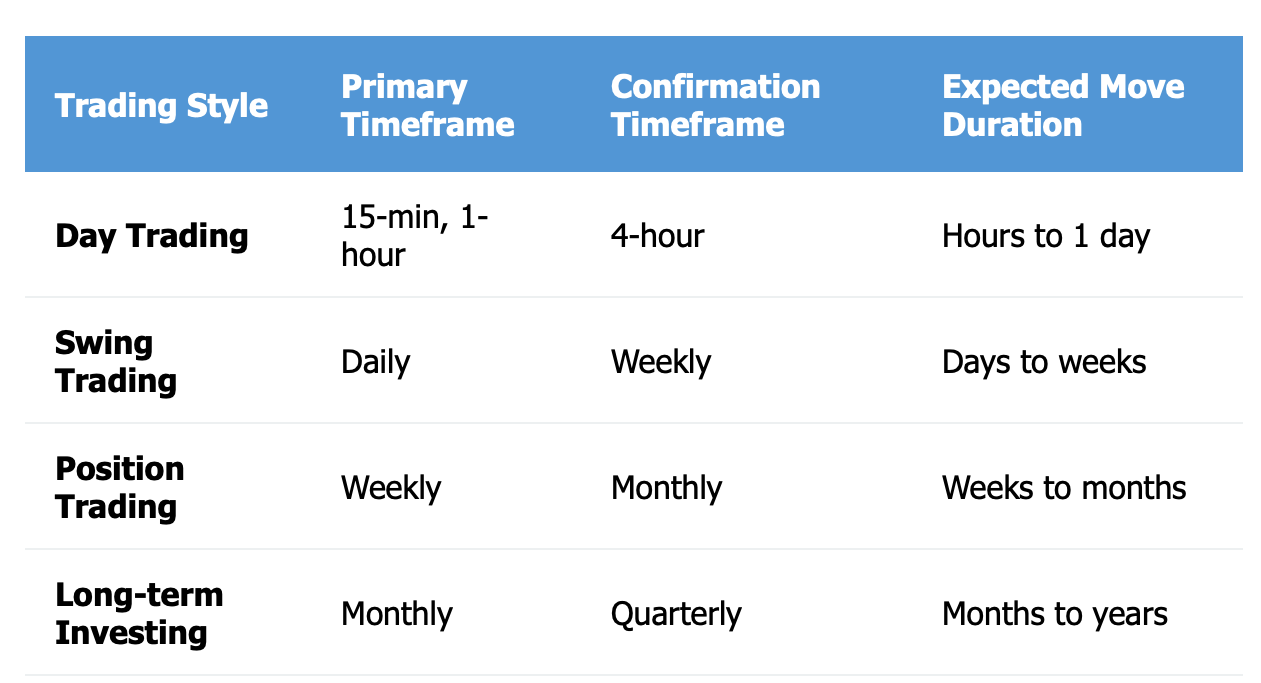
One important thing to keep in mind is the timeframe. A divergence on a 15-minute chart may produce a bounce that looks good for an hour. A divergence on the weekly chart will signify a multi-month bull/bear trend change. Match your timeframe to your trading type. Day traders use the hourly charts, swing traders use daily charts, and position traders use weekly/monthly charts.
False signals usually happen when traders ignore context. A bullish divergence in the face of a strong downtrend with heavy selling volume may only result in a bounce for a short time before continuing the decline. Always be aware of the larger context. Is the stock in a long-term downtrend a correction in an uptrend? That context changes everything.
The ability to quickly know the type of divergence and then correlate that signal across timeframes is what separates consistent traders from those who get whipsawed by any and all small signals. Take your time and wait for confirmation; and remember, the best divergences are the ones that show to you through many different indicators and on multiple timeframes.
Applying Bullish Divergence in Trading Strategies
Recognizing divergence is important, but applying divergence and placing profitable trades from it is much more challenging.
Most successful traders do not place trades based on divergences alone - they use it as part of a larger trading plan, which incorporates exit and entry plans, risk management, and much more.
First, Risk Management
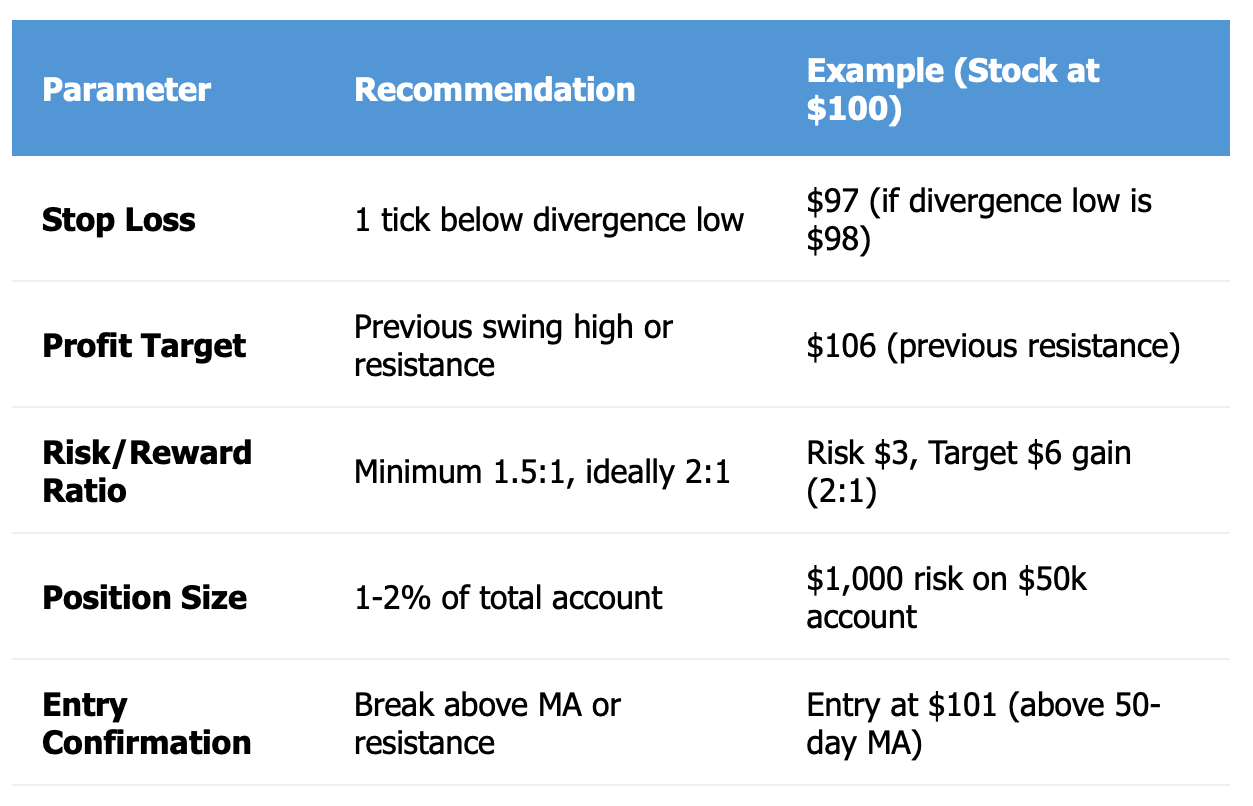
Before you think of your entry, decide on your risk before entering a trade. A good default is one tick below the intraday low of the divergence. If price makes a lower low below the divergence signal you must exit the trade, as that signals the trade set-up has failed. A good profit target is typically the previous swing high or a major resistance level. A good rule of thumb is to target at least a 2 to 1 reward to risk. So for example, if you are risking $1.00 a share - you would want to target at least a $2.00 potential gain.
Combine with Supported and Resistance
When divergence is printed at a major support level, that makes divergence measures even more powerful. For example, if Apple trades down to $200, a level that it has traded down to twice before, and you see bullish divergence printed on the chart at this price, you now have a confirmation of a significant technical level. The same rule applies to trendlines. For example, if price is bouncing off the rising trendline and also converging you now have many reasons to believe price will bounce and move higher.
Volume Confirmation
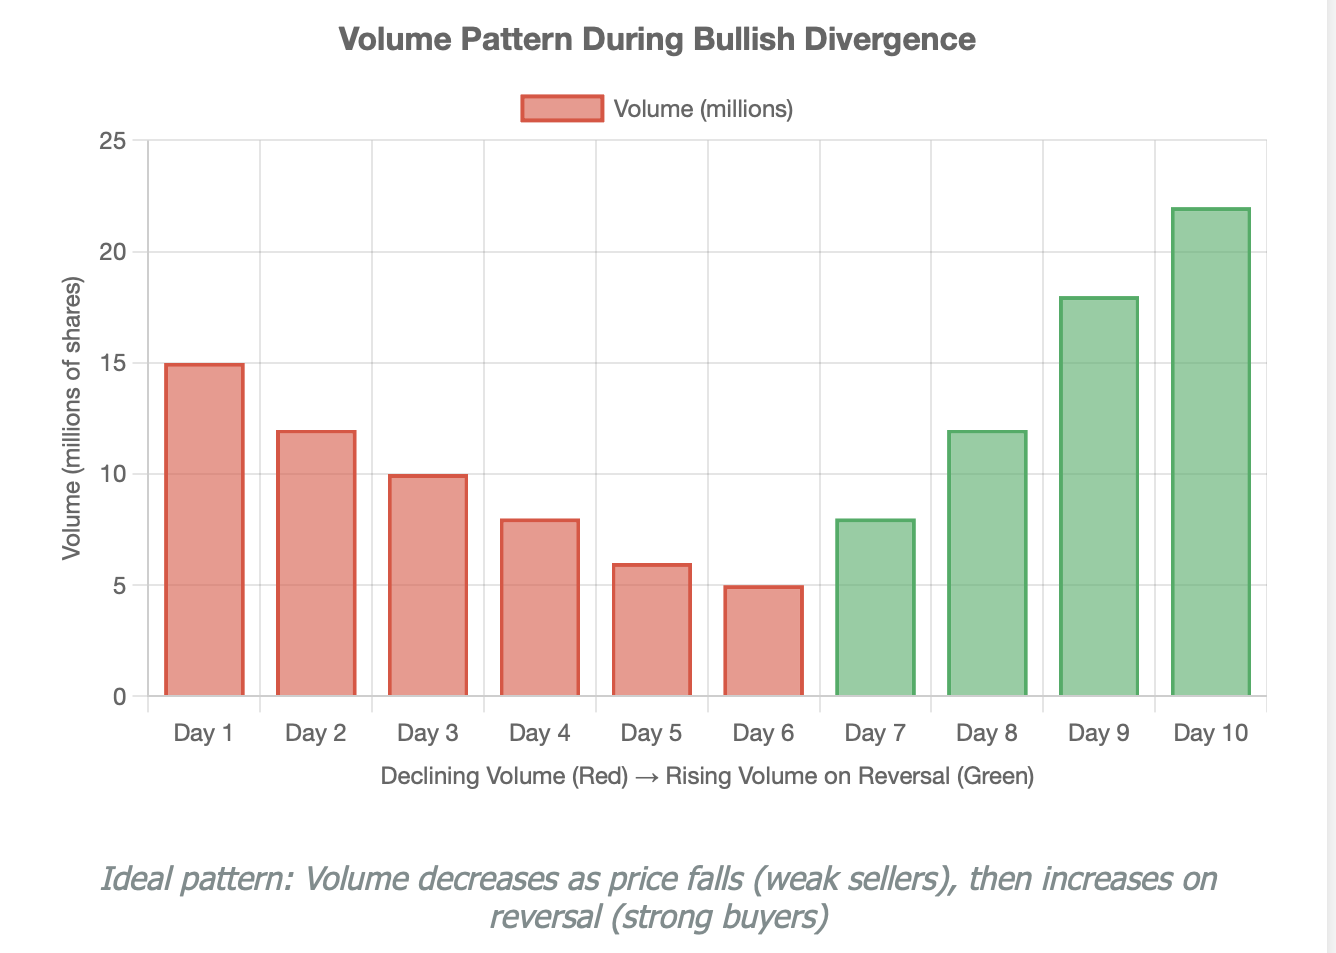
Pay attention to lessening volume as price drops to new lows. This often indicates that selling pressure is weakening. Then look for volume to increase as price goes back up. Volume increases on the bounce validates buyers are entering the market. Without the volume pattern, divergence signals aren’t confirming anything.
Moving Average Confluence
Professional traders typically wait for price to move above important moving averages before making a trade. For example, when looking for Tesla divergence, you'd see divergence at $180, but would wait for price to move up and over the 50-day MA at $185 before you would then consider buying. That assertion of the moving average breakout asks for extra confirmation that momentum had, in fact, changed.
We can go through a complete stock trade using Tesla as an example. In April of 2024, Tesla dropped down to the area of $145 which made a lower low from the previous low of $165. Although the RSI made a higher low in price, this indicated bullish divergence. Here is how a professional would trade this from the daily chart.
1. Identify the divergence on the daily chart
2. Wait for price to close above the 50-day moving average (around $155)
3. Enter a buy stop order at $156 with a stop-loss at $143 (below the divergence low)
4. Initial target - $175 (previous resistance)
If volume increased on the breakout, hold for the full target.
This was an example of coming up with a $13 risk with a $19 potential reward (1.46:1)
Then professional traders consider how the trade is playing out to adjust their positional targets.
Now let's consider someone beginning to trade Apple stock. The suggested method would be extremely simplified. If you see bullish divergence on the RSI on the daily chart that is the signal (RSI reading below 30 means oversold). Wait for RSI to get back above 30 and then enter (list your position as going long once above). Place your stop at the recent swing low, take a target of the 20-day moving average and/or the previous resistance. Again, do not take large position size until confident in your approach.
Trading indices requires slightly different thinking, because indices tend to trend more reliably than single stocks will. Let's use the S&P 500 as an example. If you are tracking bullish divergence on the daily chart then look at the weekly chart as well. If the daily chart shows bullish divergence and the weekly chart still shows price above the 50-week MA you can assume that the bullish divergence is a correction of the larger bull market and is your buy signal.
In practice, if we consider back to October 2023 there was bullish divergence on the S&P500 daily chart as it traded around 4200. The volume was decreasing as the index was selling off (indicating that the bears may have been losing interest). When the SPY broke through the level of 4250 (from the previous close) on higher volume that was entry point.
A stop-loss could have been put at the 4180 area (which corresponded with the divergence low) and a price target of 4400 (which would be target of previous resistance). The trade was great being able to pick up SPY above 4400 within three weeks.
In terms of a different approach for trading the NASDAQ 100, they act more like momentum stocks. When you see bullish divergence take a different approach of waiting for price to close above the high of the previous day with volume. Then you have confirmation that the buyers are now in control. Add your entry, stop-loss below the low of the divergence, and ride the momentum.
Creating Your Trading Checklist
You want to be careful about relying on your memory at the last minute. You’re better off creating a checklist.
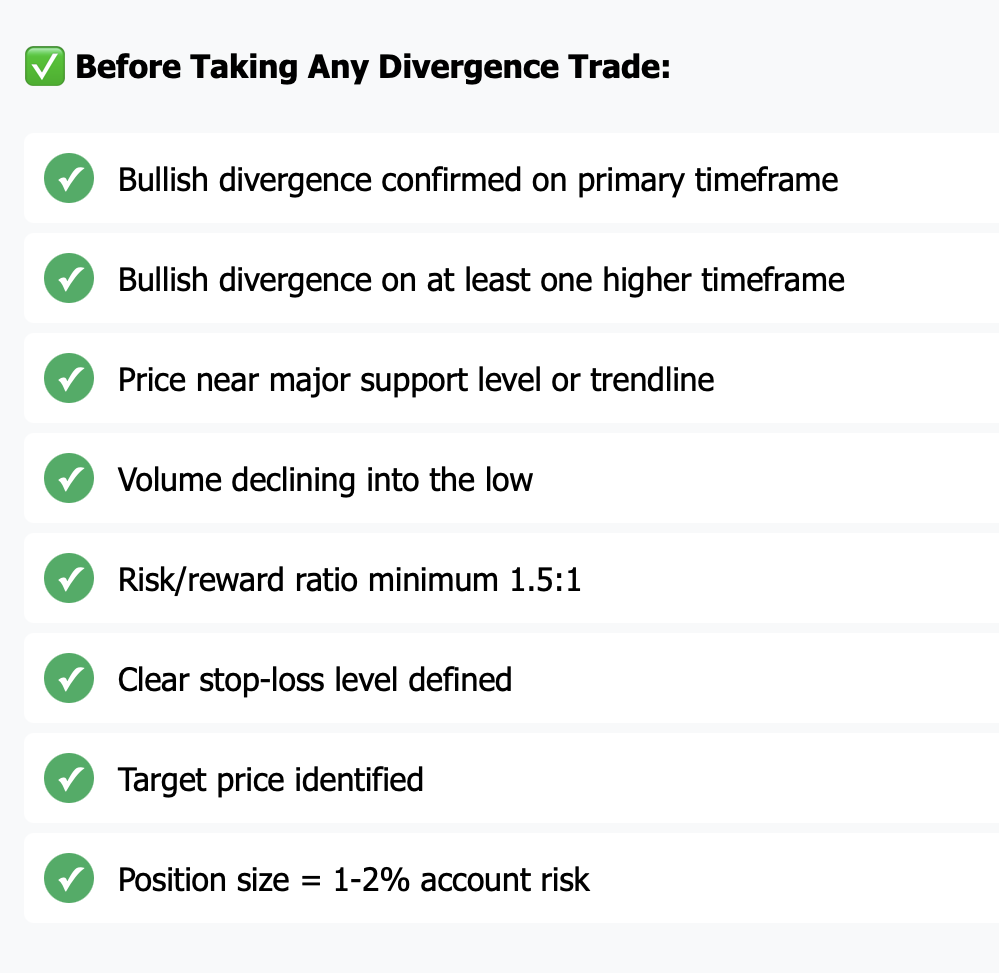
Only take the trade if you can check most of these boxes. Having these metrics will keep you disciplined, help prevent emotional decisions, and keep you focused on a high-probability setup.
Here's one last thing: Position sizing is more important than you think. Even with a perfect divergence signal, you can expect the individual trade to fail. For any trade, never risk more than 1-2% of your account. If you have a $50,000 account, your risk per trade is $500-1,000. This allows you to survive a period of losing trades while you wait for your winners.
The majority of traders who are successful with divergence will not be traders who took every signal. These traders selected high-quality setups, were disciplined with risk management and would let their winners run and declared the loss quickly.
Common Mistakes and Tips: Avoiding False Signals
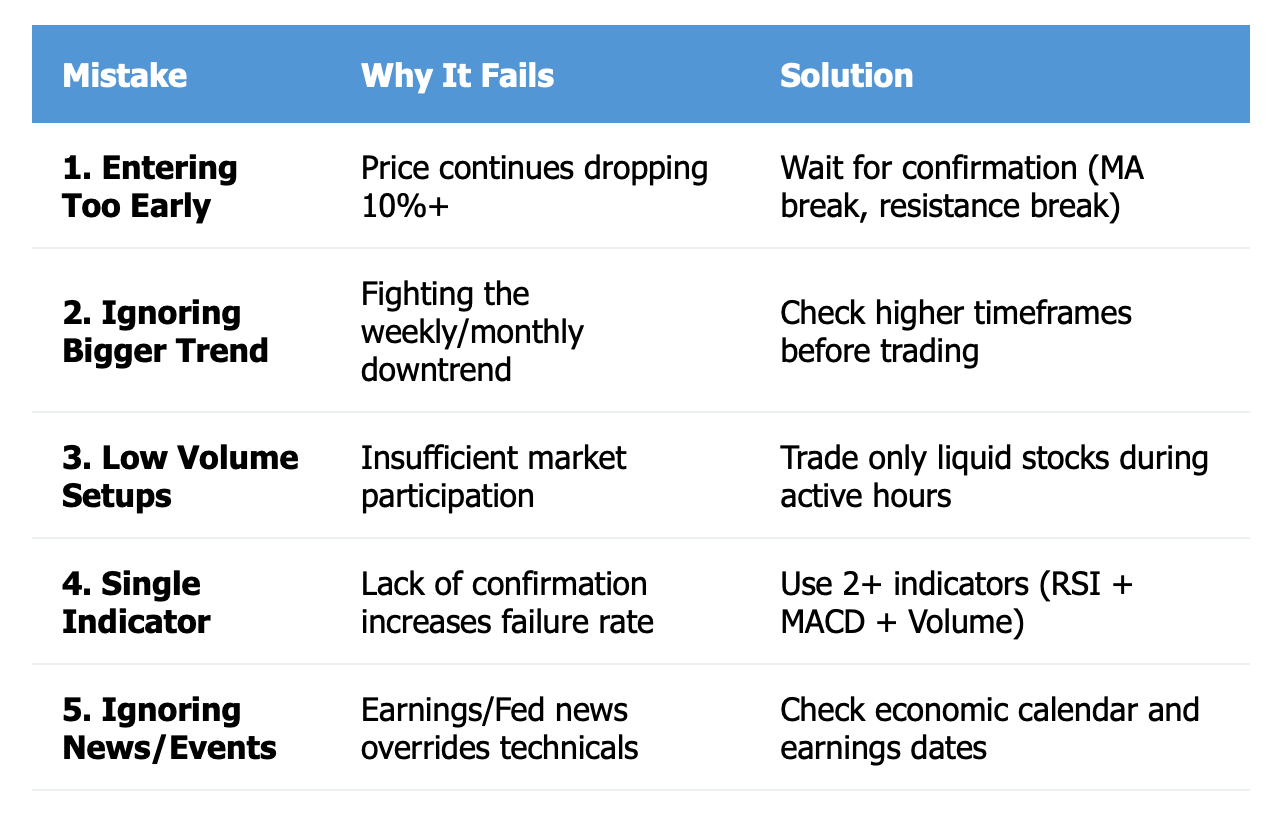
Even traders with years of experience make mistakes when trading divergence. However, understanding the mistakes can save you a lot of money from making the same errors.
Error 1: Getting in Too Early
You see divergence, and you buy right away. The price proceeds to drop another 10%. What happened? Divergence tells you a shift in momentum may be changing direction, not that the price is at the low. Always wait for the proper confirmation. The confirmation might be simply breaking a resistance level, a moving average crossover, or even having a green candle with volume that you can see. Patience is key.
Error 2: Ignoring The Bigger Picture
Bullish divergence on a hc looks good until you zoom out and see the weekly hc has been getting smashed. The hourly divergence may get you in and out with a quick bounce but you are swimming up current. You want to trade on the same timeframe for divergences with your trade timeframe and always respect the bigger trend. Trying to catch falling knives because you saw divergence on the 5 minute chart can be a quick way to lose money.
Error 3: Trading in a Low-Volume Environment
You are excited about divergence on one of your favorite stocks, but the volume is virtually non-existent. Low volume means fewer market participants, leading to less reliable trading signals. Even legitimate divergence can fail to cause a price reversal when there is insufficient interest in the market. This frequently happens with exchange-traded funds (ETFs) during low-volume trading or with small-cap stocks. It's best to trade in stocks that have sufficient liquidity and during times when trading is busy.
Error 4: Relying on Too Few Indicators
You buy a stock because the RSI denotes divergence, and the price moves against you. Subsequently, you then realize that the MACD was trending lower and the volume was surging. Divergence signals with only one indicator (such as the RSI) are less reliable without confirmation from at least one other indicator. If the RSI, MACD, and volume are all higher, then the probability of success jumps dramatically. Don't be lazy. Check confirmations from at least one other indicator.
Error 5: Ignoring the Broader Market Context
Bearish news may override the signals given by technical indicators. You may have perfect divergence on the stock and execute the trade only to have the company announce horrific earnings soon after. Technical analysis doesn't exist in a vacuum. Before executing trades on divergence, check the earnings calendar and major economic announcements (like employment reports, GDP announcements, etc.), and the sector to which the stock belongs.
Consider a real-life false signal: In June 2022, many traders noticed bullish divergence in SPY near the $370 level. The RSI was generating higher lows curiously while price was making lower lows, and it all seemed perfect, yet the Federal Reserve was in aggressive rate-hiking mode and the bearish macro backdrop negated the strength of the technical signal. SPY continued down to lose another 15% before ultimately bottoming. The divergence was fairly obvious, but it was just too early. Sometimes, you need numerous divergence signals over a series of weeks or sometimes months to see a real reversal happen.
Another example: A tech ETF widely held by day traders was creating bullish divergence in the early morning hours when the intraday traders couldn't wait to step in, with the only problem, trading volume was extremely light due to summer and so many institutional accounts were on holiday. The divergence produced a minor bounce before fading in midday, and although the technical signal was not wrong, the context made it an invalid signal.
Here's an example of how Apple divergence fools traders in late 2018: The stock showed bullish divergence near $160 in November. Some traders bought, but throughout December and early January 2019, Apple stock lost another 20% before it began to approach a bottom at $142 before finally reversing. The bullish divergence in Apple was a warning, but it was not a buy signal; those traders who sat tight and waited for the added confirmation of price breaking back above the 200-day MA over the next couple of weeks generally did a whole lot better than those who bought initially.
How to Improve Your Accuracy
Begin using longer time frames as you're getting used to things. Divergence on a weekly chart is usually more reliable than divergence on an hourly chart. There are still false signals, but there are fewer of them, which is good.
Find at least two forms of confirmation. Maybe that's divergence on both RSI and MACD. Or maybe divergence plus a break above a previous key moving average. Or maybe divergence plus volume increasing on a reversal. The more confirmations you have, the more you filter out the weak signals that may be unreliable.
Maintain a trading journal. Every time you take a divergence trade, make a note of the setup, what indicators you used, your timeframe, volume conditions, and the outcome. After 20-30 trades you will see patterns develop. You will also see which setups tend to be the strongest or weakest for your own style.
Keep sector rotation in mind. If the whole tech sector is being hammered, bullish divergence in an individual tech stock is probably not very trustworthy. Wait for strength in the sector, or look for divergence in individual stocks in stronger sectors.
Remember that divergence is more effective in a range when the market isn't trending strongly. During prolonged bull or bear runs, the momentum can stay overbought or oversold for long periods of time. Divergence may appear, but the trend continues in the same direction. In choppy, range-bound markets, divergence signals are more reliable, because reversals will be more likely.
Successful traders do not seek perfection; they seek to maximize their profitability by carefully choosing advantageous and high probability setups, and skilfully managing their risk. There is no problem missing some signals because you waited for further confirmation. As a trader, avoiding false signals is as much a skill as catching true signals.
Summary & Key Takeaways: Mastering Bullish Divergence
Bullish divergence is a strong ally in your trading toolkit, but like any tool, it's only valuable if used correctly and in the appropriate context.
The mechanics are quite simple: if a price drops lower for a third time, yet the indicators (RSI, MACD, Stochastic) show a higher low, then the selling pressure is dissipating. Divergence often occurs prior to changing the trend. We've convinced you there are two types. A standard bullish divergence tells you the trend is changing from down to up, whereas a hidden bullish divergence shows you the uptrend will be continuing after a minor pullback.
The process for identifying divergence should be methodical: create a low in price, check your indicators, confirm through multiple timeframes, and verify through volume character. The best signals occur when you have more than one indicator showing divergence and furthermore when both shorter and longer timeframes are showing the divergence.
A trading strategy that is based on divergence will require some structure. In general terms, we look to combine the signal from divergence with support and resistance levels, moving averages, and volume confirmation. You will also always want to set a stop-loss below the low of your divergence and enter trades with a minimum risk-to-reward ratio (at least 1.5:1). Want to create space? Position sizing is extremely important here: lean on limiting your risk to 1%-2% of your capital per trade because losing trades is inevitable.
Common mistakes cost traders money. Don't jump in too early before confirmation. Don't ignore the bigger trend context. Avoid low-volume setups. Use multiple indicators for confirmation. Check market and sector conditions before taking trades. Keep a journal to track what works and what doesn't.
For beginners, start simple. Focus on a daily chart with RSI and MACD. Look for divergence near obvious support levels. Wait for price trade to break above the previous day's high before entering. Use small position sizes while you gain experience. You can paper trade first if you're completely new. There is no rush. There will always be new opportunities in the market.
For more experienced traders, you can layer in complexity. Use multi-timeframe analysis, combine with trendline breaks, add in some volume analysis, or trade options to limit risk on divergence setups. But even with professionals, keep it systematic. A checklist helps eliminate emotional decisions.
The real power of divergence is its early-warning nature. Many traders will be patient and wait for an obvious reversal, the divergence signals you to have a position before the trade signal shows up, eventually leading to inside crowded trade action. Entering early often means the best reward/risk ratio because you enter right near the low with a small or 'tight' stop and are targeting the trade back to the highs or previous highs.
Experience is key. Pull back the charts for Apple, Tesla, SPY, and QQQ where you can mark historical divergences and observe the results. You'll notice patterns. You'll see which timeframes work best, which confirmation signals were most useful, and which market conditions produced the best divergences.
The market rewards patience and discipline. Don't feel as though you need to trade every divergence that you're able to identify. Be patient and wait for high-quality setups, where multiple elements are aligned together. Quality over quantity, is what wins in trading.
Bullish divergence doesn't have the power to change your life. It won't make you wealthy overnight. However, in conjunction with an overall trading plan that includes aspects to risk management, position sizes, and the overall context of the market such as price action, it gives you an edge. And that edge, applied over time consistently, is what separates winning traders from everyone else.
Continue your education and your practice - and never risk more than you are willing to afford to lose. The trader that is best at using divergence isn't the one with the most theory. It's the trader that has the most screen time, gains experience from their mistakes, and sticks with their process after wonderful wins or losses.
Ready to spot your next winning trade before the market does? Start tracking divergence signals today, but remember: knowledge without action is just entertainment. Open your charts, find three historical divergence patterns, and see how the trades would have played out. Your future winning trades start with the practice you put in right now.
Disclaimer: The content of the blog does not represent any position of Trade W, does not serve as any trading-related decision advice, and does not endorse any third-party.