

 Trade W

After a long period of declining prices, the trader often looks at the price chart and asks themselves, "Is this the bottom of this stock?" One very clear indication the market provides us to answer that question is the bullish engulfing candlestick pattern.
The bullish engulfing candlestick pattern consists of 2 candlesticks and can be seen in all the markets such as Forex, equities, commodities & cryptocurrencies. If you understand how to trade the bullish engulfing candlestick pattern, it has the potential to completely transform how you trade turning points.
In this guide, we will explore the bullish engulfing candlestick pattern in detail: how it is formed, what the psychology of the bullish engulfing candlestick pattern is, how to enter a trade, where to set your stop loss, and how to avoid falling victim to false signals, which are often the downfall of many beginner traders.
What Is a Bullish Engulfing Pattern?
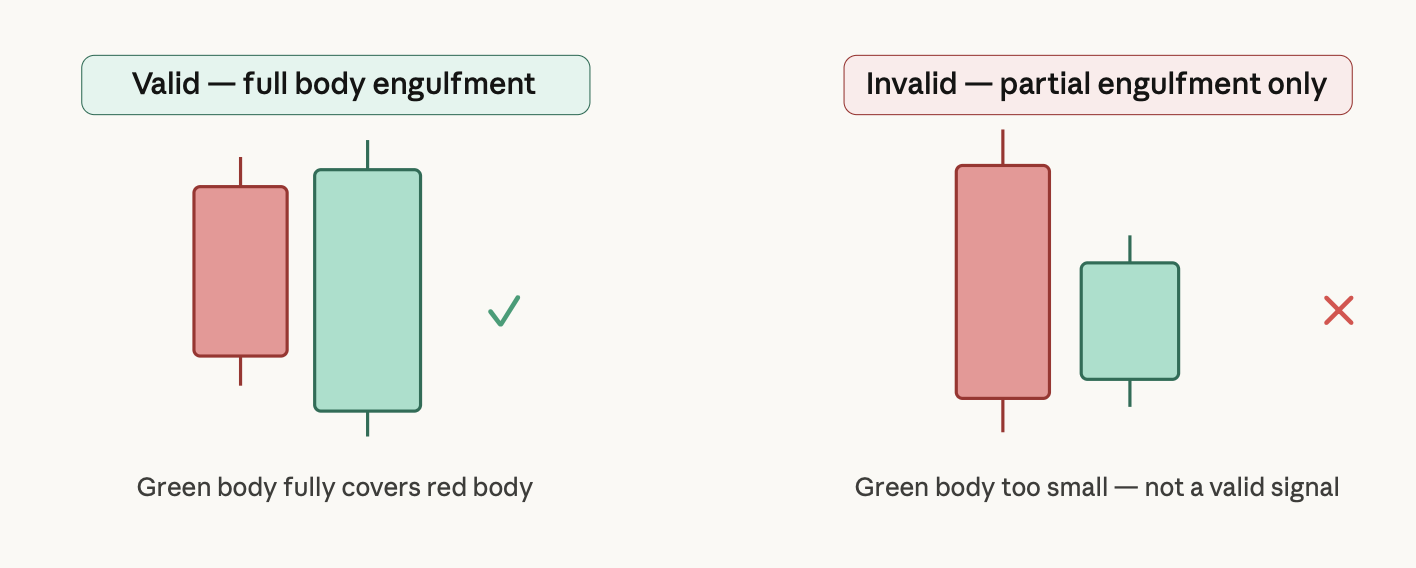
The bullish engulfing candle is created when a larger green (bullish) candle completely engulfs the previous smaller red (bearish) candle, after there has been a downtrend. The 2nd candle opens below the prior candle's close and closes above the prior candle's open, showing that buyers are in control.
The Structure: What You're Actually Looking For
The diagram above shows it clearly, but let's walk through the rules so you can spot the real thing and skip the fakes.
The first candle is bearish. It closes lower than it opens, sellers are running the show, and the trend has been falling. This candle represents exhaustion in the making.
The second candle is the one that matters. It must:
-
Open at or below the close of the first candle
-
Close above the open of the first candle
-
Have a body that fully covers the first candle's body (wicks don't need to be engulfed, just the bodies)
The bigger the second candle relative to the first, the stronger the signal. A tiny bullish candle barely covering a large bearish one? That's weak. A large, decisive green candle swallowing a small red one? That's what you're after.
Common mistakes traders make:
-
Counting the pattern in a sideways market (it needs a prior downtrend)
-
Accepting a bullish candle that only partially covers the bearish body
-
Confusing the pattern with a simple green candle after a red one
The Psychology Behind the Pattern
Here is what causes this pattern to meaningfully represent a change in control rather than a random shape of a candle:
When there is a downtrend, it is obvious that sellers are dominating the market. Push prices lower with the bears and no longer buy with the bulls, causing fear within the market. The first candle of a bullish engulfing setup represents the last of the seller’s dominance in the market.
As the second candle is opened, the short sellers in the market become rapidly squeezed. Traders who went long in the market have stop-loss orders just above the most recent highs. If the price spikes up, these stop-loss orders trigger automatically, causing short-term buyers to sell at a price above what they were willing to pay.
Institutional buyers are jumping in as well. Typically, large-scale purchases are made once the market has experienced a fear-driven sell-off. When a large bullish candle appears at a support zone, it usually indicates that the 'smart money market' is buying and the retail traders are selling.
At this point, the overall market has changed from being fear-based to being optimistic. When the crowd was bearish, the candle closed higher than it opened. Other momentum traders will react to this, and whereas traders previously in a holding pattern will now enter the market.
The main principle of the bullish engulfing candle, though, should be understood as more than just a technical shape; it is used as an indication of a true change of control over the series of trades within the auction.
Why Context Matters: The Downtrend Requirement
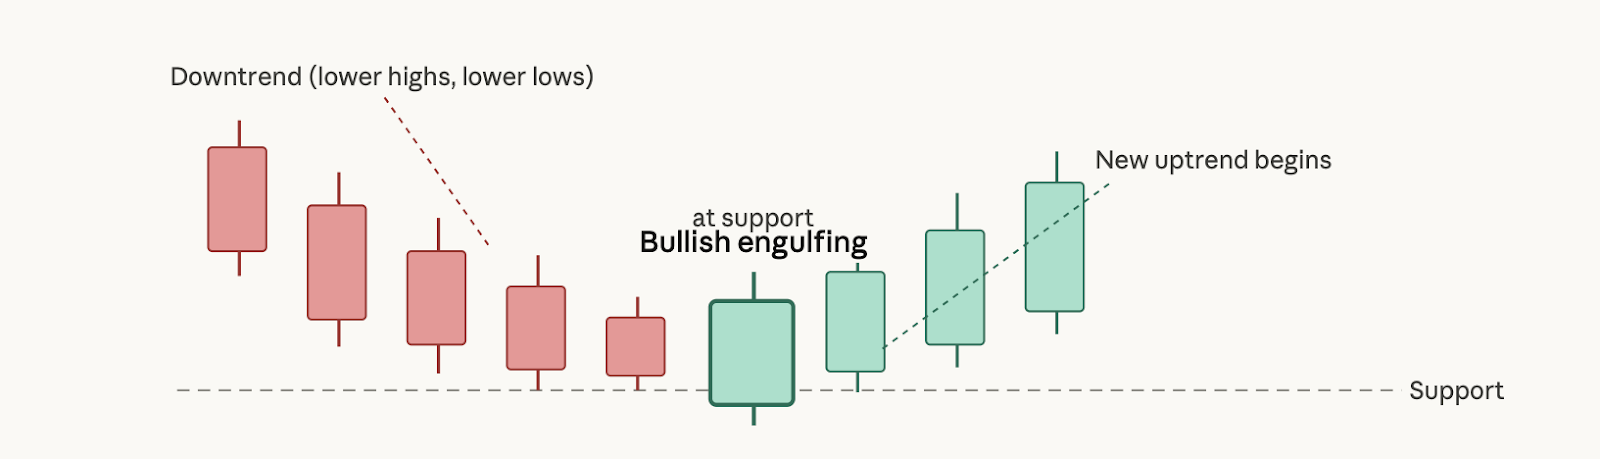
An isolated bullish engulfing pattern will not carry enough weight unless it has adequate context, so a clearly defined downtrend must be present first. An isolated single-day decline or trading in a sideways market will not provide that context.
To determine if there is enough weighting behind the bullish engulfing pattern, you will need to see a downtrend consisting of several consecutive lower highs and lower lows.
The reason context is important to the bullish engulfing pattern is that the purpose of the bullish engulfing pattern is to indicate a reversal of price action in trading. Without a preceding downtrend, there is nothing to reverse the price action; therefore, a bullish engulfing pattern after an initial three weeks of selling and downtrending would have far greater significance than a bullish engulfing pattern occurring during a consolidation period.
Another great set-up when using the bullish engulfing pattern is when it occurs, such as at old highs that have become new lows, at demand zones, or at levels defined by key Fibonacci levels, at or near structural support levels after a downtrend, where all things considered increase the odds in your favour.
Many guides seem to lack detail, but this one gives you a precise strategy.
Initial Position: The safest method of entering the market is on the close of your chosen time frame’s bullish engulfing candle. Don’t enter during the candle. Wait until after it finishes closing to confirm the engulfing candle has formed before entering on the following candle opening price.
Another method would be to enter prior to the completion of the engulfing candle. Doing so, however, has a much greater chance of loss since you would expose yourself to the risk of a reversal during the last few minutes of the candle.
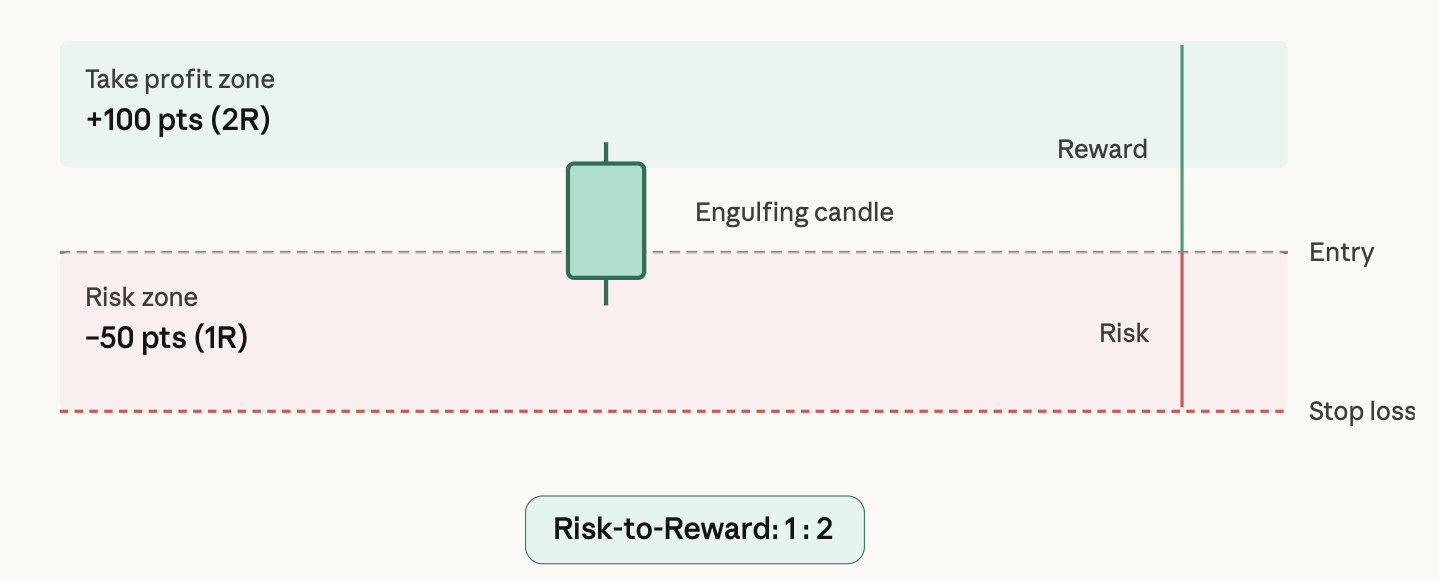
Stop Loss: The stop loss should be placed below the lowest point of the engulfing candle, or below the lowest point of the two-candle formation if applicable. This is the most logical point to exit your position if the engulfing touch is falsely signalling that the trend is reversing.
Take Profit: Targets should be set at either significant resistance levels or the nearest structural high. The minimum risk-to-reward ratio should be 1:2; if you lose 50 points on the trade, you will still have a target of making at least 100 points.
Position Size: You shouldn’t risk any more than 1-2% of your account balance per trade. Your position size is determined by how far your entry point is from your stop loss, not by any arbitrary number of shares or lots you might want to buy.
Confirming the Signal: How to Avoid False Breakouts
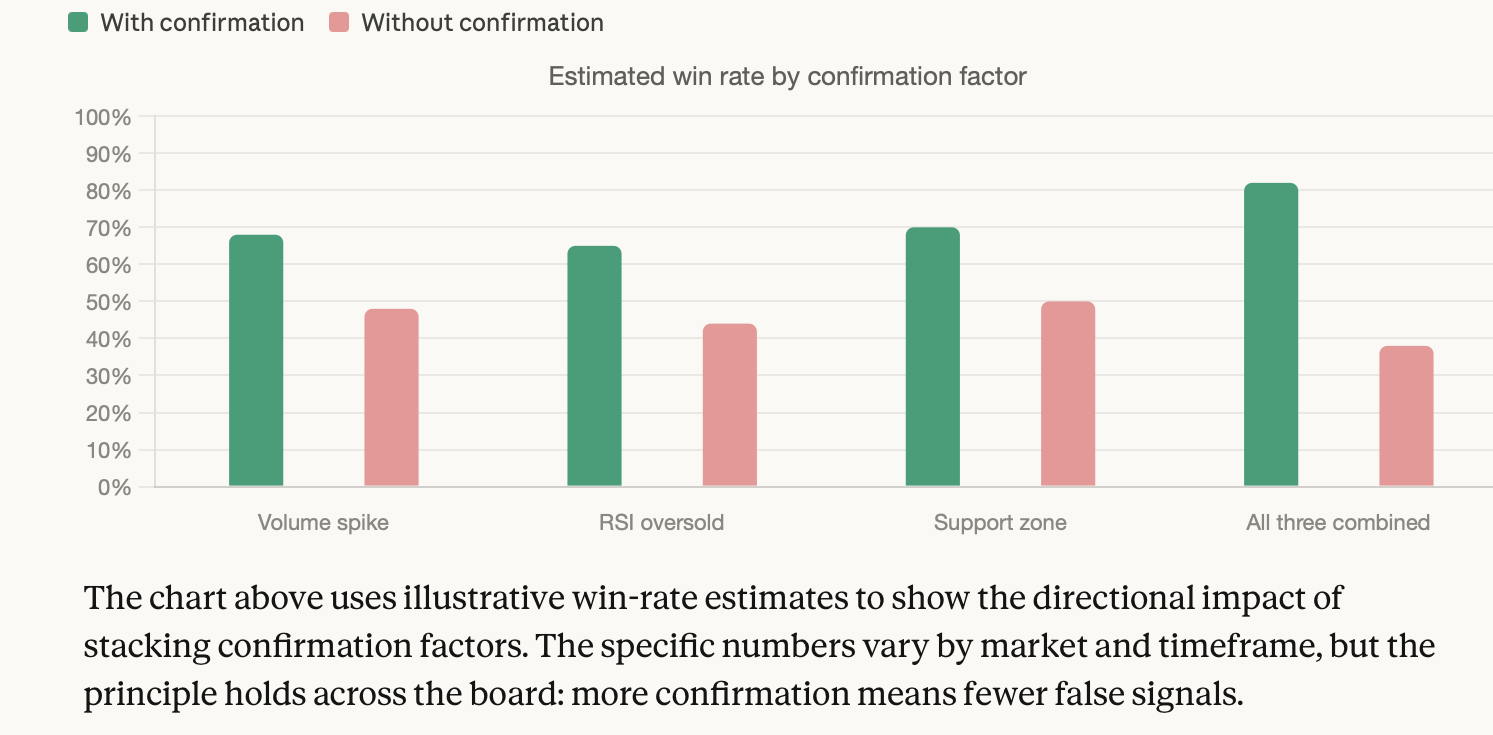
Isolated occurrences of a Bullish Engulfing are indicative of a potential reversal; however, they do not serve as confirmation. Utilising additional metrics will help to narrow down true reversals from fake outs.
Volume is the single most powerful metric. When there is a Bullish Engulfing pattern that appears with an engorged volume relationship as compared to its previous candles, you can infer that large commercial orders have entered the market.
Conversely, if a Bullish Engulfing candle is classified as such, but occurs with extremely low volume, it will suggest that you should wait for confirmation before entering the market.
If the RSI indicates that the underlying asset has been recently oversold (i.e., it is reading less than 30) as the Bullish Engulfing occurs, this would add to your confidence that the market is poised for a short-term bounce.
If the market displays strong support at a previously tested price and also demonstrates a Bullish Engulfing candlestick, then the probability of that being the bottom increases.
The retest strategy is a conservative approach for most, as traders will wait for the price to return to either a previous support level or to the midpoint of the Bullish Engulfing candlestick prior to entering. This allows for a more favourable price to buy the asset while also permitting a tighter stop loss, thus improving the risk-to-reward ratio.
Building a Full Trading System Around the Pattern
Step 1: Use a market structure to identify trades that are bullish engulfing after a decline has set in. After you set the larger timeframe structure (daily/weekly), look for long on a smaller time frame (4H/1H) for entry points.
Step 2: Find demand zones to determine where the price stopped moving in the past. The higher the value of the previous bounce location, the more reliable the reverse could be; therefore, reversing prices back to the previous demand point, where institutions have been historically active.
Step 3: Apply Fibo levels from the most recent high, expect to find support in the 61.8% to 78.6% Fibo retracement zone, as they generally reverse trend direction and provide high-quality setups.
Step 4: Volume and RSI as gates: When deciding whether to trade, you should consider: Does the volume exceed historical levels for the engulfing candle high? Is the RSI falling below 40 or below the range of an oversold condition? If your answer is yes to either or both counts, the setup passes through this gate. If the answer is "No" on both counts, then delete the setup.
Step 5: Determine risk before you enter - Don't enter a trade without having marked a stop loss, position size, and target price.
Step 6: Test and review - Look at historical price action and record how many times this setup has worked in your respective market over 20-30 setups prior to going live and trading this pattern based on historical data.
Which Markets Work Best for This Pattern?
Many markets have displayed Bullish Engulfing formations.
Bulls were created by a downturn that followed either a recent gain, such as from an earnings release, or because the entire sector was down. The Bullish Engulfing created on support would mark the start of a major move upwards.
The FX markets also provide good examples of how Bullish Engulfing formations occur, particularly on either 4-hour or daily charts of currency pairs. Bullish Engulfing formations regularly precede changes from bearish to bullish moves at psychological numbers such as 1.2000 or 1.0500.
Cryptocurrency markets provide an abnormally high level of volatility; therefore, you can expect to find many more incorrect signals and much quicker reversals in these markets than in traditional markets.
For example, the price reversals that have taken any of the cryptocurrencies from a long downtrend to a new upward trend are nearly always preceded by a Bullish Engulfing formation. With cryptocurrency markets, volume confirmation is crucial to validating the signal from Bullish Engulfing.
In addition to cryptocurrency markets, Bullish Engulfing formations occur in commodity and index markets as well. Gold, oil and the S&P 500 all create opportunities for Bullish Engulfing formations to occur, especially during larger upward trending movements.
Overall, the sweet-spot time frame for Bullish Engulfing formations is between the 4-hour and daily charts; anything shorter than 4-hours has too much price noise for a reliable signal; anything longer than daily has too much lag on the signal, but does create a very reliable signal.
Frequently Asked Questions
What does bullish engulfing mean? It's a two-candle pattern where a large green candle completely covers the body of the previous red candle, appearing after a downtrend. It signals that buyers have taken control from sellers,s and a reversal may be starting.
Is the bullish engulfing pattern reliable? It's one of the more reliable reversal signals in candlestick analysis, but no pattern is right 100% of the time. With volume confirmation and proper trend context, it performs significantly better than the raw candle pattern alone.
What timeframe works best? The daily and 4-hour charts offer the best balance of signal quality and trade frequency. Lower timeframes like 15-minute or 1-hour produce more noise and more false signals.
Does volume matter? It matters a lot. A bullish engulfing candle with above-average volume is a much stronger signal than one on light volume. Volume is the difference between institutional participation and retail guessing.
How do you avoid false signals? Require context: a clear prior downtrend, alignment with a support level, and at least one confirmation from volume or RSI. Avoid taking the pattern in sideways, ranging markets.
Can it be used in crypto? Yes, but apply stricter confirmation rules. Crypto markets are prone to fakeouts. Always check volume, and consider waiting for a retest before entering.
Is confirmation always necessary? Not always, but the more confluences you have, the better the probability. A bare-pattern trade without confirmation is of a lower probability and should carry a smaller position size.
Ready to apply this in your own trading? At TradeWill, build and backtest your bullish engulfing system on real market data — because reading patterns is step one, and trading them profitably is step two.
Disclaimer: The content of the blog does not represent any position of Trade W, does not serve as any trading-related decision advice, and does not endorse any third-party.