

 Trade W

Capturing the bottom of a trend before ‘everyone else does’ is probably the most sought-after trade by most traders. The bullish hammer is one of the few candlestick patterns that provides this opportunity, not as a guess, but as a means of seeing exactly what buyers are doing and what sellers are doing in real-time.
The bullish hammer pattern can be identified on forex, crypto, indices and CFD markets. They are relatively easy to identify; however, they are often misread, which costs lots of traders’ money. In this guide, we will cover what exactly a bullish hammer is, why it works, how to trade it correctly, and where most traders make mistakes.
What Is a Bullish Hammer?
Hammers are candles that indicate a strong reversal in price action. A bullish hammer is typically seen on price charts at the end of a bearish trend, or the last phase of a bearish move in an overall upward trend.
The bullish hammer's name is derived from its shape, which resembles a hammer, with a small body at the top of the candle and a long lower wick that hangs below the small body. In most cases, the price falls considerably throughout the session, and sellers are persistent, but buyers eventually buy enough to bring the price back up to the level it opened. The bears tried to sell; however, the bulls won the day.
If a bullish hammer appears without a prior downtrend, it will not have the same significance. If a bullish hammer appears in the middle of a range, it is simply a candle with a long wick. Context is essential.
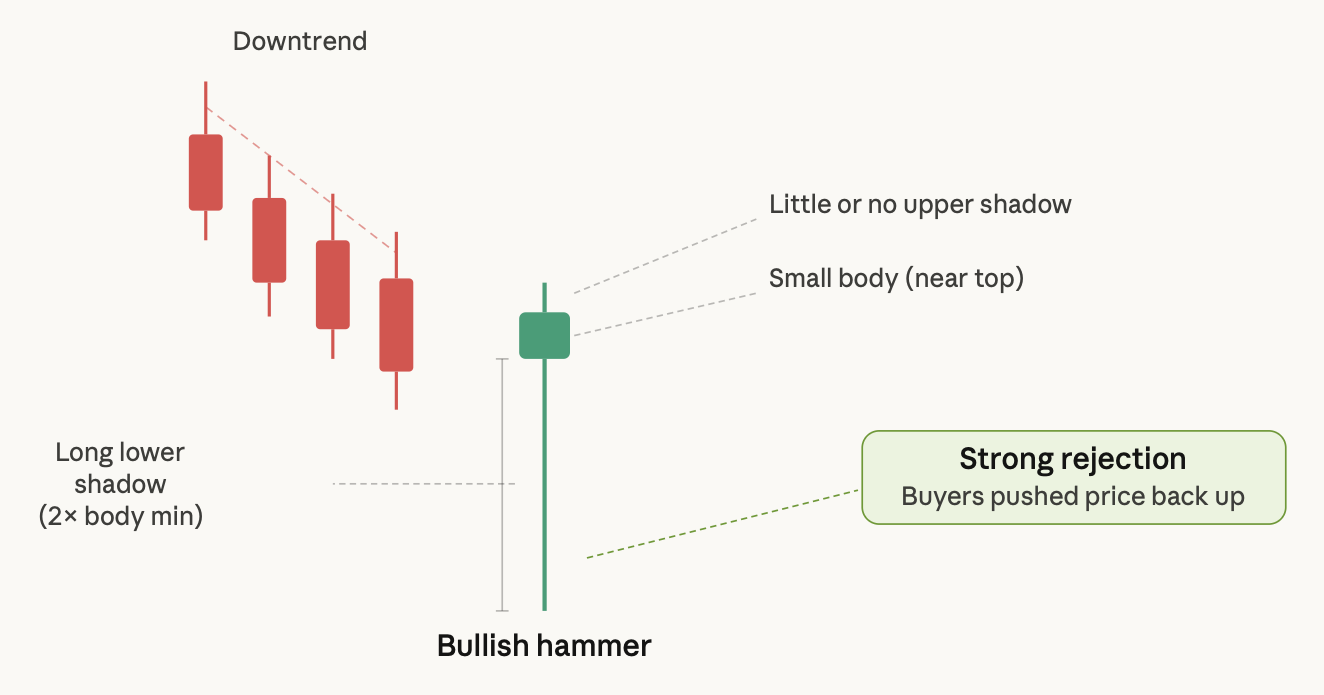
Anatomy of a Valid Bullish Hammer
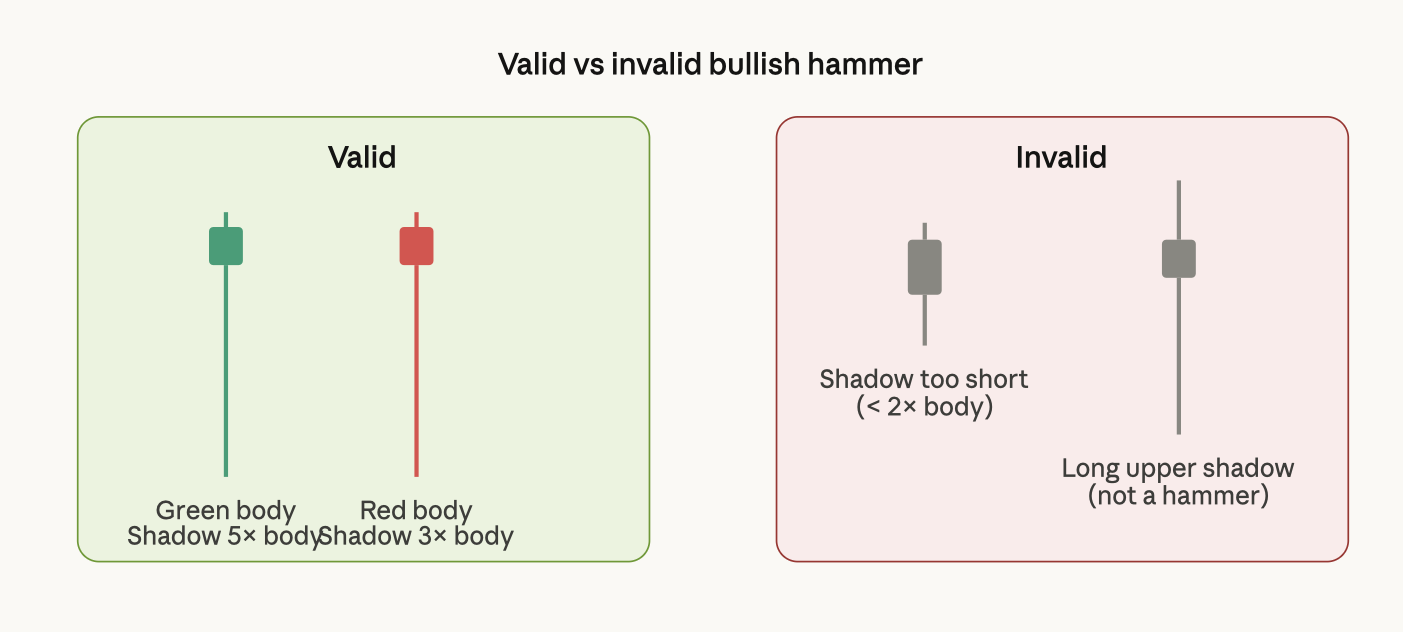
A long wick is not enough when trying to identify a bullish hammer. The following criteria should be met before considering a hammer to establish a bullish trend.
The lower shadow needs to be two times longer than the body. The three times longer the better, as there is more reliability. The body must be in the upper half of the total range of the candle. There should be little to no upper shadow, indicating that the close was close to or at the open. It can either be green (bullish body) or red (bearish body). However, green will have more weight because it shows that the buyers were able to close higher than their opening price.
Volume also plays a large role. If the hammer is formed with above-average volume, this is an indication that there was real buying pressure during this reversal, as well as good participation by the traders, therefore giving you a reliable indication.
The higher time frames will have more reliable signals than the lower time frames. For example, a hammer on a daily chart will have more weight than a hammer on a 5-minute chart because it encompasses more than five minutes' worth of market participants that helped create this hammer.
The Psychology Behind the Pattern
The bullish hammer is an important pattern because it can resolve tension for buyers.
Visualise a downtrend that has lasted several periods. Sellers dominate the market, news is bad, and retail traders are in panic mode. Somewhere during that trend, there is one session where the dynamics change because all of a sudden, prices drop sharply at the open and create new lows. The long lower shadow (aka: liquidity grab) represents panic, as everyone attempts to sell at the lowest possible price.
However, institutional buyers will begin to accumulate stock based on price, not by the news cycle, because "cheap is cheap." Inside "panic" buying pressure will absorb the sell orders, causing the price to build back the majority of the lost value by the end of the session.
The small body represents recovery, while the long lower shadow represents a rejection of lower prices.
The term "liquidity grab" refers to institutions needing to buy large amounts of stocks, with large orders being filled when there are available sellers for them to fill those orders. Institutions allow price to fall to eliminate weak hands, thus creating the needed liquidity; then they will reverse price action by purchasing stocks after their liquidity grab (i.e. buy on the panic) has taken place.
Retail traders see falling prices and sell; thus, they create "panic," while institutional traders see "optionality" and buy.
A bullish hammer is the moment when the tension of buyers has been revitalised.
Bullish Hammer vs. Hanging Man vs. Shooting Star
This is where most beginners lose money. These three patterns can look identical in shape, but their meaning flips completely depending on where they appear in the chart.
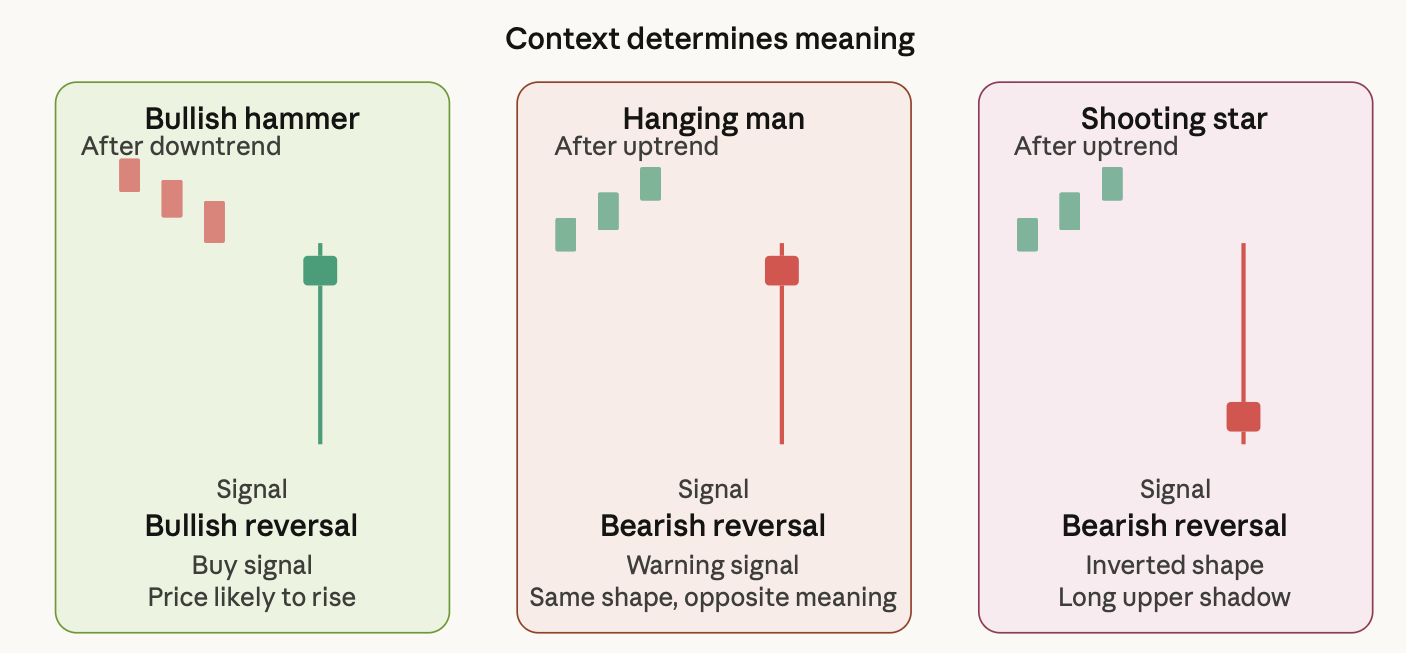
The primary rule is that if the same shape occurs within a bear trend, it represents strength, and if it occurs within a bull trend, it will act as an indication of weakness. The hanging man has the same proportion of the body and the shadow as the bullish hammer, but it forms after a rally and indicates that the sellers were attempting to test the market, and the buyers barely held on to the market at that time.
In comparison, the shape of the shooting star is different from that of the hanging man, in that it has a long upper shadow with a small body at the bottom; however, its message is the same in that the sellers were actively trying to reject the higher prices.
Don't trade based on just the shape - trade based on the context as well!
How to Trade the Bullish Hammer: Step by Step
Here's a practical approach that keeps risk well-defined and exits logically.
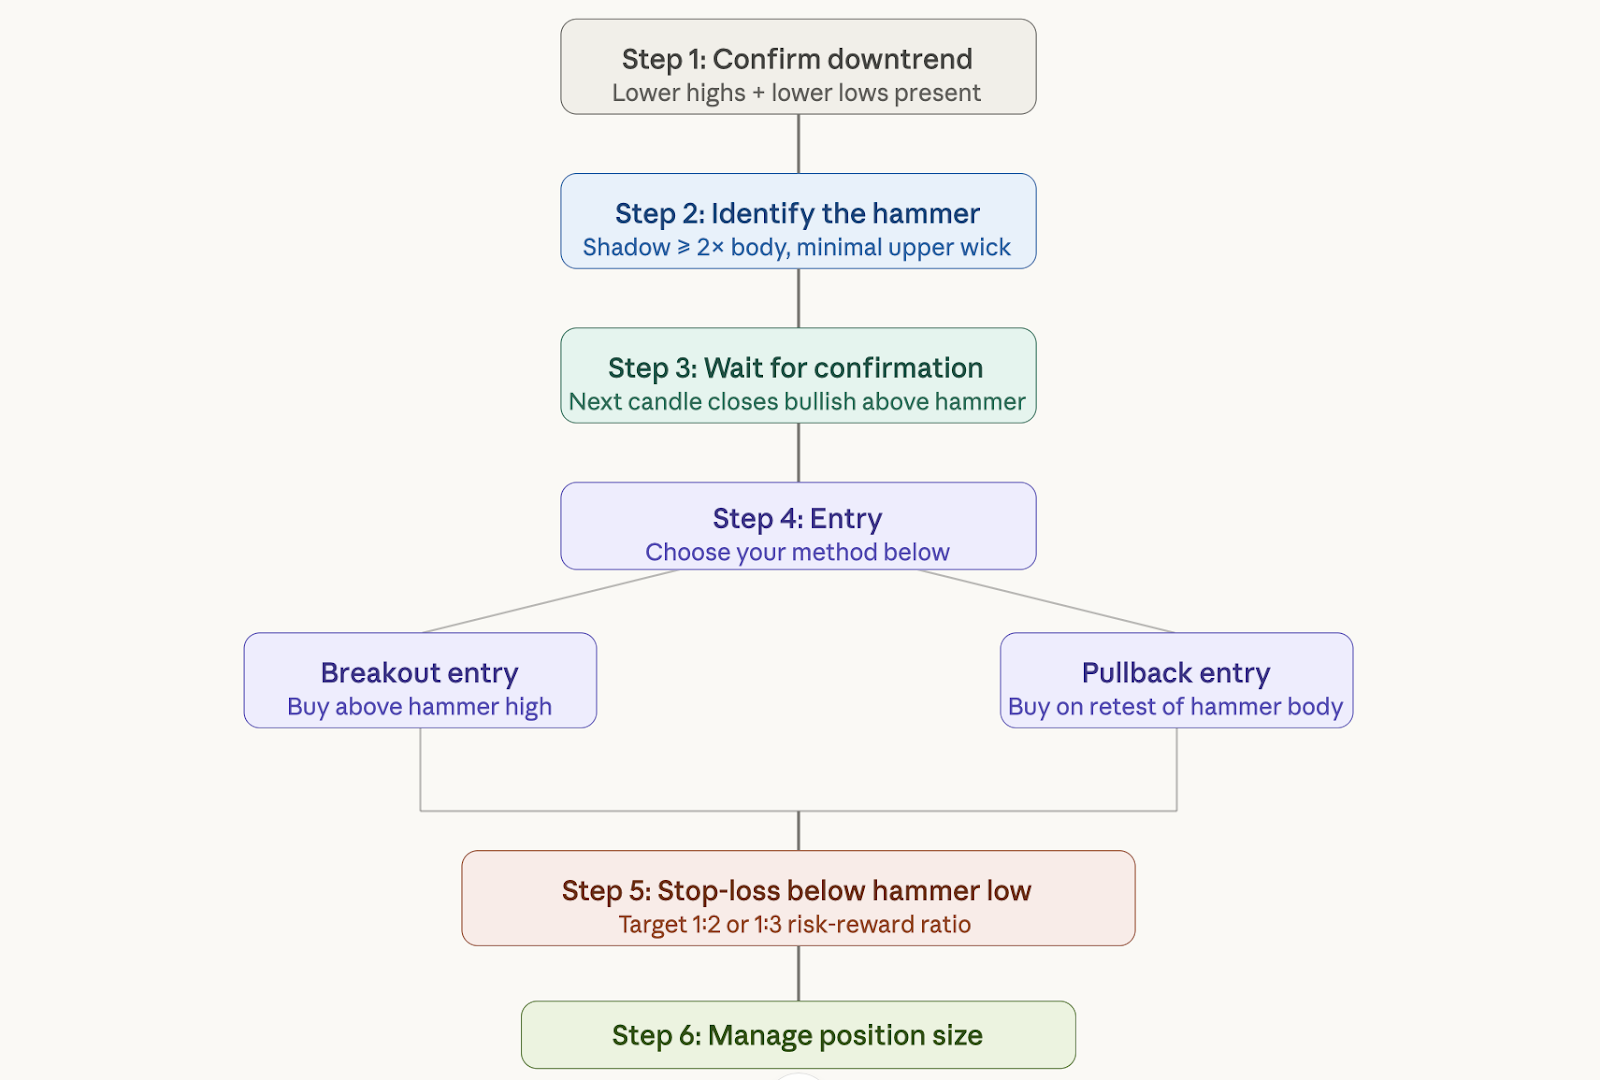
Most traders neglect the confirmation candle, but this is actually the most important component when trading a hammer. You are not simply buying the hammer; instead, you buy the action after the hammer and the candle that follows it.
If the next candle closes green and above the body of the hammer, this means that buyers follow through, and that is your trigger to enter.
Place your stop-loss below the low of the hammer; that is, where this level has already proven to be support. If the price breaks this support level, your original theory of reversals is no longer valid, and your exit needs to be quick.
Your target should be a minimum of a 2:1 risk-reward ratio; for example, your stop-loss is 30 pips away from your entry point, and your first take-profit needs to be at least 60 pips away.
Common Mistakes That Cost Traders Money
Trading in sideways markets: After a clear downtrend, the bullish hammer has reversal significance. In choppy and range-bound markets, long lower-wicked candles are just noise.
Buying before confirmation: The hammer candle closing can seem like a good opportunity, but this is how traders become trapped by the next candle moving lower immediately.
Not considering the bigger picture: The hammer at significant resistance is much less reliable than the hammer at significant support. Always know where you are part of the larger price structure.
No stop loss: The hammer refers to a probability, not a possibility. The markets can reverse on you, so using a stop loss order below the hammer low will help prevent a lost trade from becoming a damaging trade.
Not considering volume: If the hammer forms on low volume, especially in Forex, during low liquidity periods. The rejection may not be an institutionally based buy. Volume can confirm intent.
Advanced Confirmation: Stacking the Odds in Your Favour
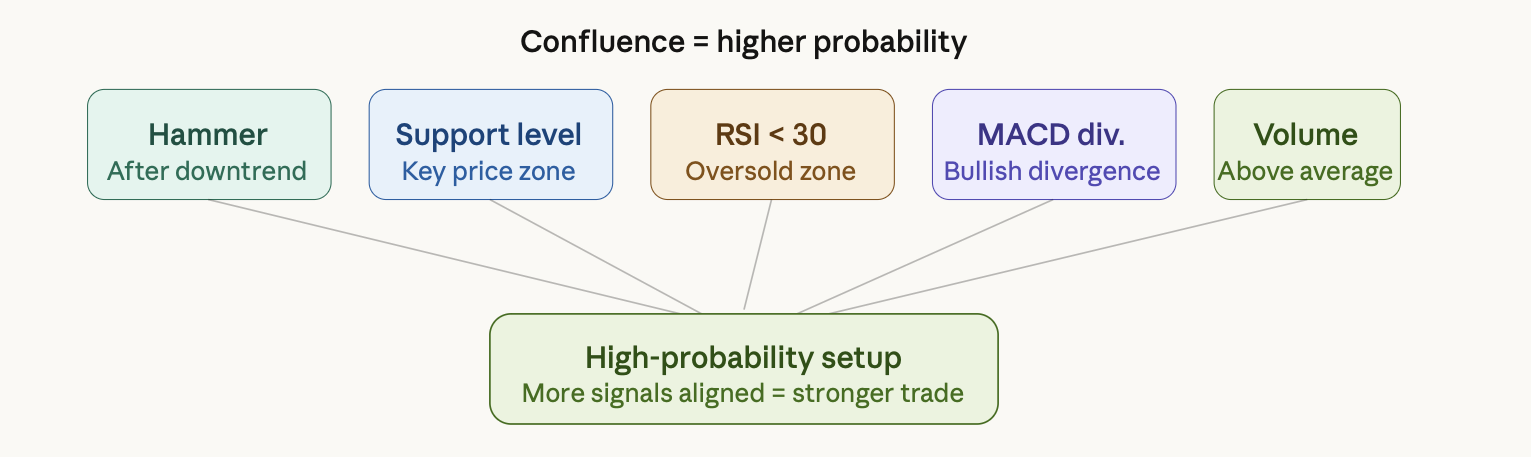
An isolated bullish hammer can indicate a future reversal; however, gauging its significance through additional indicators will provide more assurance.
Major Support Levels: The likelihood that a bullish hammer represents an actual reversal increases significantly if its lower shadow has touched and bounced off a significant support level (i.e., a previous swing low, a round number, a weekly pivot).
RSI Under 30: When the bullish hammer is formed, and the RSI is at or below 30, the market has reached an extreme oversold condition; because of this, buyers typically begin to enter at the extreme.
MACD Divergence: If there is a declining price but an increasing MACD histogram, sellers are losing momentum; therefore, the appearance of a bullish hammer will give a good entry point.
Multi-Timeframe Alignment: A bullish hammer that has been formed on a four-hour chart is more reliable as an entry point when it has been aligned with upward momentum on a daily chart.
This is what is referred to as confluence - no one indicator will tell you enough information about a potential trade by itself, but as multiple indicators begin to point in the same direction, you can move from guessing or speculation to probable success on a trade.
Mastering the Bullish Hammer in Real Trading
The bullish hammer does not provide any surefire signals, as it is just a structure that can be identified repeatedly. It indicates sellers have run out of steam at a certain price, and buyers are beginning to come into the market.
For the three key fundamentals: context (downtrend before the hammer), structure (correct shadow to body ratios, little to no upper wick), and confirmation (a follow-through candle closing above the body of the hammer), add at least one confluence factor (support level or RSI reading), and your odds improve significantly.
Before entering into trades, set your stop-loss. This discipline sets apart winning traders from losers, not through finding better patterns, but managing risk with the patterns they already know.
Traders who correctly profit from this pattern do not chase after every hammer they see; they wait for all conditions to be satisfied before entering with a solid plan and exiting at a defined point, win or lose.
To learn the bullish hammer, practice identifying it on historical charts before doing live trades. Once identifying structure becomes a habit, you will start to recognise the pattern like other seasoned traders; no longer as just a form on your screen, but rather a battle storytelling in which the participant is currently dominating the other.
FAQ
What does a bullish hammer indicate? It signals that sellers pushed the price significantly lower during a session, but buyers stepped in and drove it back up, suggesting the downtrend may be losing momentum.
Is a bullish hammer reliable? It's a useful signal with a solid historical win rate when confirmed, but it's not guaranteed. Reliability increases significantly when it forms at a support level with RSI below 30 and volume above average.
Can a bearish (red) candle still be a bullish hammer? Yes. A red-bodied hammer still shows rejection of lower prices. The green body is preferable, but the shadow length and location matter more than the body colour.
What timeframe works best? Daily and 4-hour charts produce the most reliable signals. Lower timeframes generate more false patterns due to noise.
How do you confirm a bullish hammer? Wait for the next candle to close bullish, ideally above the hammer's body. Some traders also use a break above the hammer's high as their entry trigger.
Ready to put this into practice?
Open a live chart on Tradewill.com and filter for hammers forming at key support levels across forex, CFD, and crypto markets. Your next high-probability trade is waiting.
Disclaimer: The content of the blog does not represent any position of Trade W, does not serve as any trading-related decision advice, and does not endorse any third-party.