

 Trade W
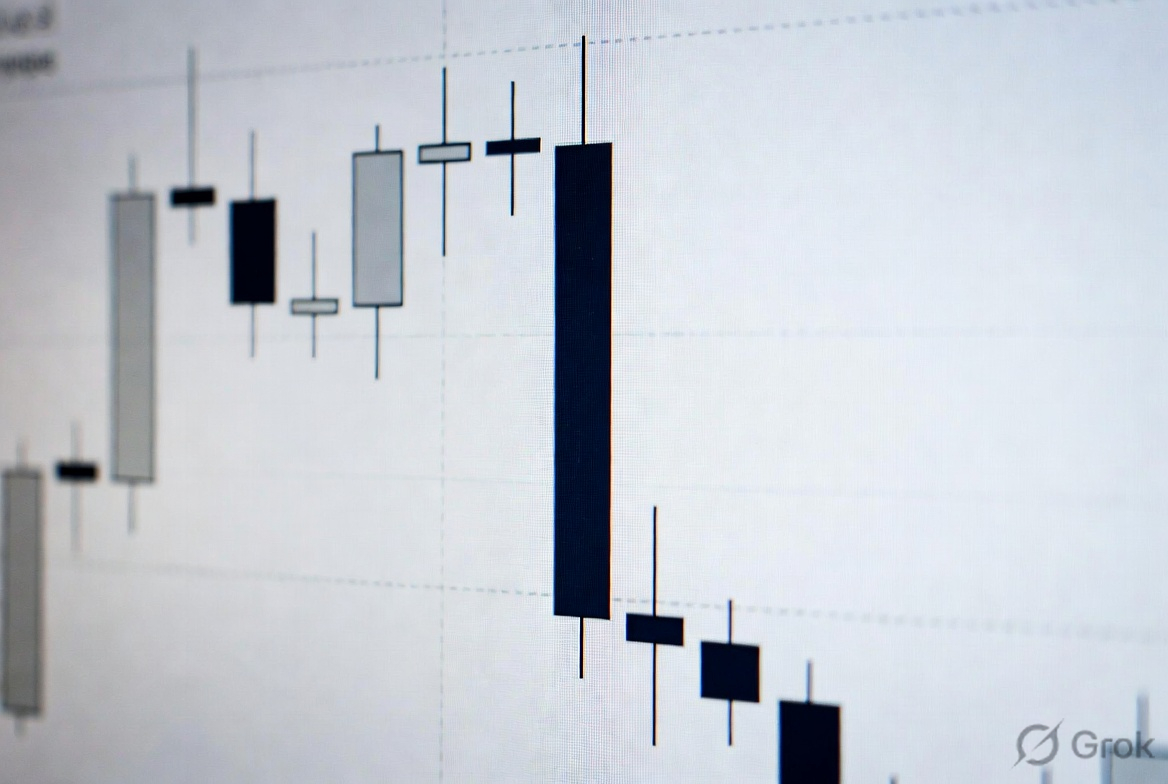
Japanese rice traders developed candlesticks in the 18th century. They are now the most widely spoken languages among serious traders worldwide across all asset classes: Forex, cryptocurrencies, stocks, and CFDs. The pin bar is one of the cleanest and most revealing candlestick patterns that traders can use to read the price action of their preferred market.
The way trader Martin Pring sells refers to pin bars as "Pinocchio bars." A pinocchio bar usually has a long bulge or is approximately double the width of the bottom portion of its body. The bulge can be interpreted similarly to Pinocchio's nose, opening a long position and making the trader uncertain about getting filled at that price until the market ultimately closes. It is evident to everyone that a consolidation of the trade has occurred.
The bullish Pin Bar pattern has been driven down by sellers aggressively during a significant move. However, once the buyers kick into high gear and push back up again before the close of the candle, it shows that they won the war against sellers. There is nothing random about this; it's a battle, and buyers generally win.
Bullish pin bars can be found in all markets as long as they are liquid. A bull pin bar can occur in the EUR/USD market at 3:00 AM in the London session, when Bitcoin bounces off a crucial level, or when gold reacts to a CPI number. Every trader must understand how to recognise and trade the bullish pin bar on multiple trading platforms.
This guide provides a breakdown of how to identify the bullish pin bar, the psychology underlying the pattern, and how to filter out the quality setups from the less favourable setups, as well as how to execute a trade based on this pattern.
Quick Defination
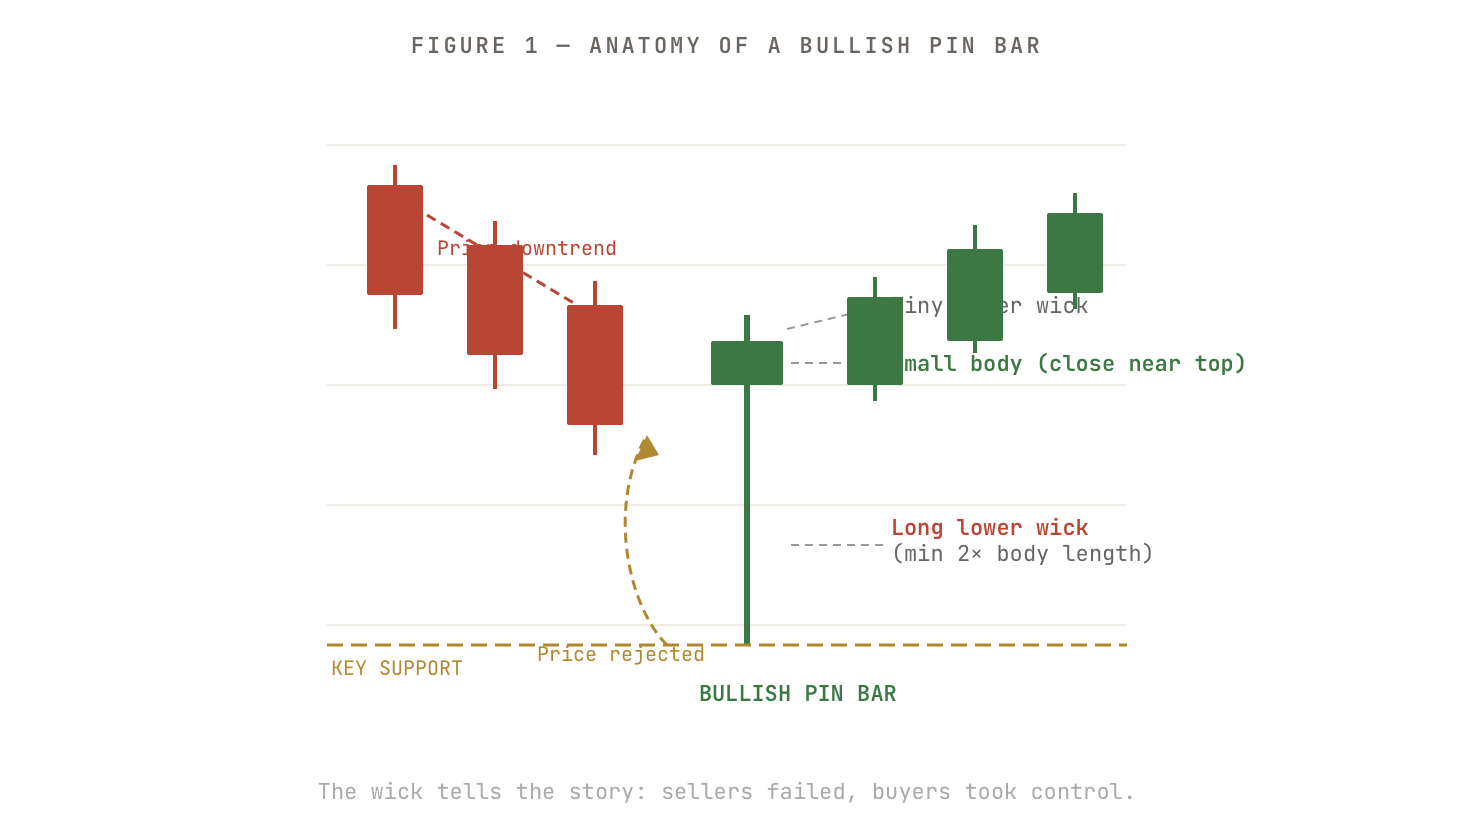
A bullish pin bar is a type of candlestick and is created by using one candle that has a long low wick and only a small body at the top third of the candle’s area. The close of this type of candle is significantly above the session low price for the day. A bullish pin bar forms at the top or bottom of a down-trending market, or at a significant support or resistance level, and when it does form, this type of candle, it suggests that on that particular day sellers pushed the price down but buyers lifted the price back above the low, which implies that there is potential buying pressure on the pin bar.
Properly Identifying a Bullish Pin Bar
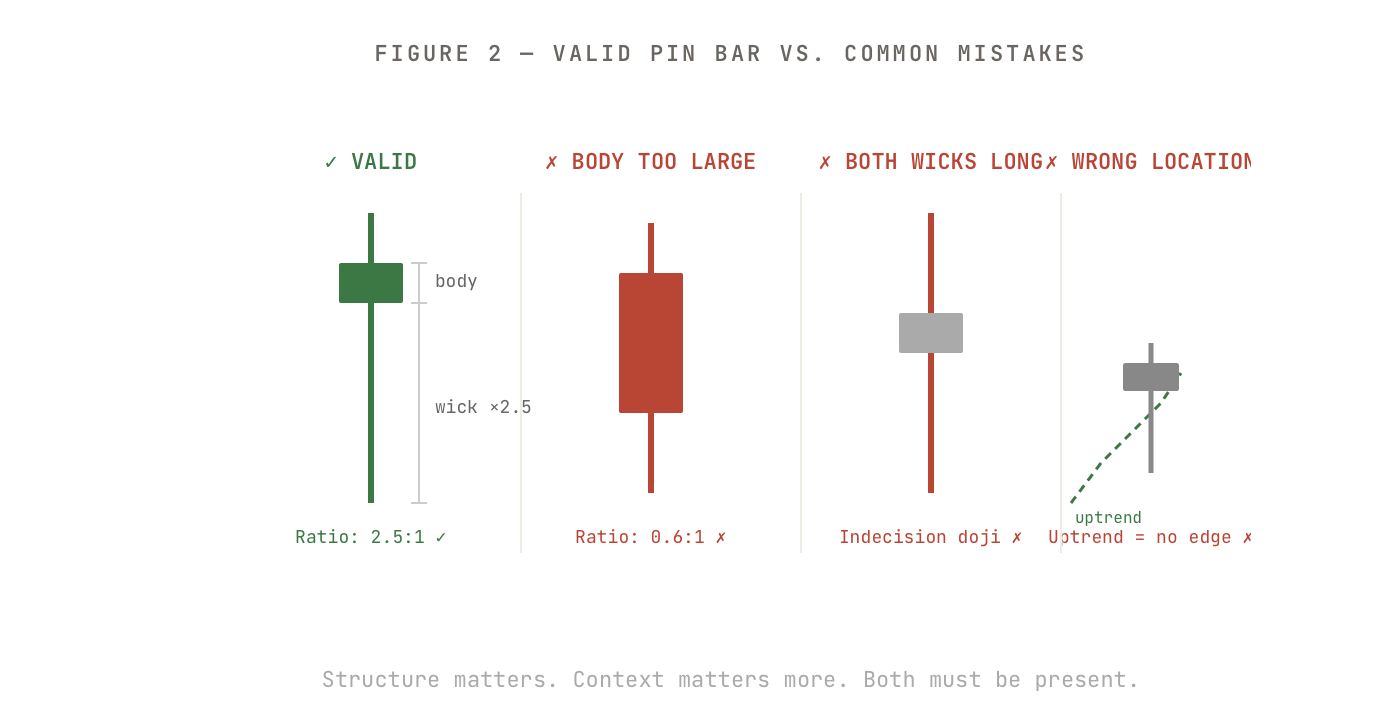
Many traders continuously make the same mistake when trying to identify a pin bar candle because they think they see a pin bar candle merely because it has a long wick. The true definition of a bullish pin bar exists only if certain rules and guidelines exist to validate that pin bar candle.
The lower wick must be at least double the length of the body of the candle for it to count as a pin bar. If this does not exist, all other aspects aside, this would not be a bull pin bar. The body must be short relative to the distance of the pin bar body and must be located within the upper third of the total distance of the pin bar candle.
The close of the candle must be located close to the top of the candle and not in the centre of the candle. You may have a very short wick, but if you have a long wick at both ends, then that is not a pin bar but an indecision candle.
The time frame in which you trade a pin bar also carries weight. A bullish pin bar that forms on the 5 min chart will form and fail in minutes, whereas on a Daily or H4 chart, there will be many more institutional buy or sell orders and therefore carry more weight because of the amount of time the price has traded before reaching those locations, versus on a 5 min chart. Most retail traders find H4 and Daily set-ups to have the best risk-to-reward ratio.
Understanding the candles is simple, but what causes them to form is very different and takes more faith. This is exactly what separates profitable from unprofitable traders.
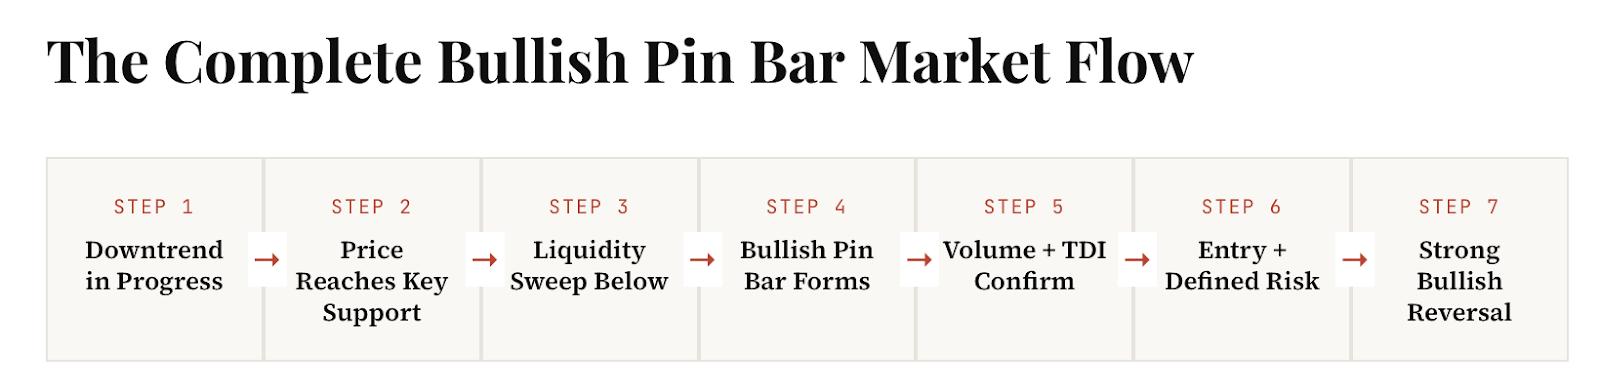
Typically, price enters a downtrend and comes to a known support level where retail traders hold long positions with stop losses just below the support. Large institutions and market makers know that a lot of retail traders will stop out below that level, so they briefly push the price below support, triggering all the stops and flooding the market with sell orders. This is referred to as a "liquidity sweep" or "stop hunt."
Once the liquidity has been used up, the institutions then reverse their positions and begin buying aggressively, pushing the price back up and closing much higher than where they triggered the liquidity. Therefore, there is a very long lower wick and a close near the high. This is a bullish pin bar.
That is why this pattern is so strong on higher time frames. On daily charts, the wick can represent a whole day of institutional manipulation and accumulation. You are not just reading the candle, but you are reading an institutional footprint.
A bullish pin bar doesn't just show that the market is likely to reverse; it also shows where the institutions came in and started purchasing. That provides a significant edge.
Find a Trade with the Pattern's Creation and Placement
If a bullish pin bar forms out of nowhere, it's not worth trading. A bullish pin bar formed in the proper location can be one of the best trades for a month or more. The location of the pin bar is everything.
When determining whether to trade the bullish pin bar, look for Demand Zones on Higher Timeframes, Prior Horizontal Support Levels that have previously been tested and held, or Dynamic Support such as a Rising 50-Period Moving Average using the Daily timeframe. Getting a bullish pin bar at any of these locations will give you confluence, while obtaining a bullish pin bar at the centre of a range without any meaningful structure nearby will render it tradeable.
Also, pay close attention to trend context. If the bullish pin has followed a significant downtrend, it is likely to carry more weight and have more potential than if it had followed only a slightly declining trend over two days. You want to be looking for the bears to have engineered considerable downward momentum, but have, in addition, the failure of that momentum will be the source of the opportunity for you.
Countertrend trading of the bullish pin bar with appropriate risk management can be possible. The cleanest setups will occur with higher timeframe trends pulling back to a significant level and, once the pullback has ended, producing a bullish pin bar.
Establishing a High-Probability Trading Setup Using Confluence
It is possible to use a bullish pin bar as an indication to trade; however, a bullish pin bar by itself is not a complete trading system. The overall trading system would incorporate additional confirmation layers to help eliminate noise and only include the highest probability pin bars for trading.
The most reliable sources of confluence when looking to develop a high-probability trading setup are as follows: a pin bar with a wick that has tested a clearly visible horizontal support level; when the price has either come into contact with or is very close to a Moving Average (MA); a pin bar that has a spike in volume indicating institutional buying occurred on the pin bar candle.
Lastly, a pin bar that appears on one timeframe but shows signs of an uptrend on another longer high timeframe. If three or more of these factors line up, then the probability increases significantly that a pin bar is a high-probability trading setup.
Finding confluence and using it to create a trading strategy shouldn't require eight different confirmations. Your objective should be to ensure that you are not trading random wicks, in random places, on random days.
Spotting False Pin Bars Before They Cost You Money
The market generates random-looking pin bars all the time. Here's how to tell the difference quickly.
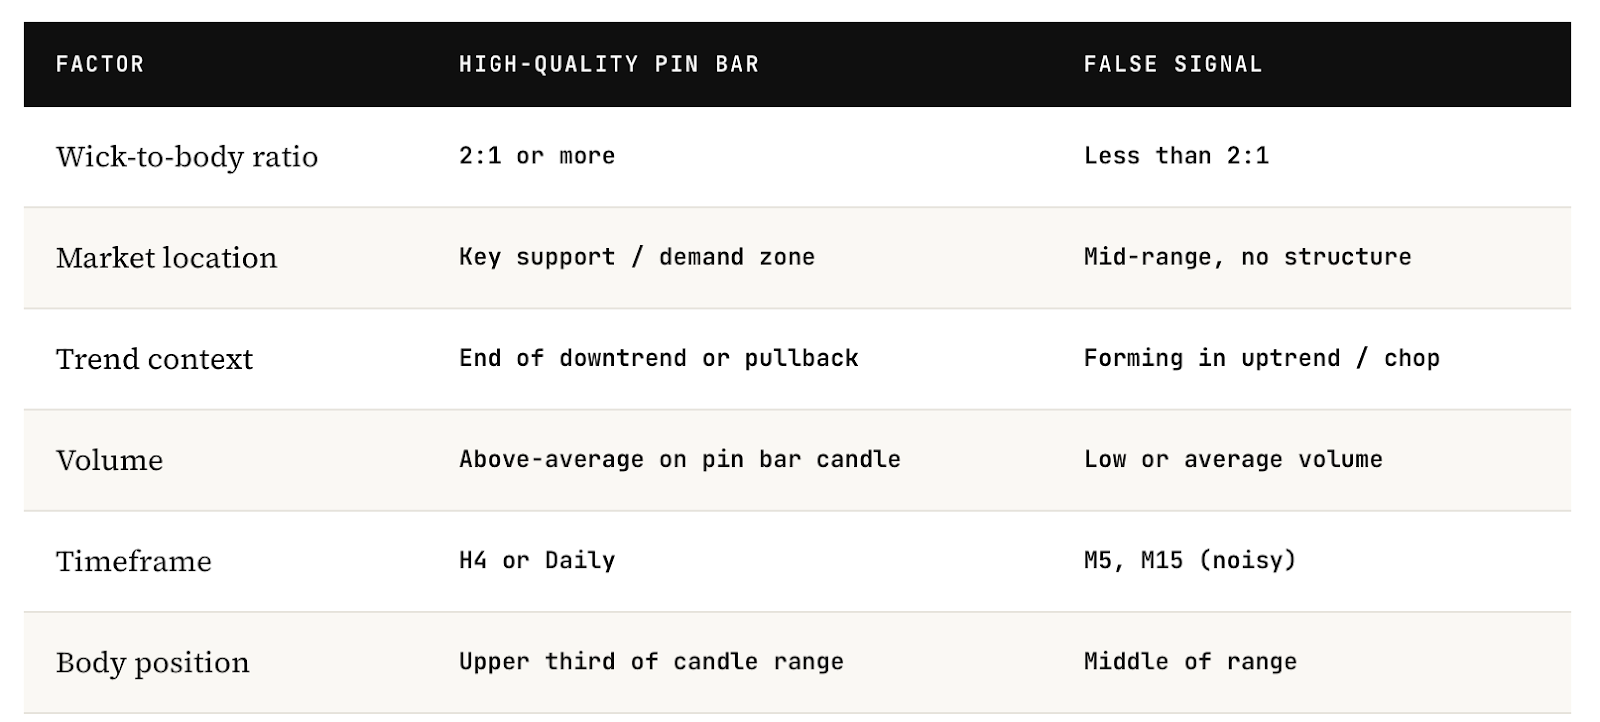
When there is a lot of volatility in news events, they can produce a long wick candle that appears to be a pin bar; however, the two are not the same. If there was a quick surprise announcement that caused the price to go through an area of interest and then tick sideways without much clean price action within that zone, then that isn't a valid setup. So, context matters.
Practical Execution: How to Enter, Set Stops, and Manage Risk
You've identified a valid setup, now what? Here's how to actually execute a trade.
Three Entry Methods
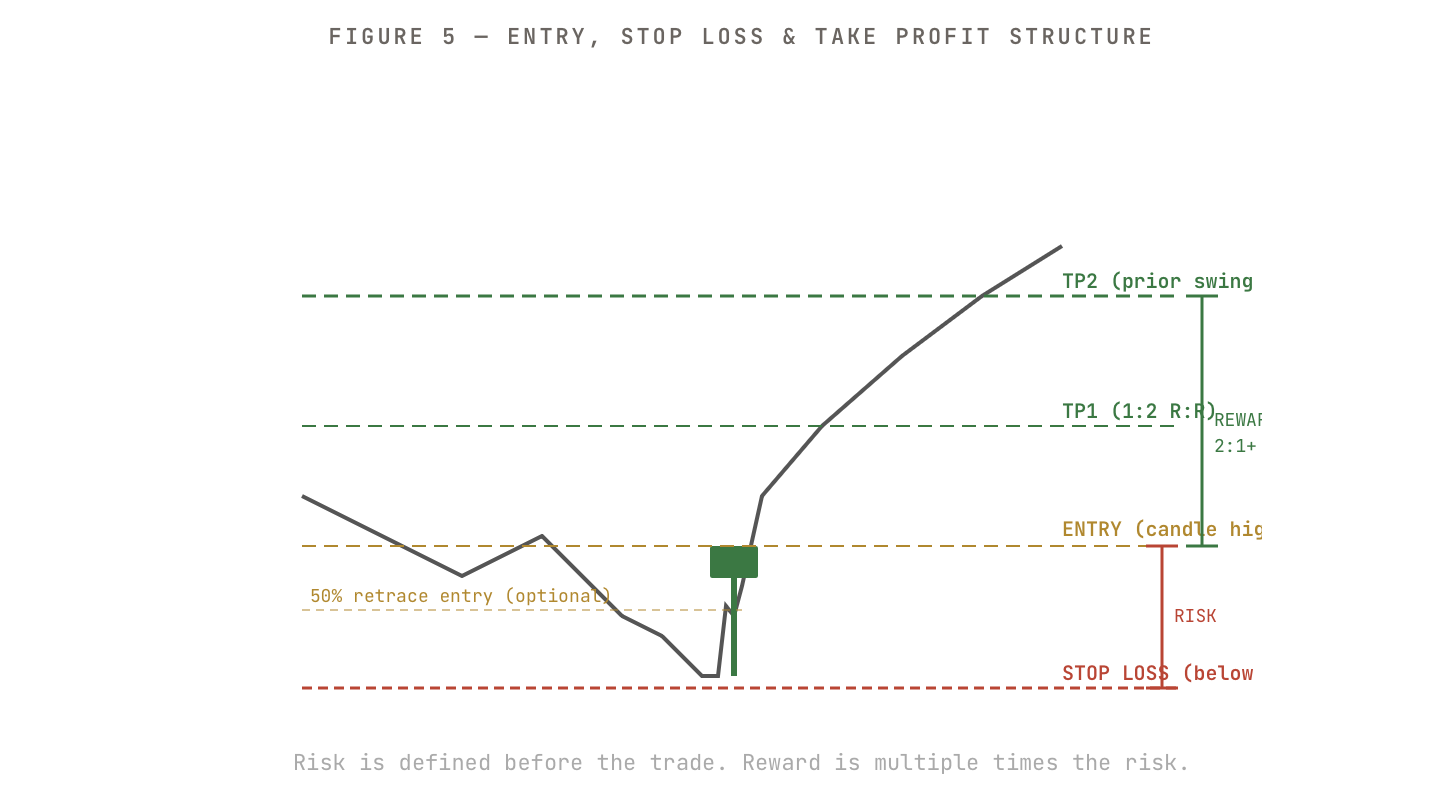
There are 3 ways to enter trades based on pin bars; First, the aggressive method is to buy or sell right after the pin bar candle closes. This provides an entry at the best price possible, but also means that you entered before there is any confirmation.
Second, wait for the price to retrace back to the 50% level of the pin bar wick after the pin bar candle closed. This is a more conservative method as it allows for a better risk/reward ratio; however, some setups go without retracing back to the 50%.
Third, wait for the price to break above the pin bar's high on the next candle. Out of all three methods, the 50% retracement and breaking the candle's high are the methods that offer the best combination of confirmation vs entry points for most traders.
Stop Loss Location
Place a stop loss below the low of the wick, give yourself an extra 10-15 pip buffer, or an appropriate buffer based on the market in which you are trading, so that you will not get stopped out due to spread fluctuations. The stop loss should never be placed at the exact low of the wick. This is where most traders put their stops, and, therefore, the market is aware of the stops as well.
Take Profit Levels
Your take profit should first be set at the last swing high. The minimum risk/reward ratio should be at least 1 to 2. If the pin bar setup has strong confluence and is reversing cleanly, then you can consider part of your position closed out at 1:2 and continue to run the remainder at the next major structure level.
Trading Gold and the DJIA with Bullish Pin Bars in 2026
In 2026, Gold and the DJIA are both creating lots of volatility due to a number of macroeconomic factors – CPI reports, interest rates, and geopolitical events – resulting in consolidation breakouts and retracements, creating pin bar opportunities on both daily and weekly charts.
Gold (XAUUSD) tends to break through demand zone levels during risk-off events before having strong reversals as traders return to safe-haven assets. Such price actions create pin bars on the daily chart that have a high probability of retesting back towards their longer-term upward trend structure, as illustrated on the weekly chart. If you are currently active in gold trading, then the daily chart will be your primary resource to develop bullish pin bars for upside trading opportunities.
The DJIA and other blue-chip indices also tend to correct sharply after earnings disappointments or Fed announcements before climbing back into consolidation zones as institutional buying at technical support levels resumes. A bullish pin bar on the DJIA after a 3 to 5 day sell-off into an area of previous consolidation is an excellent opportunity for taking a long position on the DJIA and should be closely monitored in the current market environment.
Using the Trader Dynamic Index (TDI)
One of the cleanest momentum indicators to combine with pin bar trades is the Trader Dynamic Index (TDI). When a bullish pin bar forms, and the TDI's green line hooks up from an oversold condition, then you have multiple confluences of price structure and momentum acting in your favour.
The TDI is a clear indication of a change in momentum and not just a level reached by the price. A change in both price action and momentum would be a solid buy signal versus each one alone. If a pin bar occurs, and there is no change in momentum on the TDI, wait for the next candle before entering the trade.
Frequently Asked Questions About Bullish Pin Bars
What is a bullish pin bar?
It's a single candlestick with a long lower wick, a small body near the top, and a close well above the session low. It signals strong rejection of lower prices and often marks the beginning of a bullish reversal at key support levels.
How reliable is a bullish pin bar?
On its own, it's a directional signal, not a guarantee. Reliability improves significantly when the pattern forms at a meaningful support level, aligns with a higher-timeframe trend direction, and is confirmed by volume or a momentum indicator like TDI.
What timeframe works best?
Daily and H4 charts produce the cleanest, most reliable signals. Lower timeframes generate too many random wicks that look like pin bars but carry no real significance.
Can bullish pin bars be used in crypto trading?
Absolutely. Crypto markets are highly technical and respect key levels well, especially on Bitcoin and Ethereum. The pattern works just as well as it does in Forex, though stop placement needs to account for crypto's wider spread and volatility.
What's the difference between a pin bar and a hammer?
They're visually similar. The hammer is a specific term used in traditional Japanese candlestick analysis, while pin bar is a Western term popularised by price action traders. The hammer has stricter body-to-wick requirements in some interpretations. For practical purposes, they refer to the same type of reversal candle.
How do you avoid false signals?
Check the wick-to-body ratio (needs to be at least 2:1), confirm the pattern is at a meaningful support level, check volume, and make sure the broader trend context supports a reversal. If any of these are missing, it's best to skip the trade.
Should bullish pin bars be used alone?
No. A pin bar is a signal, not a system. It should be combined with location analysis, confluence factors, and proper risk management to function as a complete trading approach.
How do institutions use this pattern?
Institutions don't "use" the pattern the way retail traders do. They create it. When they execute large buy orders after sweeping liquidity below a support level, the resulting price action leaves a long lower wick. The pin bar is the trace of their activity, and that's exactly why it's worth following.
Ready to Trade the Bullish Pin Bar with Confidence?
Explore TradeWill's full pattern library, risk frameworks, and live market analysis to sharpen every edge of your strategy.
Disclaimer: The content of the blog does not represent any position of Trade W, does not serve as any trading-related decision advice, and does not endorse any third-party.