

 Trade W
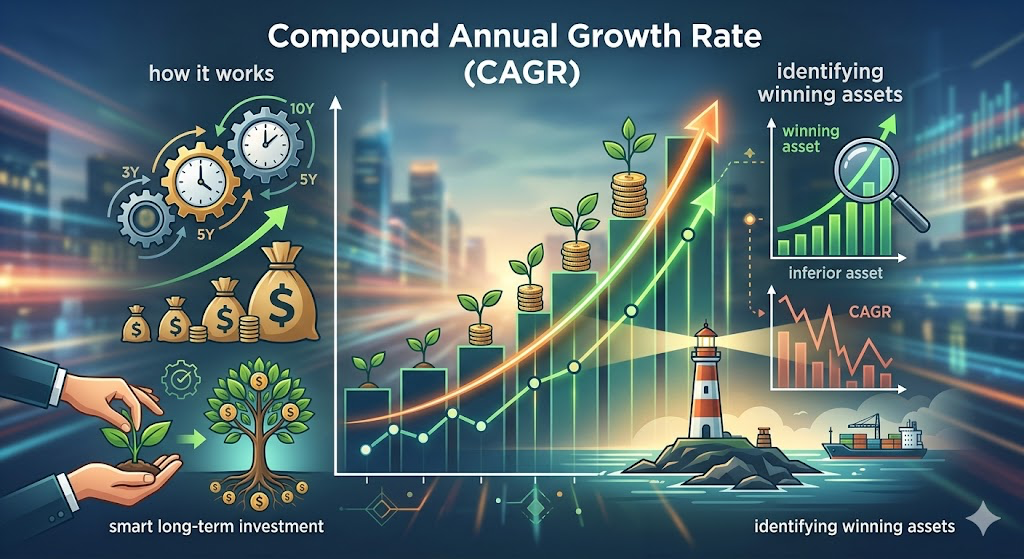
Have you ever experienced the phenomenon where an asset has jumped by 80% in one year, then dropped by 40% in another year? It's easy for an investor to feel that the price is "always going up," but the actual value of your investment account tells a much different story. This explains why professional managers look at 10-year performances instead of quarterly results. The answer lies in one metric - CAGR or "Compound Annual Growth Rate."
CAGR is the most significant measurement when judging the performance of an investment over time. It smooths out the volatility of annual price movements, accounts for compounding, and produces a single, straightforward metric that is easily and comparably assessed.
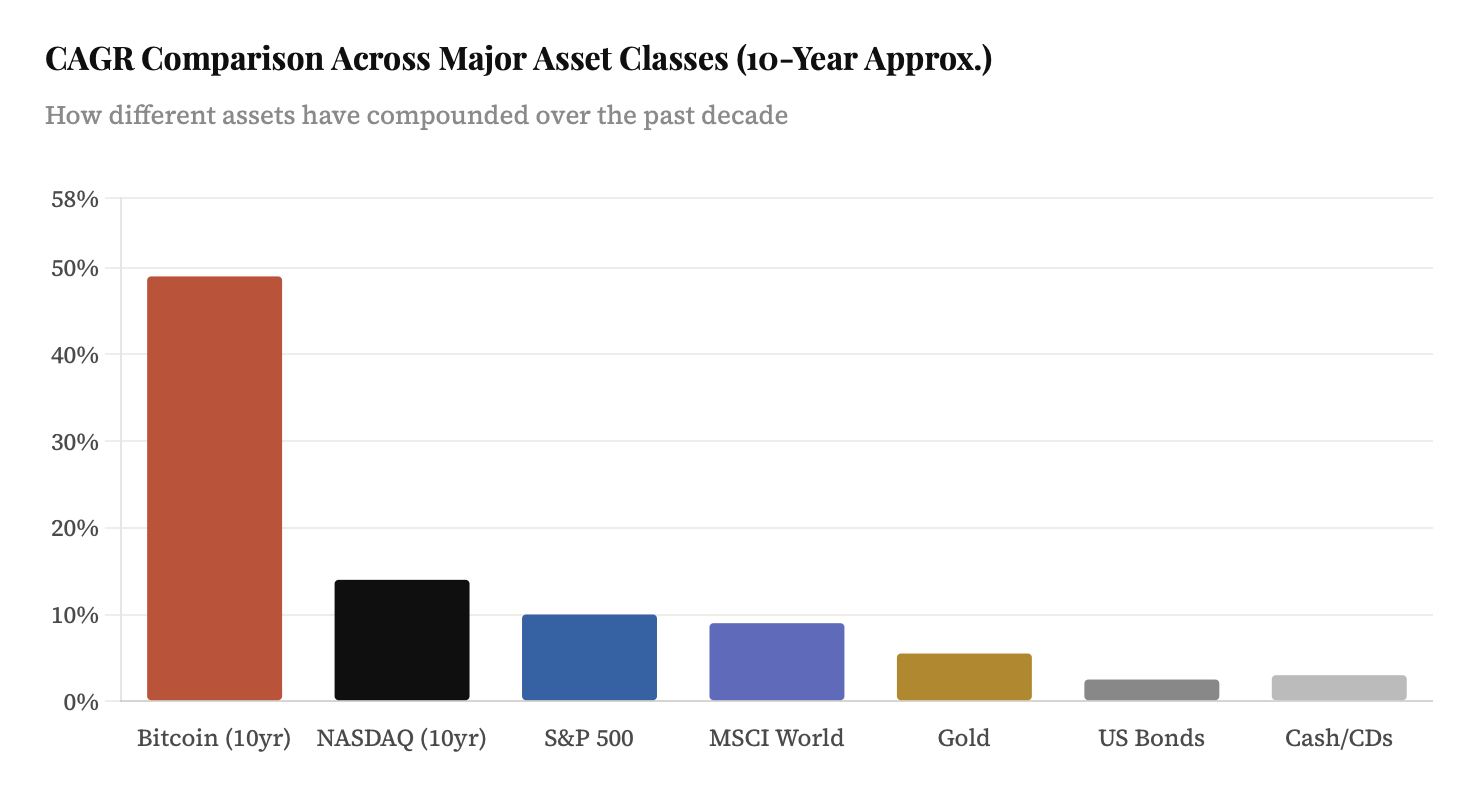
On a long-term basis, the CAGR of the S&P 500 is around 10%. By contrast, Bitcoin has surpassed every asset class and created remarkable CAGRs in the past ten years. The difference between being an investor who makes informed decisions and one who is fooled by headlines is knowing what these metrics represent and how to use them.
This guide will explain what CAGR is, how to calculate CAGR, how to screen stocks and ETFs using CAGR, and show you that even the best measurement has some limitations.
What Does CAGR Actually Mean?
The Compound Annual Growth Rate, known as CAGR, is the average yearly growth that an investment will grow by over time if it moves at a consistent rate every year until it reaches a certain value at the end of the period. This is like smoothing out the ups and downs of an asset's growth trend.
Most assets do not grow evenly over time; for example, a stock may go up 40% one year and go down 20% in the following year, so if you were to simply average the two returns together (40 + -20 = 20, and then divide by 2 to get 10% average return for the 2 years), your overall return will not be 10% per year but instead, your actual return will be greater than 10%. CAGR takes into account all compounding returns from when you purchase an asset to when you sell an asset and shows you what that compounded rate is for an investment over time.
"CAGR doesn't care how bumpy the ride was. It only asks: where did you start, where did you finish, and how long did it take?"
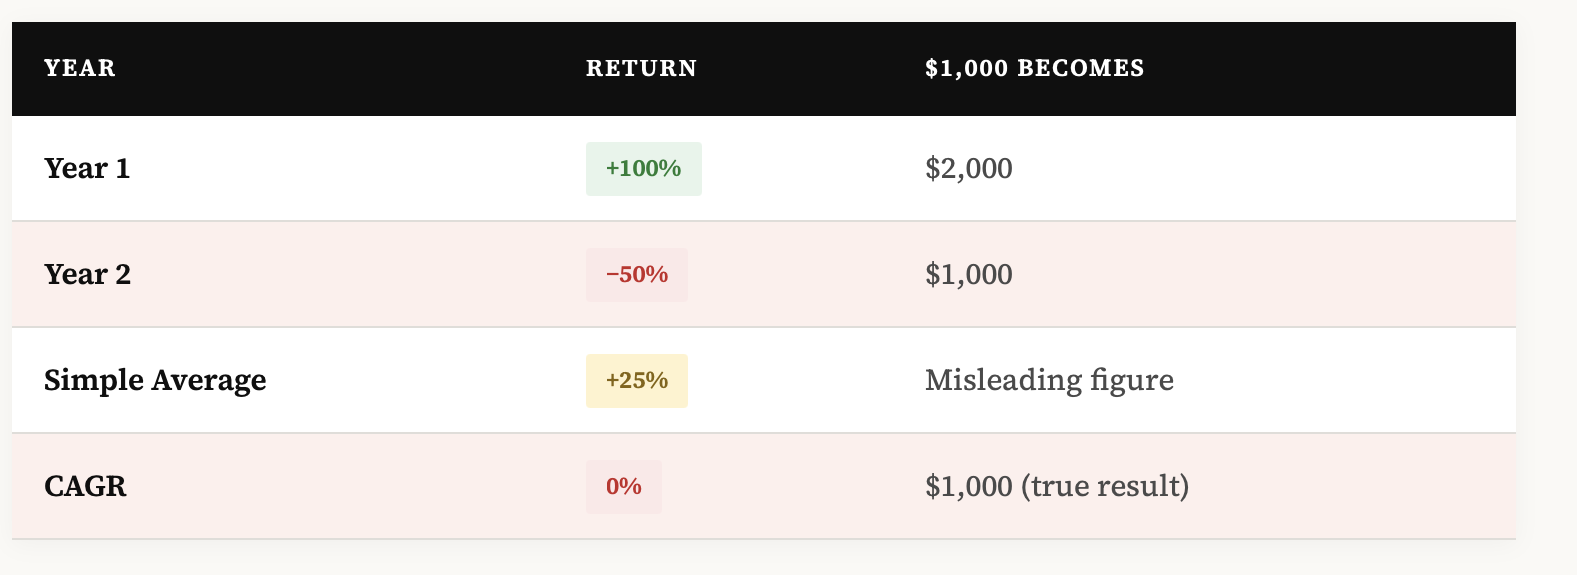
Let’s see how this example shows us a 100% gain for the first year, followed by a 50% loss in the second year, which results in an average return of 25% and therefore gives you a lot of confidence. However, at the end of the two years, you are back to where you started. This situation illustrates how the CAGR is meant to highlight the gap between your perceived and actual returns.
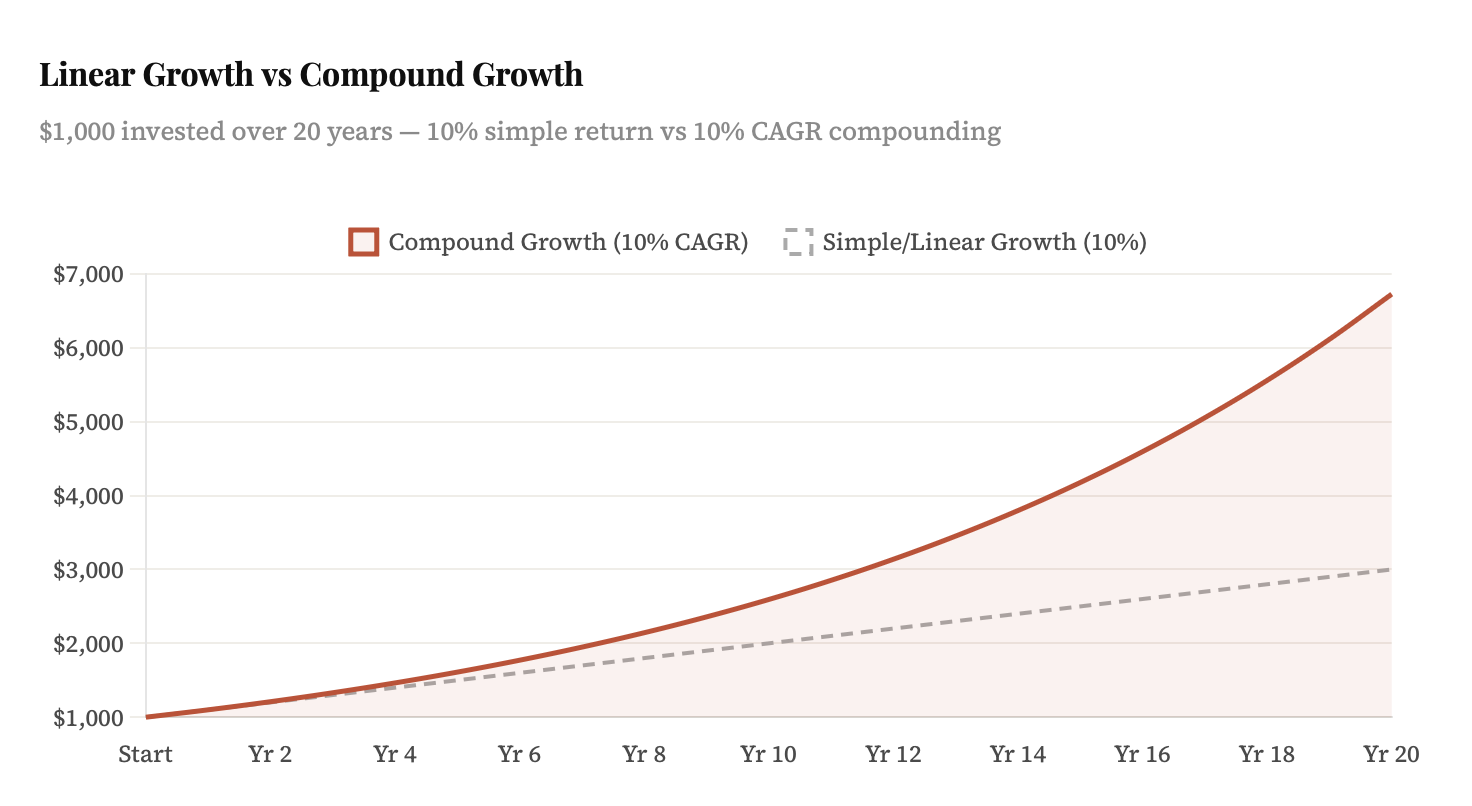
Investing $1000 compounds at an authentic 10% CAGR would yield an approximate $2593 after 10 years of compounding. The compounding engine is referred to as CAGR, which is the best method for measuring compounding.
The CAGR Formula and How to Use It
The math isn't complicated. You need three things: your starting value, your ending value, and the number of years between them.
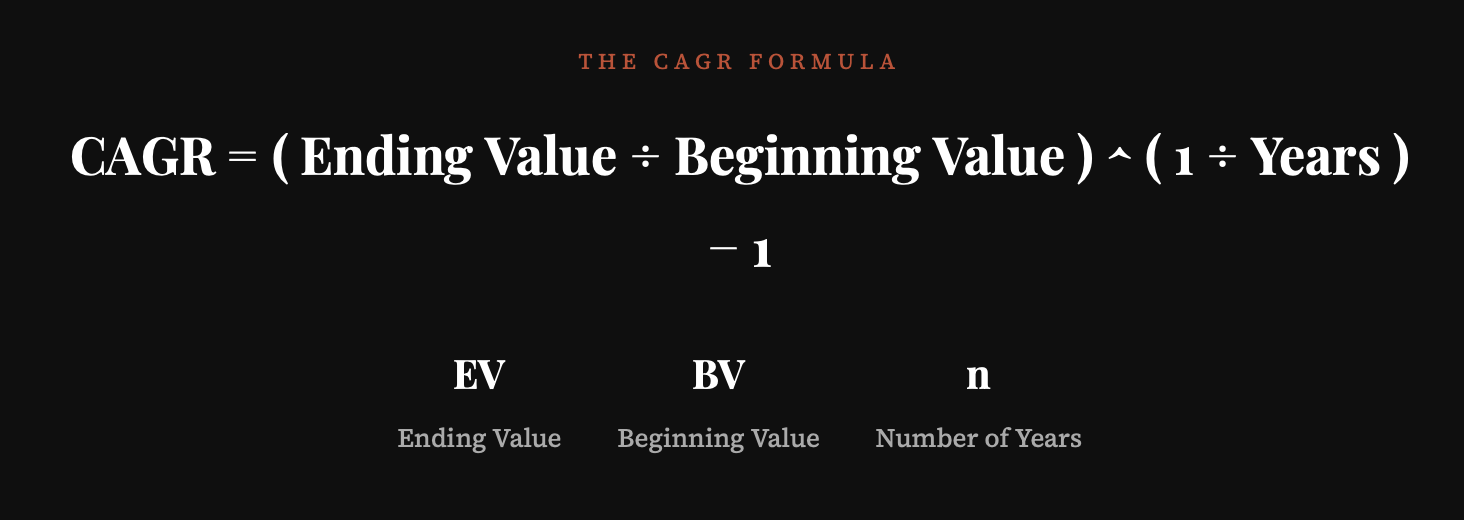
For instance, if you put $1,000 into an investment that becomes worth $2,000 after five years, this means that: (2000 ÷ 1000) ^ (1 ÷ 5) − 1 = 14.87% CAGR, which represents your actual compounded rate of return over five years, without being inflated by averaging.
Quick Practice: Sneakers as an Investment
Five years after purchasing a limited-edition sneaker for $200, you could have sold it for $600 using the following formula: (600 ÷ 200) ^ (1 ÷ 5)-1 = 24.57% compounded annually. This represents a higher compound annual growth rate than many five-year periods in which you held an S&P 500 investment. Not bad for a pair of shoes.
From 2013 until 2023, the NASDAQ Composite Index has had an approximate compound annual growth rate of 14%. This figure captures an entire decade of bull markets, bear markets, as well as the coronavirus pandemic, with one simple and easily comparable annualised rate of return.
Why Long-Term Investors Focus on 10-Year CAGR
Short-term fluctuations will generally serve as noise. A stock may increase in value 60% from a meme, only to give the 60% back within three months. All that is needed is one surprise from quarterly earnings, one Federal Reserve announcement, one Viral Twitter post, and the charts will look radically different. None of these data points will tell you if any business is actually compounding shareholder value over the long-term.
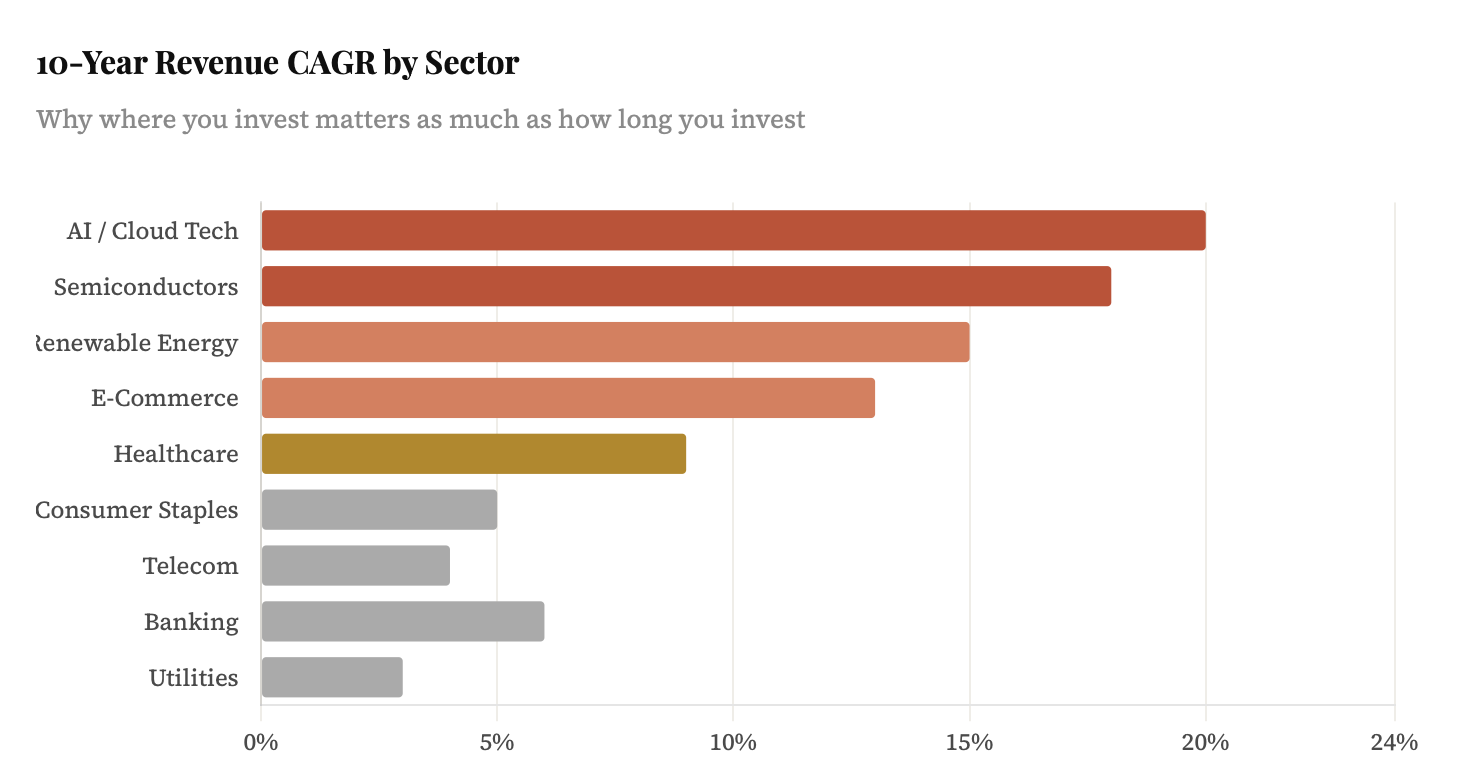
Ten years will give enough of a time frame to see through luck. If a company has a 15% CAGR in revenue over ten years, they won't be doing it by luck. They will have pricing power, a competitive advantage in their market, and skilled capital allocators. That's what institutional investors will be looking for when they evaluate a long-term CAGR of 10% or greater.
Let’s put it like this: A student scoring 95% only once is impressive, while a student with a 10-year average of a 92% in every subject is truly exceptional. It’s the consistency over a long period of time that’s most telling, and it’s exactly that consistency that’s represented by the 10-Year CAGR.
Revenue CAGR vs Net Income CAGR: Reading Between the Lines
Evaluating only the revenue growth of a business is comparable to assessing a restaurant by the number of patrons seated at the table. You also need to know whether the company is making money. That is the reason why serious investors monitor both revenue and net income CAGR.
If revenue increases rapidly while earnings do not, there is a problem. The firm may be spending too much money to attract customers, or its cost of goods sold may be exceeding its sales. In either event, it can be viewed as a yellow flag. The truly interesting companies will have the growth rates of revenues and earnings increasing together, or ideally, will have earnings expanding at a faster rate than revenue as margins increase with scale.
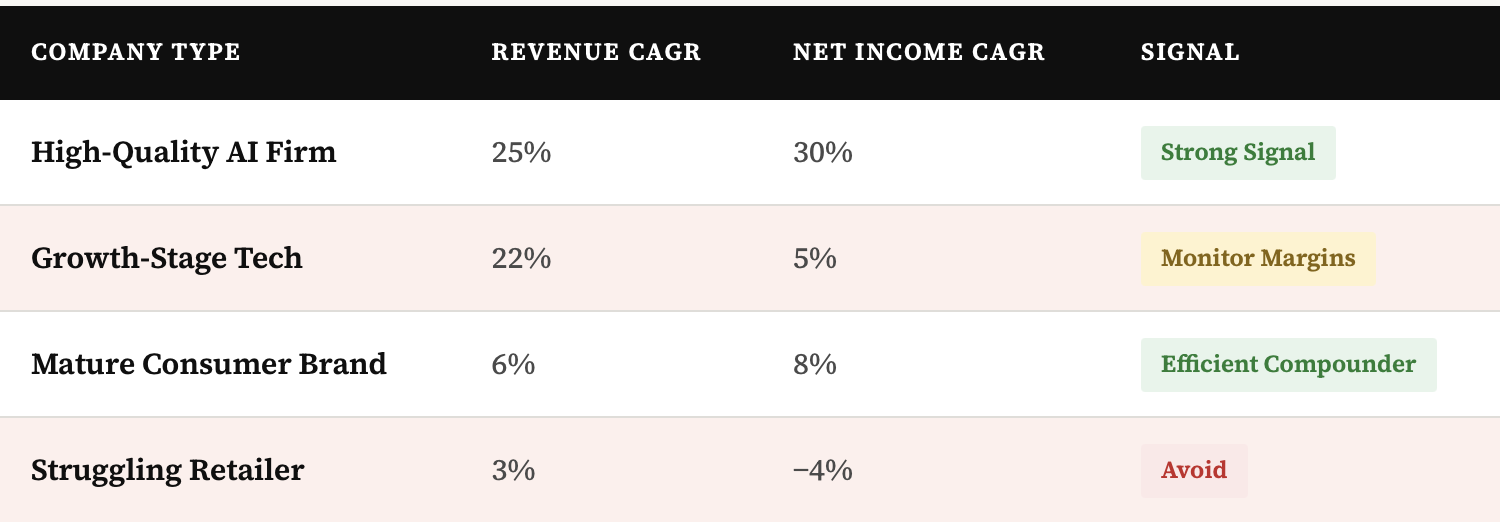
A coffee chain opening 50 new stores every year but seeing profits drop at each location every quarter is not truly a growing entity; it is an eroding entity. Good companies will maintain their revenue CAGR and net income CAGR close together, or even grow their net income faster than revenue as they develop leverage from operations.
Industry Benchmarks: What's Actually a Good CAGR?
The context of this situation is critical. For a utility company to have a 6% CAGR is very good. On the other hand, this would disappoint an entity in the software industry. An inappropriate comparison of CAGR between industries would be to compare the pace of a runner in a marathon to that of one in a sprint and identify one as slow.
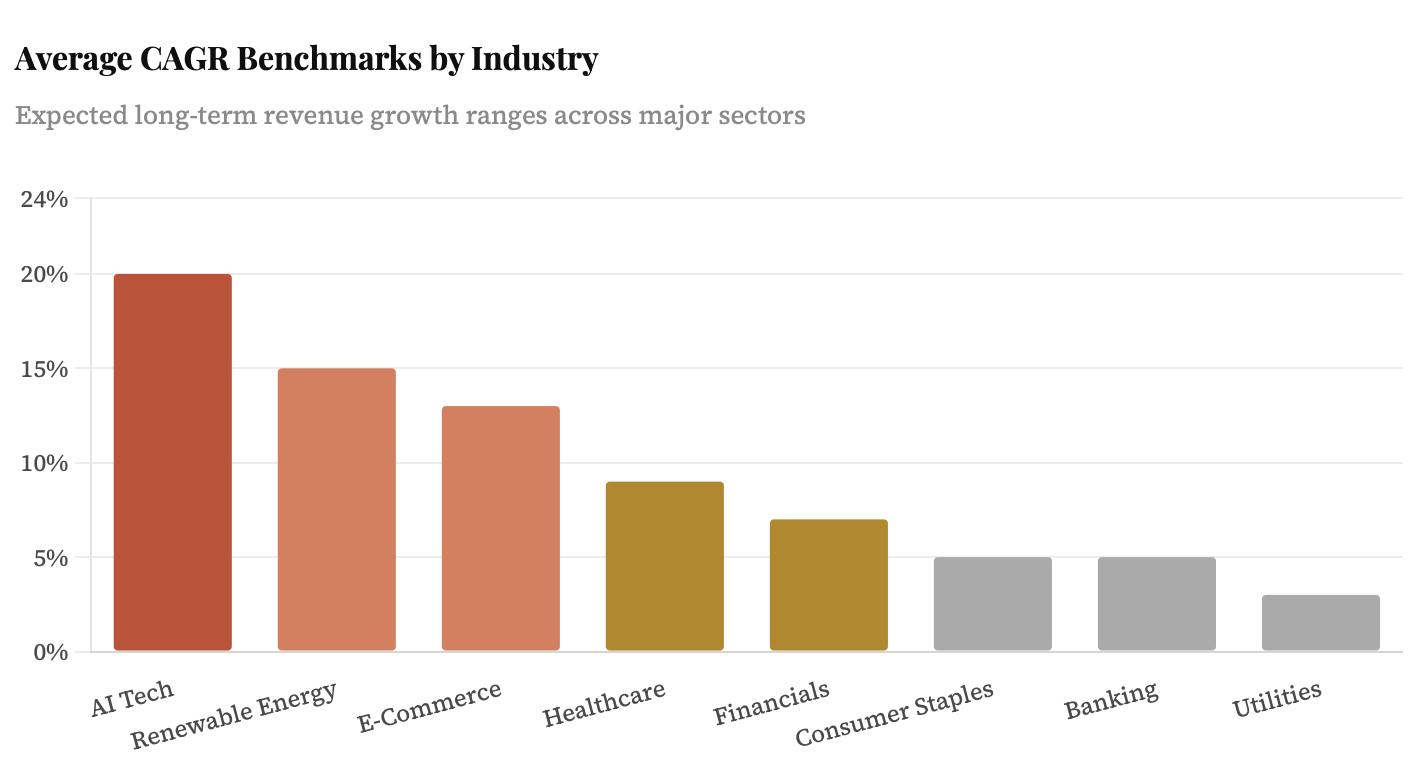
AI and cloud infrastructure firms are growing at more than 20 per cent compound annual growth rates due to the continued rapid rate of adoption. Renewable energy is expanding at a rate of 12–18 per cent as the global shift to renewable energy progresses. Traditional banks and consumer staples have stable returns in the four to eight per cent range, but offer dividends and less risk. The average for your industry is going to be a better comparison than the market overall.
DuPont Analysis: Why High ROE Supports High CAGR
Return on Equity (ROE) gives investors insight into how profitable a company’s operations are based on capital invested by shareholders. The DuPont analysis splits this return into three categories: profit margin, asset turnover and financial leverage.
The use of this analysis is attractive because there is almost always a very high correlation between very strong CAGR companies and those same companies exhibiting extremely high ROE according to the results of their DuPont analysis.
An example of this is Apple, which has had an ROE of more than 100% for several years as a result of its tremendous profit margins and its enormous share repurchase program. Because the company has demonstrated this level of capital efficiency, its long-term compound annual growth rate of stock price has benefited. A company that is using excess assets to generate relatively low profit margins will not be able to maintain these same growth rates over the period of the next decade.

There is a tale to tell through each item. On the first dimension, high-margin businesses such as high-end goods and software companies are leaders. On the second dimension, retailers with a high turnover of inventory take first place. Highly leveraged financials greatly amplify third place. The strongest compounders are successful in both margins and turnover, and do so without having to rely predominantly on debt.
Using CAGR Across Stocks, ETFs, and Crypto
CAGR isn't tied to any one asset class. It works wherever you have a starting value, an ending value, and a time period, making it one of the most versatile tools an investor has.
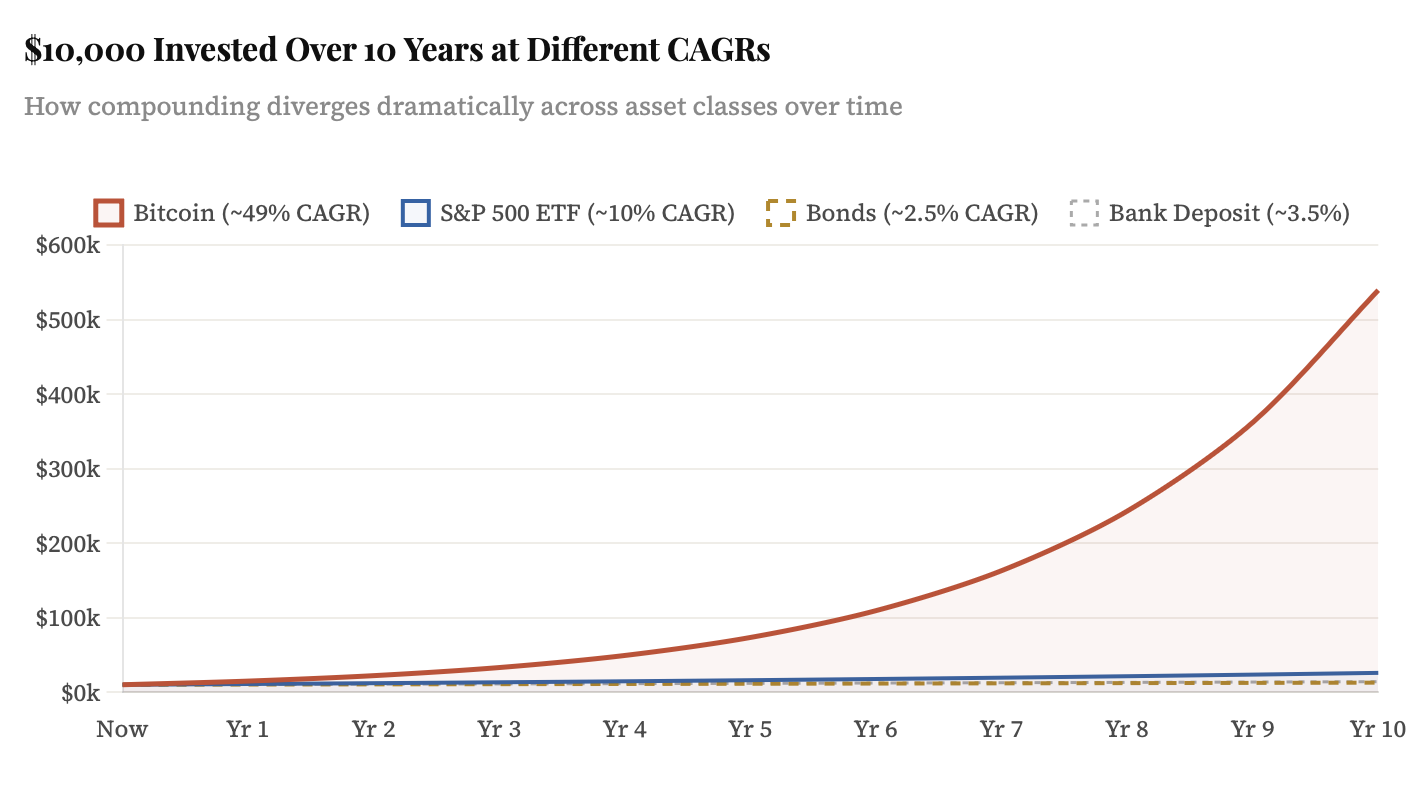
A company’s historical growth rate can be evaluated against a peer group using compound annual growth rate (CAGR). Comparing how well an index-based ETF has performed as compared to an active money manager will be based on CAGR. In crypto, where there is so much volatility, CAGR will be the best measure of long-term value since the volatility from year to year renders any other form of measuring meaningless.
Bank deposits, which earn from 3% to 4% annually, will not compound like investments. In ten years, a $10,000 deposit at 4% would be worth about $14,800, whereas a $10,000 investment in the S&P 500 over the same time period would yield about $25,937 due to the average historical CAGR of 10%. The difference gets even larger the longer you remain invested.
The Limitations of CAGR:
The single biggest weakness of CAGR is that it is completely silent about the journey. Two investments can both have completed the same length of time with the same CAGR, but have had opposite journeys to get there. One of them could have increased steadily throughout the ten years.
The other one could have actually decreased by 60% in the 3rd year and then experienced a big jump in value by the 7th year. They would have produced the same total value, but certainly had very different experiences in their journey to achieve it.
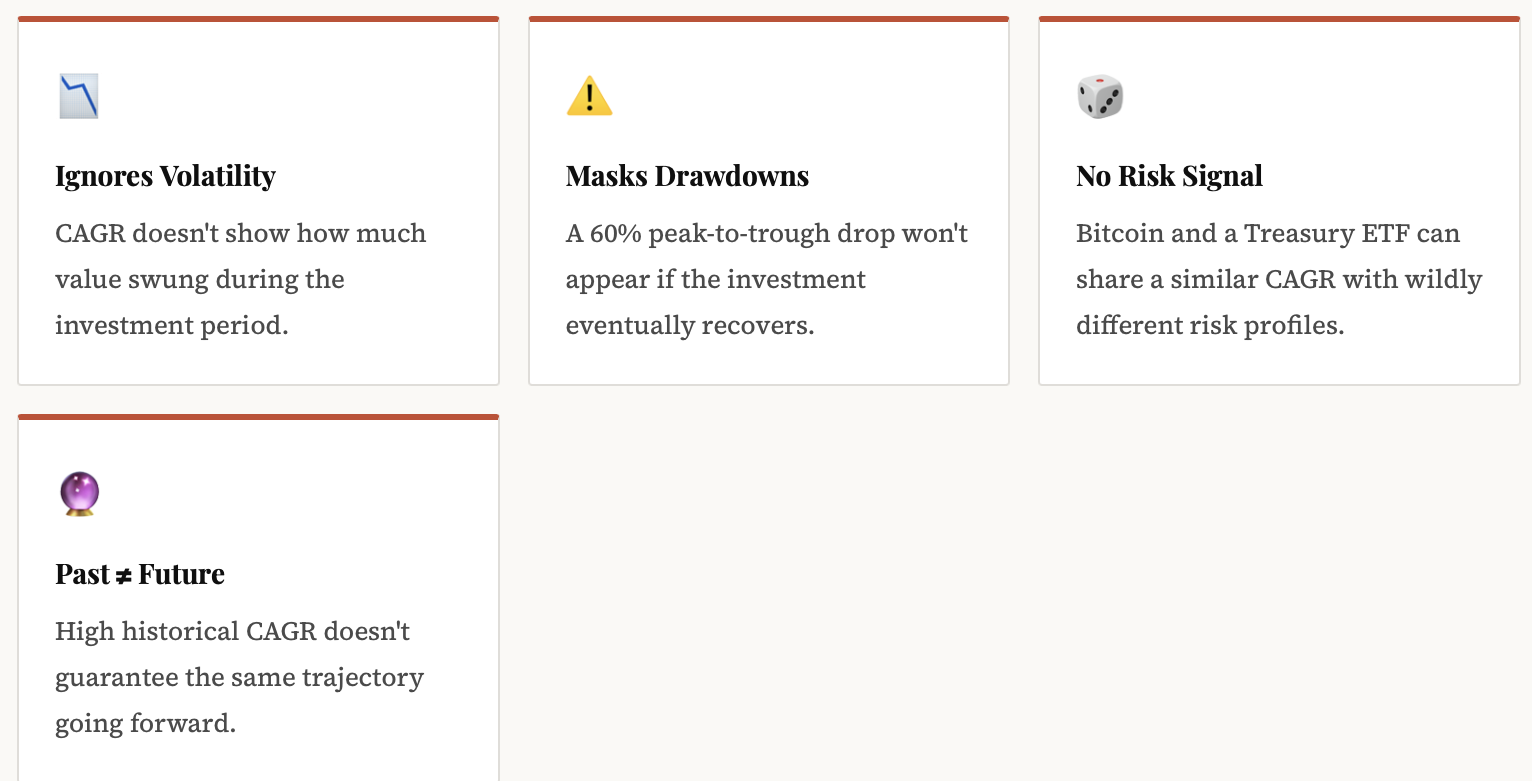
The solution is using compound annual growth rate (CAGR) in conjunction with two other complementary metrics. The Sharpe Ratio allows for an adjustment of risk return, and maximum drawdown provides information regarding the worst peak to trough loss; when you combine these three metrics (CAGR, Sharpe Ratio and Maximum Drawdown), you will have a better representation or complete picture of what it is actually like to hold this investment.
Practical Stock Screening: Finding Blue-Chips with 10-Year CAGR
The common traits of top-performing long-term compounders are a history of compound annual growth rates (CAGR) of revenue and profits of over 10%, exceptional return on equity (ROE), and clear leadership within their sector. You can screen for these companies using this simple 4-step process through any platform with fundamental data.
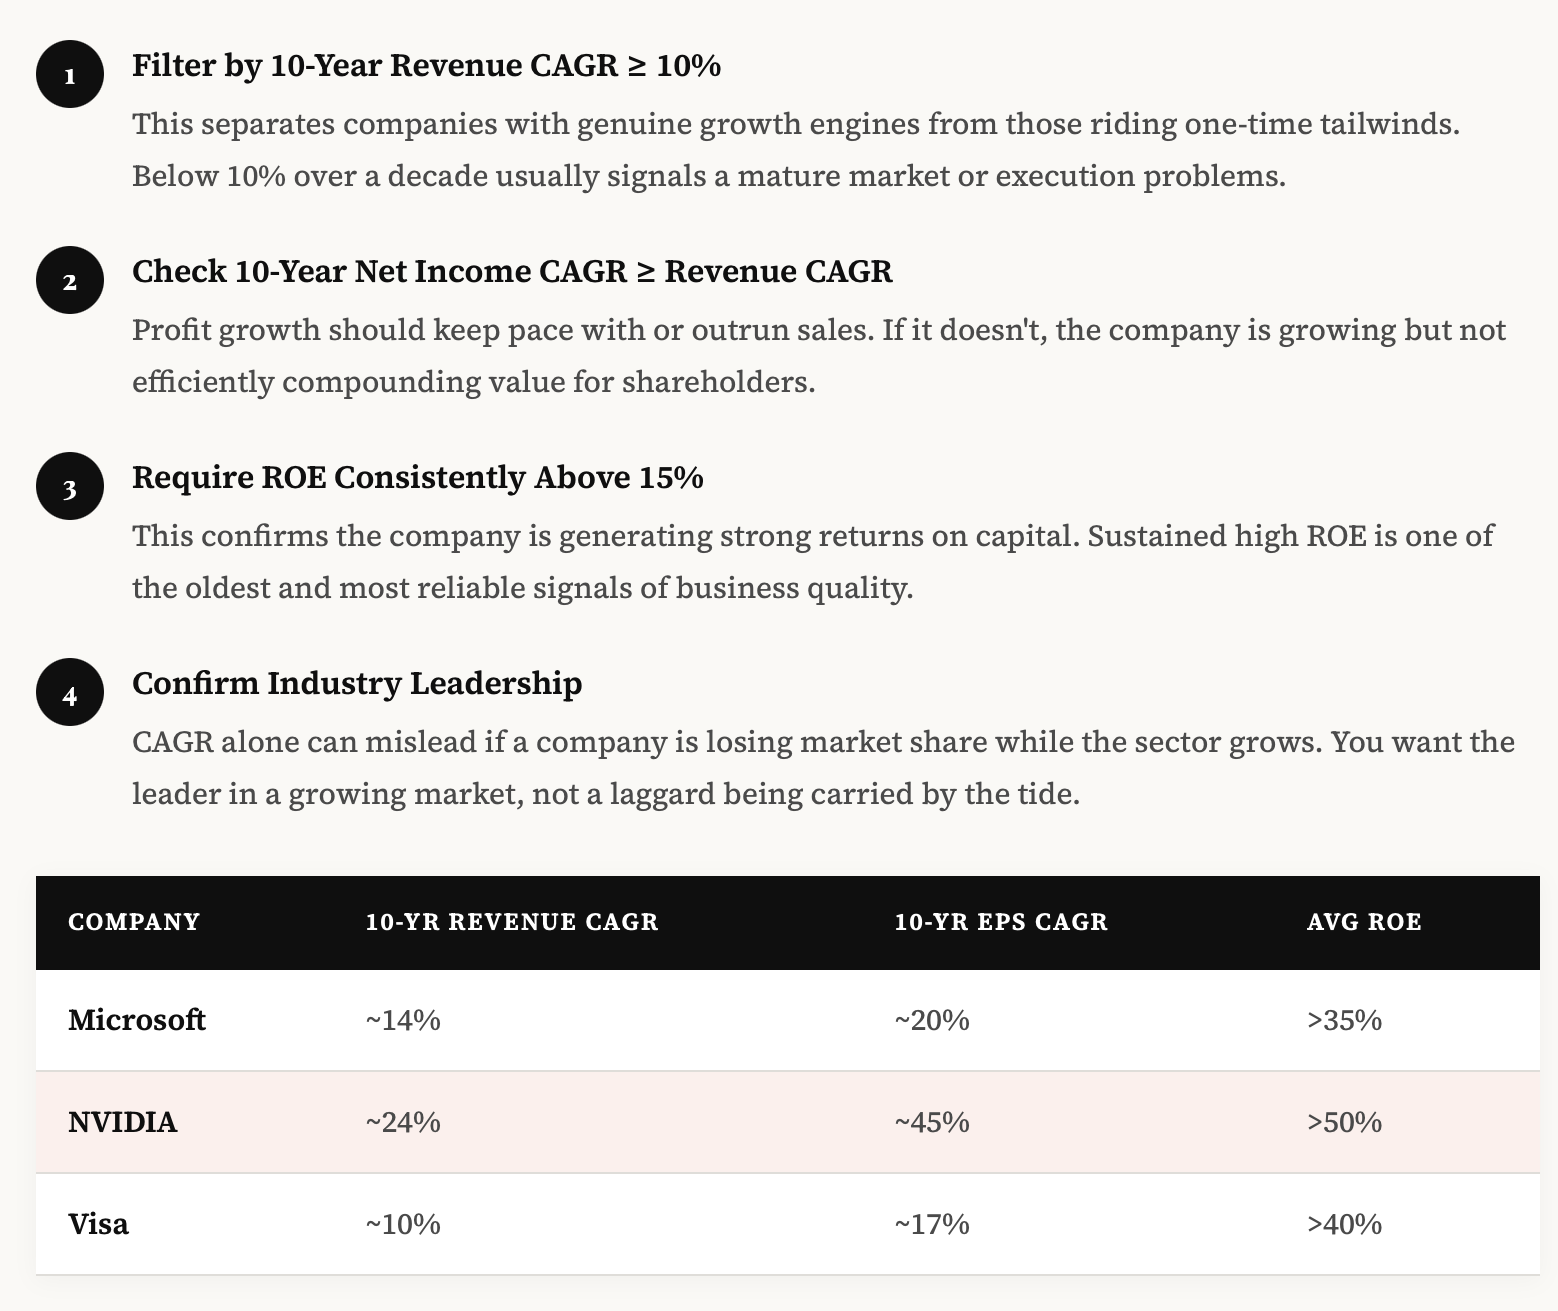
All three firms exhibit net income Compound Annual Growth Rates (CAGRs), which are substantially greater than their revenue CAGRs, and are the catalysts for expanding margins. As these companies became larger, the expense of producing each incremental revenue dollar decreased. The increase in efficiency directly impacts the firm's bottom line, providing shareholders with a compounded return on investment annually.
Putting It to Work on Tradewill
Using CAGR to make a smart investment decision is important in any market. It does not matter if it's stocks, cryptocurrencies or contracts on futures - the ability to determine what an investment's CAGR is can help with making smart financial decisions.
You can access Trade Will's data and use it for making long-term investment decisions based on history through its platform. You can easily determine how much a particular asset has increased over time and then compare it to a sector benchmark or another investment.
Regardless of whether you are trying to determine if a technology company's 10-year CAGR supports the company’s current price and is a good investment or if a technology company and Bitcoin have the same long-term compound rate of growth as a diversified equity ETF, using Trade Will’s ability to access financial data quickly and accurately will help you obtain the necessary information needed to make rational investment decisions rather than intuitive decision.
Tradewill gives you the CAGR-driven analytics to identify stocks, ETFs, and crypto that genuinely compound, so your portfolio reflects research, not hope. Visit Tradewill.com.
Disclaimer: The content of the blog does not represent any position of Trade W, does not serve as any trading-related decision advice, and does not endorse any third-party.