
 Trade W
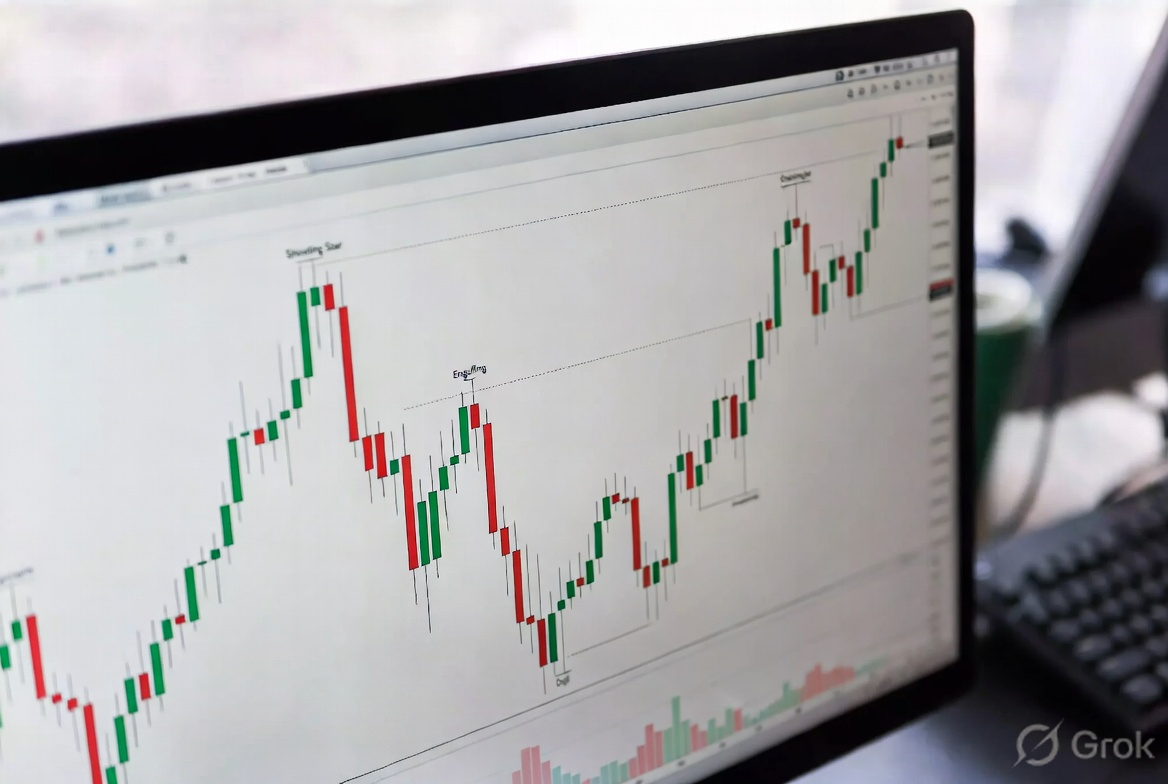
Markets do not change direction without making some noise first! Candlestick charts provide traders from all markets, including crypto, forex and CFD, with a tool that has been used for many decades to identify potential reversals on price charts. This guide will explain the meaning of these candlestick patterns, how to identify the formation of a reversal, and how to use these formations in real-world trade setups without the noise.
What Are Candlestick Reversal Patterns?
Reversal patterns of candlesticks are structures that form on charts from one or more candlesticks that indicate a possible change in direction of the financial market. Bullish reversal patterns form at the bottom of a downward trend, indicating that buyers are gaining control; on the other hand, bearish reversal patterns form at the top of an upward trend, indicating that sellers are beginning to take over.
One rule regarding all of them is that the signal is worthless without an accompanying confirmation.
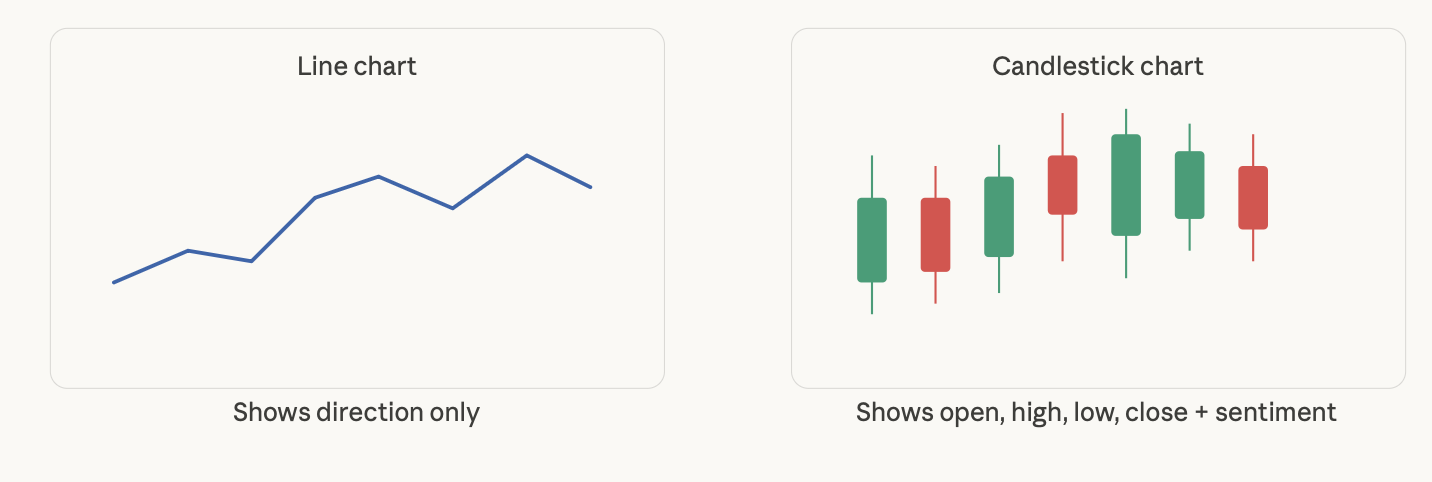
The Market Psychology Behind These Patterns
Every candlestick pattern represents a conflict between buyers and sellers. When that conflict becomes one-sided, the potential for a reversal is created.
You can think of it as a tug-of-war, with the price being pulled up by buyers and pushed down by sellers. Most of the time, the two sides are balanced; however, at certain price levels, one side will become exhausted, and the other will take control very quickly. This is what is happening when a reversal pattern is forming.
For example, in 2021, bitcoin reached its All-Time High after a strong upward trend, but then buying pressure decreased and volume decreased near the All-Time High as long wicks developed, showing sellers were rejecting higher prices. Within a matter of weeks, the trend had reversed. The candle patterns were telling the story long before the news was published about the reversal trend.
The most important point to remember is that price is a reflection of our emotions. Candlestick shapes reflect fear, greed, exhaustion and conviction long before they appear on the headlines.
How Candlestick Reversal Patterns Form
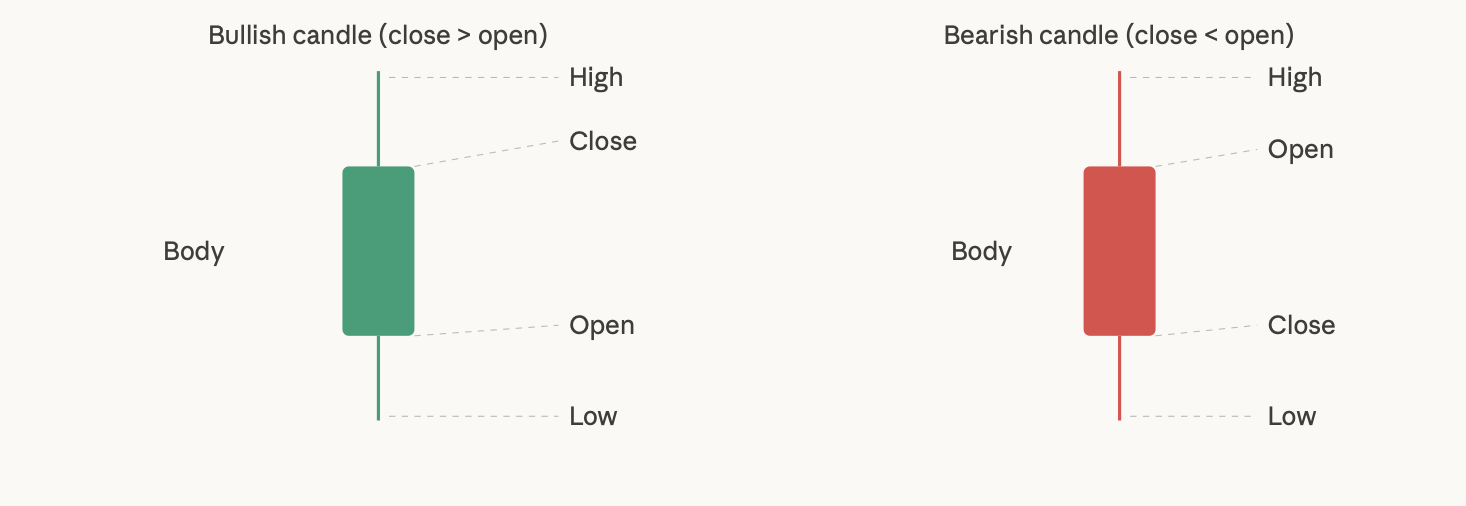
The four points represented by each candle are the open price, high price, low price, and close price. The body represents the difference between the open price and the closing price, while the wicks represent how far the price has gone past that range before being rejected.
A long upper wick at a resistance point indicates that buyers attempted to push prices higher but were forced back down, while a long lower wick at a support point indicates that sellers attempted to push prices lower but were ultimately unable to maintain this downward pressure. An engulfing candle occurs when one side of the market completely overpowers the other side during one trading session.
The 3-Step Confirmation Strategy
Traders often make losses on reversal patterns by getting in too early. There are three things you need to see to confirm a reversal pattern.
1. Trend Context - A reversal pattern only works within the context of a trend. A hammer at the end of a three-week downtrend is very relevant. A hammer in the middle of the trend is just random.
2. Pattern Structure - Does the reversal pattern look good? For example, to confirm that there is a hammer, there must be a long lower wick, a small body near the top, and little to no upper wick. If there are multiple patterns all huddled together, it makes the structure weak as well.
3. Confirmation Candle - The next candle will show whether or not the pattern is confirmed. For a bullish reversal pattern, the next candle must be a solid green candle that closes above the high of the pattern. For a bearish reversal pattern, the next candle must be a solid red candle that closes below the low of the pattern.

The 10 Most Important Candlestick Reversal Patterns
Bullish Patterns
Hammer Candlestick – The Hammer candlestick is characterised by a short body and a long lower shadow of at least two times the length of the body. This candlestick appears after a downtrend in price and signals an increase in buying and thus a rejection of lower prices. The Hammer candlestick is considered most reliable when located at strong support levels. An example of a Hammer candlestick is the March 2020 Low on Bitcoin.
Bullish Engulfing Candlestick – Bullish Engulfing candles consist of large green body candles that completely cover or engulf the body of the previous red candle. They indicate buyers overwhelming sellers within one candlestick session. Bullish Engulfing candles are considered most reliable when located at a strong support level or within a very long downtrend. Bullish Engulfing candles are very common within the EUR/USD currency pair, especially at swing low points.
Morning Star Candlestick – The Morning Star candlestick pattern is a three-candle reversal pattern that consists of a large red candlestick, that is followed by a small candlestick, that is followed by a large green candlestick. The Morning Star pattern represents a change in trend and is one of the most reliable candlestick patterns for swing traders.
Tweezer Bottom Candlestick – The Tweezer Bottom candlestick pattern is made up of two candlesticks that have matching low points within a support zone. The first candlestick is bearish, while the second candlestick is bullish. The price has attempted to break lower on two occasions and has failed to break lower on both occasions. The Tweezer Bottom candlestick pattern should be used as part of a trading strategy in conjunction with an RSI Divergence pattern.
Piercing Line Candlestick – The Piercing Line candlestick pattern consists of a red candlestick, followed by a green candlestick that opens below the low of the red candlestick, but closes above the halfway point of the red candlestick. The Piercing Line candlestick pattern represents aggressive buying during what appeared to be continued selling within two candlestick sessions. The Piercing Line candlestick pattern is typically found in Forex and commodity markets.
Bearish Patterns
Shooting Stars - The shooting star candlestick, similar to the hammer, has a short body at the bottom with a long wick at the top, which indicates sellers aggressively rejecting higher price levels. It can be a strong bearish signal if it occurs after a parabolic move, e.g. Bitcoin over $60,000 in 2021.
Bearish Engulfing- This bearish engulfing candle pattern has a large red candle that engulfs the prior green candle; it's an indication that sellers gained complete price control. This candle pattern has special meaning after prolonged uptrends or at levels of significant resistance.
Evening Star- The Evening Star consists of three candles: a large bullish candle, a small candle with a Doji and closes near the open of the previous candle, and a large bearish candle to show a reversal following an uptrend. The doji candle gap up indicates exhaustion before reversal; many examples of the evening star candlestick pattern occur in gold near major tops.
Tweezer Tops- The tweezer top have two candles with the same high price at resistance; bullish buyers fail to break through this resistance on two occasions. This tweezer top candlestick pattern is often used to signal the beginning of a major pullback during a trend.
Dark Cloud Cover- This candlestick pattern shows a green candle followed by a red candle that opens above the high of the green candle but closes below its midpoint. It has the opposite characteristics of a piercing line pattern and usually occurs at overbought conditions in stocks or cryptos.
Market Structure vs. Reversal Signals
A single pattern cannot tell the entire story; rather, it is more important to know if the pattern has developed at a significant structural price level.
If Bitcoin has broken several lower highs and lower lows, then it is in a downward trend. Therefore, a hammer that has been formed before the structure breaks would only be speculative. However, if the price has broken above the previous lower high and then a hammer appears, this would be considered more likely.
Look for structural cues: an increase in high or lower high after an upward trend will indicate bullish strength; likewise, a decrease in low or a higher low after a downward trend indicates bearish weakness; additionally, look at the nearest swing point to assess whether the price has broken through that level. When these indicators are combined with various reversal patterns, there is a strong likelihood of success in trading.
In short, structure should be considered more important than just the pattern.
Volume Confirmation
Volume is the most overlooked part of reversal pattern analysis. A hammer at support with three times normal volume is a completely different signal from the same hammer on thin volume.
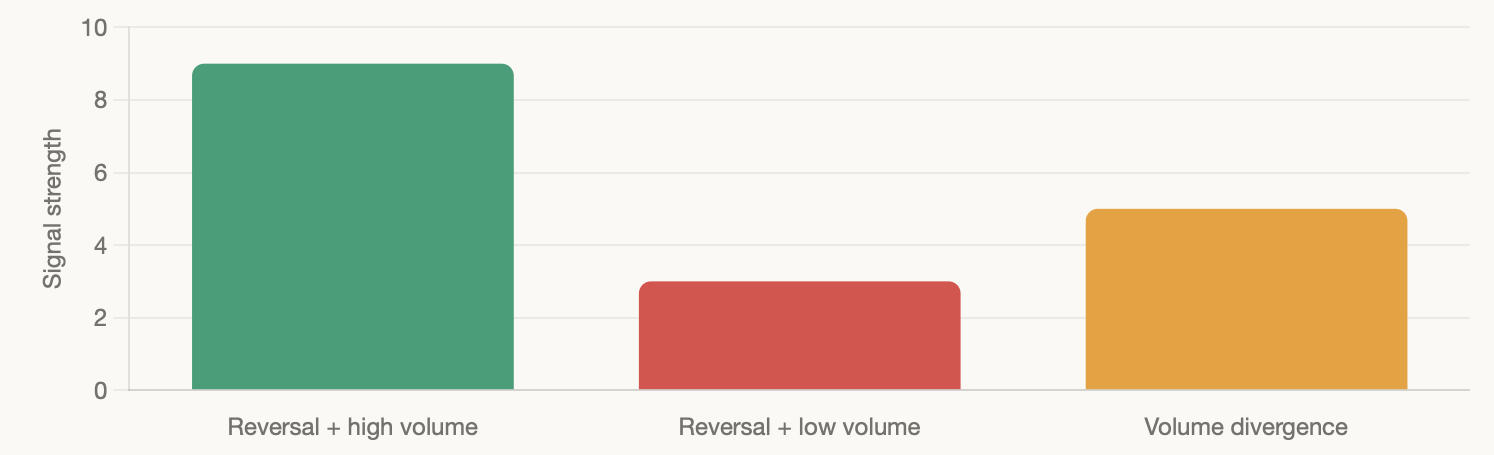
The following three scenarios highlight when reversals will be most significant: First, a high volume surge of trading indicating a change in price direction indicates strength of reversal, second, a low volume reversal indicates weakness of reversal, and thirdly, if the volume is decreasing while a market trend is still in place then a market trend is likely to reverse prior to a potential reversal pattern forming.
The most recent example of an example of what was stated above occurred in December of 2022, when Bitcoin formed a hammer candlestick at approximately $15,000 with a large volume. This occurrence is not simply a coincidence.
Using These Patterns in Crypto, Forex, and CFD Trading
Reversal patterns are going to act differently depending on which market you're trading.
Cryptocurrency markets are quick to move and have no trading session hours. This means that patterns can form quickly and can be signalled by false signals frequently. Therefore, always use higher time frames to clean up noise. Historically, Bitcoin hammer patterns have been one of the most reliable reversal signals on weekly charts.
Foreign currency markets have very good liquidity, and patterns are much cleaner on the 4H and daily charts because they are primarily traded by institutional traders. For example, EUR/USD engulfing patterns have a very good probability of being reversal points at round-number support levels.
CFD markets can behave similarly to both of these markets.
Gold shooting stars at all-time highs have historically predicted pullbacks for 2-10 weeks. Index CFDs like the S&P 500 typically form morning star patterns after a sharp correction during earnings seasons.
Trader Pitfalls
Overlook trends. Hammers traded in a sideways market are not legitimate reversal trades; they are simply guesses.
Support & Resistance are Critical. Price patterns not formed at price levels, or in "open air," are typically lower probability patterns. Reversal signals should always have a "level" as an anchor.
Wait for the Confirming Candle. The first candle after the pattern confirms the pattern. Taking a position during the actual pattern candle is equivalent to gambling.
Patterns can be overfilled. Not every hammer you see is a trade; be selective with which hammers you trade. The best trades are obvious, not forced.
Pattern does not Supersede Context. If the structure is not supportive of a trade, do not trade.
Risk Management for Reversal Pattern Trading
A risk plan is essential to any successful strategy. These three rules will help you manage trades when you are trading reversal patterns.
The first rule is that your stop-loss will be on the opposite side of the pattern's extreme. A hammer has its stop-loss below the lower wick. A shooting star has its stop-loss above the upper wick. If the price hits your stop-loss, the reversal is null and void.
The second rule is to target a minimum of a 1:2 risk-to-reward ratio. If your stop is 50 pips away from your target, then your target must be at least 100 pips from your stop. This allows for the potential of losing more than half the time and still being profitable.
Rule three is that you need to determine your position size by using risk instead of conviction. You should only risk 1-2% of your total account balance on any single trade, no matter how good the pattern may look.
Real Market Case Studies
Bitcoin Hammer: November 2022 In one week, the price fell to $15,500, and on this weekly candle, volume was higher than its 50-day average. A bullish weekly closure above $17k followed, indicating strong bulls present, and the subsequent 6-month period saw the price double.
EUR/USD Bullish Engulfing: September 2022 On a daily chart, a large bullish candle formed at the 1.0600 support zone that entirely enveloped the prior daily candle by size,e as well as the RSI indicator showing bullish divergence. In the weeks following the Bullish Engulfing pattern, the price appreciated over 600 pips.
Gold Shooting Star: May 2023. Before reaching $2,080, a shooting star candle formed on the daily chart, where the wick was over double the length of the body, and it had an increase in volume. Within 3 weeks of the highs made, the gold price declined >$100 before subsequently discovering support at a higher level.
As shown, common aspects included a critical price level, a clean pattern with a confirming candle. None of these occurrences was random.
Frequently Asked Questions
What's the most reliable reversal candle pattern? The bullish engulfing and morning star consistently rank as the most reliable across multiple timeframes and markets, especially when combined with volume confirmation.
Do candlestick reversal patterns work in crypto trading? Yes, but use higher timeframes. Crypto's 24/7 nature creates more noise on shorter charts. Daily and weekly patterns are significantly more reliable.
Are reversal patterns suitable for beginners? They're a great starting point, but beginners should focus on the three most common patterns (hammer, engulfing, morning/evening star) and master those before expanding.
Ready to put these patterns to work? Open a TradeWill demo account and practice spotting reversals on live charts across crypto, forex, and CFDs, with zero risk to your capital.
Disclaimer: The content of the blog does not represent any position of Trade W, does not serve as any trading-related decision advice, and does not endorse any third-party.