

 Trade W

The foreign exchange (Forex) market is the largest and most liquid financial market in the world, with over 7 trillion dollars traded daily. Most traders focus on currency pairs, converting currency A into currency B, for example: EUR/USD (Euro vs U.S. dollar) or USD/JPY (U.S. dollar vs Japanese yen) etc. Currency pairs represent the value of one currency against another.
Most traders will analyze their pair independently which is okay, but successful currency trading depends upon an understanding of pairs' correlations with one another.
So what is correlation? Quite simply, correlation is a measurement of how two things move together. For example, if the weather is hot in the summer then ice cream sales increase, and furthermore if the weather is hot in the summer, then sales of cold drinks tend to increase as well, in that case you would say that ice cream and cold drink sales are positively correlated (the variables go up together).
On the other hand, if one variable tends to go higher while the other variable tends to go lower, then you would say that they are negatively correlated. When we talk about currency pairs there is the same correlation attributed to them, some pairs may move in the same direction (positive correlation) while other pairs may move in the opposite direction.
Why is Correlation important? It is important because correlation directly translates into either profits or losses. Using the example of two pairs that have a very strong correlation, EUR/USD and GBP/USD, if you open buy trades on EUR/USD and GBP/USD at the same time you are doubling the amount of risk exposure in those trades.
Alternatively, knowing negative correlation like USD/JPY and Gold, you can construct hedging strategies to manage risk exposure in times of extreme market movements.
With full understanding of correlation, traders can:
-
Control risk from their positions by avoiding position redundancy.
-
Identify arbitrage opportunities through correlated pairs divergence.
-
Hedge positions by combining pairs that typically have opposite movements.
In this blog, we will start with the fundamental principles of correlation, look at a few common relationships of currency pairs, examine how to measure or identify a correlation, and finish with some more advanced trading ideas or risks management strategies to incorporate into your trading.
We will also look at correlations and relationships with currency pairs in real time, including how psychology, events and economic situations created those correlations.
By the end of the blog, you will not just understand what currency pair correlation is, but more importantly learn how to put it into action when making trading decisions.
II. Currency Pair Correlation Basics
To trade Forex successfully, it is simply not enough to consider the movement of one currency pair on its own. The Forex market is tightly linked within itself and it is often impossible to see how one currency pair impacts others. This is why correlation is helpfula statistical measurement of how two variables move in relation to each other.
What Is Correlation?
In finance, correlation helps determine if two assets (or currency pairs) tend to move together or in the opposite direction. The strength of this relationship is referred to as the correlation coefficient and is expressed as a number ranging from 1 to +1:
-
+1 (Perfect Positive Correlation): The two pairs move in the same direction at the same time
-
0 (No Correlation): The movements of the pairs have no relation to each other
-
1 (Perfect Negative Correlation): When one pair goes in the opposite direction by the same percentage.
An example would be:
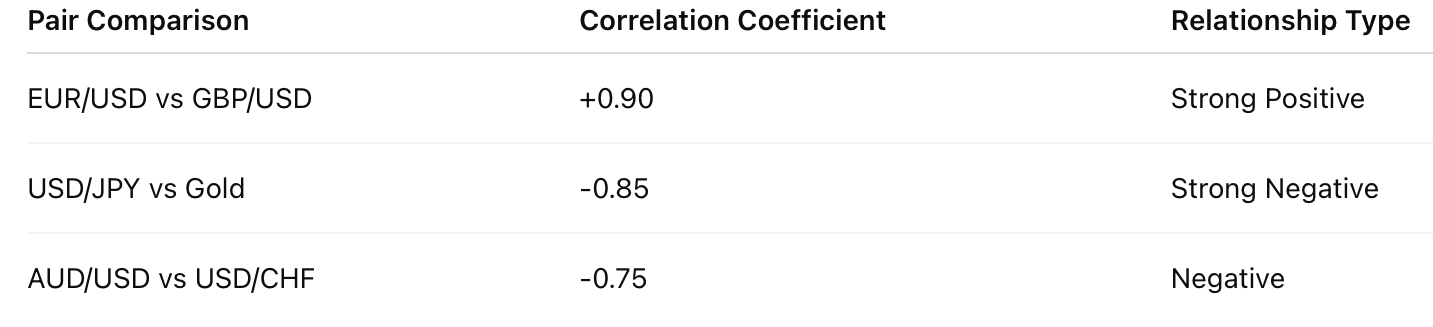
EUR/USD and GBP/USD exhibit a very strong positive correlation (around +0.9).
USD/JPY and Gold have a negative correlation: when the yen appreciates against the dollar, gold is often on the rise.
What Is Behind Correlations?
Correlations do not happen by chance. There are economic and structural connections in the global economy that lead to or explain correlations with currency pairs:
Common currencies – If two pairs share a base or a quote currency, then their movements will be related, at least to some degree.
For example: EUR/USD and GBP/USD both are quoted against the U.S. dollar, so when the dollar is stronger (or weaker), it will exert an influence on both pairs.
Economic connections – Forex pairs with countries that are of geographic or economic distance make for correlated currencies more often than not.
For example: AUD/USD and NZD/USD both are impacted with commonalities for trade and economy in Australia and New Zealand.
Market sentiment – Often times, traders may become riskon and along with the optimistic price action, may buy several "risk currencies" at the same time. This leads to a higher number of positive correlations with the market sentiment in mind.
Historical correlations vs rolling correlations
Correlations are not stable and there may be a pair that is correlated for years but based on a change in monetary policy, economic events, or market sentiment the currencies can diverge. This is why traders will often compare the difference between historical correlation (i.e. average over long periods of time) and the rolling correlation (calculated over moving time frames such as 30 days 0r 90 days).
Historical correlation gives you a broad picture of how pairs may have behaved in the past. Rolling correlation shows the relationship that created that history and lets you see how it evolves over time.
Measuring Correlation: The Key to Risk Management
For traders, personally measuring correlation is important. By measuring the correlation between two pairs, traders are able to figure out whether they are 0.9 positive, or 0.7 negative which directly impacts what decisions they make about whether they:
-
Avoid opening multiple positions in several pairs that are essentially "doubling down" on the same trade.
-
Hedge risk by opening positions in negative correlated pairs to offset risk.
-
Potential arbitrage if two highly correlated pairs begin to move apart unexpectedly.
A simple correlation coefficient table (like the one below) is often used to visualize relationships:
Common Currency Pair Correlations
After we've established an understanding of correlation and how to measure it, we will turn our attention to common currency pairs in the realworld that exhibit consistent correlations. Some pairs are nearly identical in the way they move, while some behave like opposites. Understanding these relationships helps traders identify risks, avoid redundancy, and build strategies
Strongly Positive:
Positive correlations are when two pairs tend to move in the same direction. The most consistent examples include:
EUR/USD and GBP/USD:
These two pairs have a correlation coefficient above +0.8 almost all of the time. Both are quoted against the U.S. dollar and the economies of Europe and the U.K. are quite tied together. When the dollar weakens, both moves up when it strengthens, both move down.
AUD/USD and NZD/USD:
Having said note above, Australia and New Zealand are neighbor economies that export similar products (commodities, agriculture), have a similar profile of trade, are strongly influenced by Chinese demand, and move together in currency. As a result, they both have consistently strong correlations above +0.85
EUR/USD and AUD/USD:
While this is a weaker correlation that above, it still is considerable. They are both both "risk currencies", meaning that they aquire strength when global investors are operating with a riskon mentality.
Strong Negative Correlation: A negative correlation happens when the pairs generally move in opposite directions. A couple original examples include:
-
USD/JPY and Gold (XAU/USD): When the U.S. dollar is strengthening against the yen, there is generally a corresponding decline in gold due to global demand for safehaven assets. Conversely, traders flock to the gold market during uncertainty and the USD/JPY pair will often weaken.
-
USD/CAD and Oil (WTI/Brent): Canada is one of the largest exporters of oil, so as oil prices rise, they have a tendency to strengthen the Canadian dollar. For this reason, USD/CAD(where the U.S. dollar is quoted against CAD) generally moves lower when oil rises. This negative correlation makes it one of the most popular currency–commodity ratio pairings.
-
USD/CHF and EUR/USD: Since the Swiss franc is a safehaven asset, USD/CHF generally moves in opposition to EUR/USD; the correlation is not always perfect.
Beginner Analogy: Think of two rivals in class, the first person answers a question so the second person purposely stays quiet. They both follows each other's actions, but in opposite ways.
Moderate or Weak Correlations
There are not always strong or stable correlations between pairs at all times. There may only be moderate correlation sometimes or their correlations may weaken depending on global circumstances.
For example, EUR/USD and USD/JPY would show moderate correlation, but the same experience with Japanese monetary policy may cause the correlation to weaken. GBP/USD and USD/CHF can also exhibit mixed correlations inherent to risk sentiment and monetary policy influencing market conditions. Specifically, during periods of risk aversion or appetite, GBP/USD and USD/CHF correlation may weaken or moderate.
These observations demonstrate why correlations needed to be monitored continuously by traders, instead of assuming they remain fixed.
Rolling Correlations: A Dynamic Perspective
Correlations shift along with the transitions in markets. For example, correlations between USD/CAD and oil prices can become quite strong while there is high energy market volatility and become weak when macro factors dominate.
A rolling correlation heatmap (12 months is ideal) is one of the best way to explore and visualize these dynamics. Rolling correlations provide more clarity than a static correlation number, as they show how prices strengthen, weaken, or reverse relationships over a time series.
Professional Example: In 2019, the commonly strong correlation between EUR/USD and GBP/USD diverged temporarily during the uncertain Brexit environment and traders that noticed this break momentarily exploited arbitrage opportunities.
The Importance of Understanding Correlations
Understanding correlations is beneficial for traders because they can:
Minimize Overexposure: If you buy EUR/USD and GBP/USD at the same time, you are essentially doubling up on the same bearish bet on the U.S. dollar.
Identify Hedging Opportunities: Negatively correlated pairs like USD/JPY and Gold can be used to offset your risk.
Identify Anomalies: If the pairs that normally correlate are not stacking up as a correlated pair, then this may indicate a trading opportunity, or could present a concern that the market is behaving unusually.
How to Find Correlations
Understanding the relationship known as "correlation" is only the first step. The real skill comes from finding and measuring correlations so traders can apply them in actual trading. Fortunately, there are many tools from simple chart overlays to sophisticated statistical software to make this process accessible to many novice and experienced traders as well.
Tools to Identify Correlations
Trading Platforms (MT4/MT5, TradingView):
Most Forex traders work on platforms like MetaTrader or TradingView, to overlay charts of two pairs and 'eyeball' whether they move together. A small handful of platforms offer builtin correlation indicators or addons that calculate correlation coefficients automatically.
Excel or Google Sheets:
A simple spreadsheet will also allow traders to calculate correlation using historical price data. By inputting the daily, weekly or monthly closing prices, and performing the CORREL calculation, traders can compute correlation coefficients between pairs over specific time periods.
Quantitative Software (Python, R, MATLAB):
More advanced traders may turn to coding in programming languages such as Python or R. They can run batch analyses, rolling correlations, or create heatmaps showing the relationships of dozens of currency pairs.
WebBased Correlation Tools:
Many finance websites and brokers publish freetouse correlation tables and charts, giving traders a quick snapshot of the strongest and weakest relationships at any moment.
Choosing Timeframe
Correlation can vary extensively over time so the results are contingent on the timeframe:
1. Short correlation (1 day to 1 week): This goes to current market sentiment and eventdriven movement which would indicate shortterm and day traders.
2. Medium correlation (13 months): This would signal a balance of noise and trend to where swing traders could consider it.
3. Long correlation (1 year +): This would represent structural economic relationships to enable portfolio construction.
Rolling correlation is also valuable. By calculating correlation over a rolling window (i.e. 30 days, 90 days) allows the trader to see how relationships can dynamically change instead of providing only one static number.
Methods to gauge relationships
Overlapping Price Charts
The simple method of overlaying two currency pairs, if they generally move together is a positive correlation; if roughly in the opposite direction, negative correlation.
Scatter plots of returns
Similar to overlapping price charts, we would take the returns of one pair on the xaxis and other pair on the yaxis. In this scenario, we would use the color of the dots to represent the intensity of the correlation based on volume and volatility. A tight diagonal upward line shows a strong positive correlation and a tight diagonal down shows a strong negative correlation.
Correlation Matrix
A matrix showing the correlation coefficient (R) of multiple pairs simultaneously. This is valuable for asset managers as it provides a view of all of their currency correlations when trading multiple pairs within a portfolio.
Beginner versus Professional Methods
Beginner Method: A trader could simply view EUR/USD and GBP/USD in TradingView, side by side. If they both seem to go up and down together, it is a quick confirmation of positive correlation.
Analogy: Listening to two songs if they sound alike, they are "in sync" (positive correlation).
Professional Method: An analyst might download EUR/USD Daily Close prices and the U.S. Dollar Index (DXY) prices, calculate a 90day rolling correlation in Python and develop a strategy that dynamically adjusts position size as correlation strengthens or weakens.
Trading Strategies Using Correlation
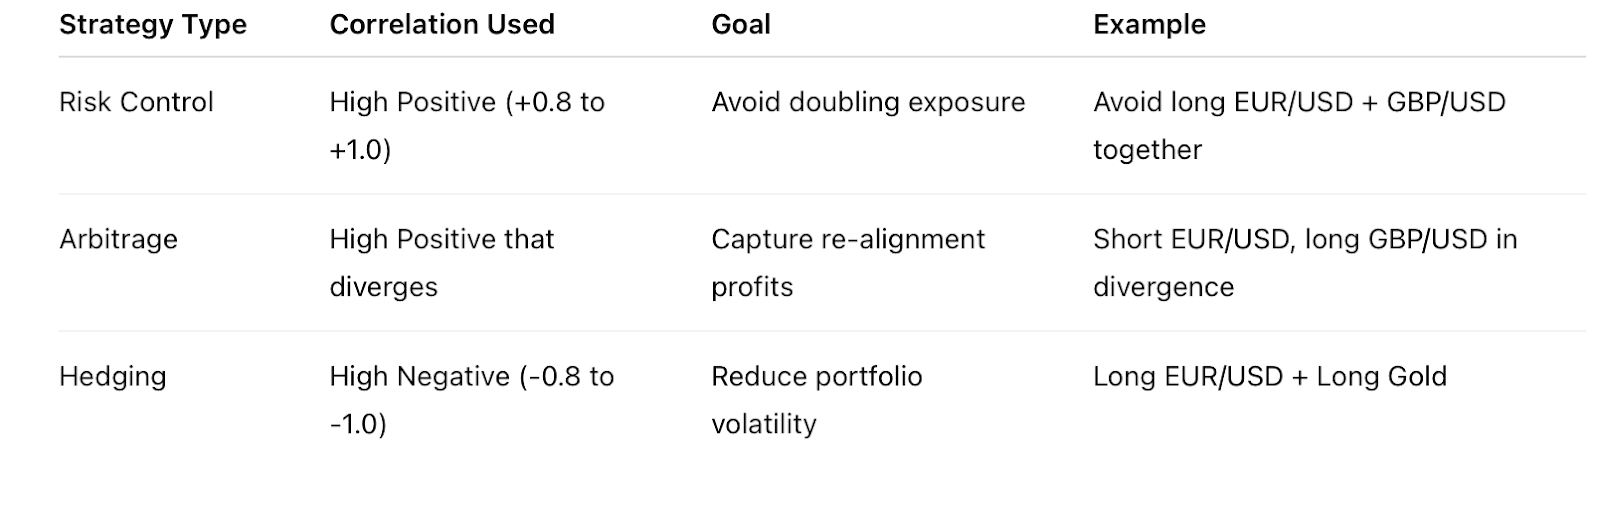
Comprehending currency pair correlations is helpful, but the value is account for when traders practically apply or take action on understanding them. Correlation can help traders eliminate unnecessary risk, establish arbitrage trades, and ultimately create hedging strategies to protect portfolios from volatility. In this section, we will outline a method for each type of trader to take correlations and implement action strategies.
1. Risk Management: Avoiding Redundant Risk
The most common mistake new traders make is they open multiple positions in pairs that are highly correlated where they are essentially doubling risk exposure without realizing it.
Example: A trader goes long (buys) both EUR/USD and GBP/USD believing that the dollar will now weaken. Given the historical positive correlation between the two pairs is around +0.9, these are at best the equivalent of the same bet. If the dollar actually strengthens, then you are losing on both trades at the same time.
Solution:
Use correlation tables to analyze relationships preopening positions.
Limit correlated risk exposure by recognizing that a trade in pairs a, b, c, and d with above +0.8 correlations is risky.
Diverse exposure into correlated pairs that are less reflective of each to facilitate that exposure.
Remember the analogy of the beginner: It is no different than offering to loan your two friends their whole allowance when they almost always spend money together so you are taking the same risk once again.
2. Arbitrage Opportunities
Arbitrage strategies take advantage of temporary divergences between two very closely correlated pairs.
We know how it works.
-
Identify two pairs with proven historical correlation (e.g. EUR/USD and GBP/USD).
-
Look for unusual divergence (e.g. EUR/USD moves sharply high while GBP/USD record low).
-
Put on offsetting positions: go long on the lagging pair and short on the outperforming pair.
-
Profits are detrived when the two pairs "snap back" together.
Professional Case: In 2019 when certain Brexitrelated developments caused the GBP/USD to move sharply apart from the EUR/USD, those traders who shorted the EUR/USD and went long on the GBP/USD when that divergence happened, enjoyed the profits of that divergence when the two pairs reestablished that correlation (again).
Risk: A divergence can take longer than you think to realize, especially if it were to be driven by a significant structural shift in the economy (e.g. policy changes, political crises). You should always be implementing a stoploss order to protect against your losses spiraling out of control.
3. Hedging Strategies
The presence of a negative correlation presents a strong opportunities for hedging, which helps to lower your portfolio overall volatility during times of uncertain market conditions.
Example:
You may be long EUR/USD but worried about a period of sudden USD strength?
You can hedge that position preference by setting a short position on USD/CHF, as the Swiss franc often moves inversely to the euro.
You can alternatively hedge this position using Gold (XAU/USD) as Gold will tend to rise during periods of dollar weakness.
Benefits of Hedging with Correlation:
-
Smoothes portfolio returns.
-
Reduces your emotional stress of trading in volatile markets.
-
Provides “insurance” against black swan events.
Example: During the COVID19 market shock event in March 2020, many professional traders that held exposure to long equity diverged to hedge the exposure they held by buying gold or shorting USD/JPY.
4. Doing it: Create Your Correlations Strategy
Calculate Your Correlations: Measure your pairs' correlations with either Excel, TradingView, or MT4.
Verify Trend: Verify that you have lots of data to confirm your correlations by using rolling windows.
Which Strategy:
-
If we have a high positive correlation with our pairs → don't double our positions, or look for arbitrage opportunities when they diverge.
-
If we have a high negative correlation with our pairs → hedge our positions to limit risk.
-
Take the Trade: Enter our position with both stoploss and takeprofit levels based on our technical/fundamental signals
-
Continually Monitor: Correlations change. Update regularly to avoid stale assumptions.
5. Advanced Correlation Strategies
For the more advanced trader, correlation is integral to traditional quantitative fundstyle portfolio management.
Portfolio Optimization: By correctly positioning the long and short positions over correlated and uncorrelated pairs, the portfolio can be optimized to maximize return with minimized volatility.
Statistical Arbitrage: Applying regression analysis and cointegration to explain or deemphasize the price relationship between pairs when they are deviating from their historical mean.
VolatilityWeighted Correlation: Adjusting the correlation based on volatile levels to relatively clarify the riskadjusted correlation.
Professional Example: A fund could go long AUD/USD and short NZD/USD when their correlation were weaker, but size the trade on volatility so that the risk exposure was neutral.
Correlation Trading Strategy Table
VI. Dynamic Correlations & Statistical Analysis
One of the greatest misconceptions of new traders is the assumption that correlations between pairs are static, or unchanging over time. In reality, correlations are dynamic and have the ability to eventually strengthen, weaken, or even reverse depending on factors such as changing economic conditions, changes in monetary policy, or shifts in broader market sentiment. For correlation to work for traders, they must understand not only, how to identify correlation, but also how it can change over time.
Reasons for Changes in Correlation
Here are some of the reasons correlations could change:
-
Changes in monetary policy : Central banks can cause divergence in correlation. For example, if the Federal Reserve raises rates, but the European Central Bank does not change, the EUR/USD correlation to other USD pairs may weaken.
-
Global Event: Any global event such as a pandemic, war, or financial crisis can break even the longest of correlations.
-
Market Sentiment: In riskon environments, high yielding currencies AUD or NZD for example will typically have some correlation. In riskoff scenarios, currencies like JPY and CHF have the potential to distort correlations.
Rolling correlations
The best way to show the tightening and loosening of relationships is through rolling correlations. Instead of calculating on one static coefficient over the whole dataset, a trader can calculate a the correlation over a moving time window (e.g., a rolling 30day, 90day, or 180day correlation).
-
Shorter rolling windows (30days): Can give shortterm directional changes, but can be quite noisy
-
Longer rolling windows (180+ days): Will smooth out the volatility and can show more of a structural trend
Statistical Methods to assess correlation
Some advanced traders or analysts will apply statistical methods to give them a much richer picture of correlation structures across large numbers of assets:
Correlation Matrix: summarizes correlations between multiple pairs simultaneously, providing a useful tool for portfolio traders to ensure they don't have overexposure across currencies
Heatmaps: a graphical version of a correlation matrix, using colors to indicate both strong and weak relationships, can be especially useful for identifying clusters of positively correlated pairs.
Volatilityadjusted Correlation: modifies correlation by weights based on volatility, providing a transparency measure that is more sensitive to risk. Two currency pairs can have a moderate correlation, yet if one has significantly more volatility it will result in a dissimilar practical impact on trading.
Cointegration: provides a step beyond correlation in that it tests whether two time series have a stable long term relationship, even though they might diverge in the short term.
Correlation on Different Horizons
Understanding correlation on different time frames is important when designing strategies:
-
ShortTerm Traders (Scalpers, Day Traders): You would primarily look for 30day or even intraday correlations when searching for divergences or hedging opportunities.
-
Swing Traders: You might look for something between 90 days to 180 days rolling correlations to filter out the shortterm noise while looking for a mediumterm trend.
-
LongTerm investors: You would look for either 13 year historical correlations to design a diversified portfolio and limit systemicexposure.
Case Study:
A shortterm trader may see a temporary divergence between GBP/USD and EUR/USD and take a very short arbitrage position.
A longterm portfolio manager may not be as concerned about the GBP versus the EUR, but could be more concerned about balancing the exposure between commoditylinked currencies (AUD, CAD, NZD) against safehaven currencies (USD, JPY, CHF) based on their structural correlations.
VII. Influence of Market Events & Economic Data
While two currency pairs may have a strong correlation historically, major economic events and data can fundamentally alter their relationship. For traders this means that correlation should never be seen in isolation, rather it must be seen in relation to a potential larger macroeconomic picture.
Central Bank Policies
Interest rate decisions and monetary policy outlook are among the strongest forces which can result in correlations being broken.
-
Fed vs ECB: If the United States Federal Reserve raises interest rates and the European Central Bank's interest rates remain unchanged, the Dollar will strengthen against the euro. This may lessen the typical correlation between EUR/USD and other dollar pairs such as the GBP/USD, as currency types react to divergent policy differently.
-
BOJ and SafeHaven: If the Bank of Japan intervenes to weaken the yen, correlations of USD/JPY with risk assets might break temporarily as immediate moves from intervention override usual patterns.
This is a professional example: In 2022, as the Fed was aggressively hiking rates, the ECB was lagging, and therefore, EUR/USD was decoupled from some of its usual positive correlations with other risk currencies, indicating divergent interest rate paths.
Consider two friends who typically go to a coffee shop together to have coffee. If one of their friends suddenly goes on a stringent diat, their routine diverges, though it was once joined at the hip.
Economic Data
Regularly disseminated economic data can cause shortterm disturbances to correlations:
GDP, Consumer Price Index and Employment Reports: A strong U.S. jobs report may result in broad dollarpush and the correlations remain unchanged across the dollar pairs. However, if the eurozone or U.K. data are inconsistent with the U.S, the temporary divergence may weaken the EUR/USD and the GBP/USD correlation.
Data on Inflation: If inflation develops at a faster pace in one location versus another it impacts trader expectations for a rate change, and currencies' correlation will develop differently.
Professional example: In very early 2021, stronger than expected U.S. CPI data pushed the dollar stronger. The move was not identical across all the dollar pairs. While EUR/USD dropped sharply, AUD/USD held up better due to an uptrend in commodity prices. Their divergence in the shortterm resulted in weaker correlation.
Extreme Events
Global shocks can lead to outright breakdowns in wellestablished correlations:
-
Pandemics (COVID19): For example, in early 2020, EUR/USD and GBP/USD broke (for the first time) from their historical correlation with both pairs behaving very differently in response (usually GBP/USD is more correlated to either EUR/USD in this situation); and this time Brexit uncertainty amplifying sterling volatility while the euro behaved more like a safe haven.
-
Wars/Geopolitical Tensions: Often conflicts spike oil prices which can create or strengthen CAD as usual correlations between USD/CAD amounts of trade from the reserve (for nonCAD pairs) weaken.
-
Financial Crises: Correlation often increases across all risk assets during systemic crises as investors scramble to safety. However, some correlations between pairs may not be as distorted because of panic as much as differences in how each country responds to a financial crisis.
Correlation Change Curves
As an exercise to visualize the effects of significant market events is to draw correlation change curves to display correlation change before and after a significant market event. For example,
Before COVID, the EUR/USD and GBP/USD correlation was hovering near +0.90.
In March 2020, the average correlation dropped to +0.60, as sterling had a very different reaction to the political headwinds of Brexit fears, combined with the uncertainty surrounding a pandemic, the major currency pair yt1 seemed to breakaway from each other.
The correlations gradually started to recover over the following months as panic opened to complacency again.
These curves are reminders to traders that correlations exist not only as statistics, but also context. All correlations will fail eventually.
VIII. Behavioral & Psychology Side
While longterm correlations are a function of economic fundamentals and central bank policy, shortterm discrepancies within the guidelines of fundamentals often come down to trader psychology and market behavior. Understanding these psychological aspects will better assist traders in understanding why correlations may break for a timeand ultimately, seize the opportunity.
Herding Effect
Markets are a social setting. Whenever large numbers of traders all seem to "jumpin" at the same time, those correlations have the potential to move into excessive areas of strength or weakness beyond any type of fundamentals.
Example: In a strong "riskon" rally, thousands of traders are all piling into higher yielding currencies such as AUD, NZD, and GBP at the same time. When this occurs this herding behavior can start to drive correlations for these pairs much higher than their historical averages.
Likewise, during periods of panic and “riskoff” more frequently traded safehaven currencies such as JPY and CHF may surge as well, strengthening correlations abnormally.
Beginner analogy: Think of a group of friends. One starts running towards the icecream truck. The others follow, not because they planned to, but because it is group psychology.
Panic and OverOptimism
Extreme emotions fear and greed produce shortterm abnormal correlations.
Fear: In sudden/steep price declines in wideranging market crashes, traders sell risk assets indiscriminately. This can cause multiple pairs to move together despite little or no normal correlation.
Greed: In traditional speculative advances, traders may simply ignore fundamentals. This can create unusual alignments in daytoday and multiday correlations (i.e. differences between unrelated risk relevant assets).
SentimentDriven Breaks
Whenever a trader tracks the underlying asset sentiment (often referenced through the VIX volatility index, positioning reports, or news sentiment) there is usually an observable correlation to crowd sentiment. Understanding the sentimentdriven break can help determine if you are simply dealing with noise versus structural breaks.
If correlations weaken due to extreme sentiment (extreme panic or euphoria), then the break is likely a temporary one.
If correlations weaken and the market sentiment is calm, then the break is likely signifying a deeper structural break (perhaps diverging monetary policy).
Why Psychology/ Sentiment as it Relates to Correlation Matters to Traders
-
Helps to Explain Anomalies: Not all divergences are fundamental, sometimes they are crowddriven.
-
Creates ShortTerm Opportunities: Panic and herding are often temporary traders can profit from these shortlived misalignments.
-
Improves Risk Management: By understanding when correlations are breaking due to sentiment, traders can avoid overreacting to temporary noise.
IX. Conclusion
Currency pair correlations are more than just numbers in a chart, they are a useful way for traders to examine the interconnectedness of global markets. From the strong connection shared by EUR/USD and GBP/USD to USD/JPY and gold having an inverse relationship, correlations tell you about how currencies, commodities, and macroeconomics move in relation to each other.
Now you have seen how to:
-
Define and identify correlation (from coefficient to rolling).
-
Understand common pair relationships and identify why they share those relationships.
-
Use tools and charts to calculate correlations in action.
-
Execute trading strategies such as risk control, arbitrage, and hedging.
-
Adapt to changing correlations as they are fluid and always changing.
-
Adapt to external shocks (i.e. central bank policy, economic data releases, global financial crisis).
-
Factor psychology into play (i.e. to understand shortterm anomalies driven by herdmentality and sentiment).
The big picture lesson is: correlation is not a forecasting device; it is a decisionsupport device. It allows you to manage your risk exposure, avoid overexposure, identify potential hidden opportunities.
Traders that look at individual charts have the possibility of missing the larger market factors, whereas more skilled traders understand correlation and can predict directional movements across the market ecosystem.
But correlation varies. It could be strong or weak today because of a change in policy or market rotation, or due to the cognitive process of the participants that causes behavior shifts at that moment.
Monitoring needs to be ongoing with correlation as the foundation for ongoing conditions based on statistically valid measuring systems and market knowledge while also understanding how trader behavior alters their decisionmaking.
When just starting out, track a couple of currency pairs (like EUR/USD and GBP/USD) in your charting platform to monitor their correlation when you take a position taking note of different timeframes. Over time add correlation matrices and rolling analysis and increase your scope with a more portfoliobased strategy.
For highly skilled traders, correlation can be an element of a quantitative trading strategy that can help you build more balanced portfolios, implement arbitrage, and discover new strategies for returns.
Ready to put this into practice? Visit Tradewill.com to learn more and practice correlation trading on demo accounts before risking real capital.
Disclaimer: The content of the blog does not represent any position of Trade W, does not serve as any trading-related decision advice, and does not endorse any third-party.