

 Trade W

What Are Day Trading Strategies? A Beginner-Friendly Guide Most Traders Get Wrong
First and foremost, day trading strategies are not about staring at charts for eight hours a day and downloading all the indicators offered by your broker.
In essence, day trading refers to entering and exiting trades on the same trading day. As such, day traders do not carry overnight positions, meaning there are no overnight surprises due to market gaps, as you will know exactly what has happened since you woke up.
Essentially, you will be trading from a clean slate each day.
Newcomer traders tend to misinterpret this concept in three distinct ways. Most think that because it is called "day trading," that implies you will be actively trading all day long. Professional day traders usually only trade for 1-3 hours a day during times of the best probability to succeed.
Another common assumption of many traders is that the more indicators you use, the better your results will be. Usually, the opposite is true; often, having too many indicators will have the opposite effect and actually decrease your overall performance. And finally, the belief that "consistency" is defined as trading every single day is incorrect. Consistency is following your own rules, as well as only trading when the conditions meet your own personal set of trading rules.
So what makes day trading attractive to so many different people around the world?
The first reason is efficiency in terms of time. As an example, a full-time worker in Singapore may trade the opening of the London market on their commute to work; likewise, a trader in New York may trade the first hour of the US market while eating breakfast. In other words, day trading adapts to your schedule.
An additional reason is that day traders limit their overnight exposure to the market. The overnight risk to all traders is much higher than the risk associated with making incorrect entry decisions. Political announcements, economic news, and even company earnings occur outside of regular trading hours. Day traders do not have to worry about any such events.
You can also trade as many different markets as you wish with day trading strategies, i.e. as outlined above, on Forex pairs (EUR/USD); stocks (S&P 500); Commodities (Crude Oil); and even on Crypto. The only constant is that the trading principles remain constant, and the instruments you will use will change.
Simply put, you can compare it to a retailer who buys products and then sells them the same day without ever having to carry inventory, i.e. you buy your inventory in the morning, sell it in the afternoon, and pocket the profit. You do not have any additional costs for overnight inventory storage. You close your books every evening.
This is the most basic breakdown of day trading.
To contrast with swing trading or long-term investing, where an investor holds positions for many days or weeks or months or even years, respectively. Each approach serves different and specific purposes. As a result of the more rapid turnover of capital, day trading will allow traders to limit their exposure in the market. Swing trading captures mid-term trends, while long-term investing is designed to build wealth by utilising the power of compounding.
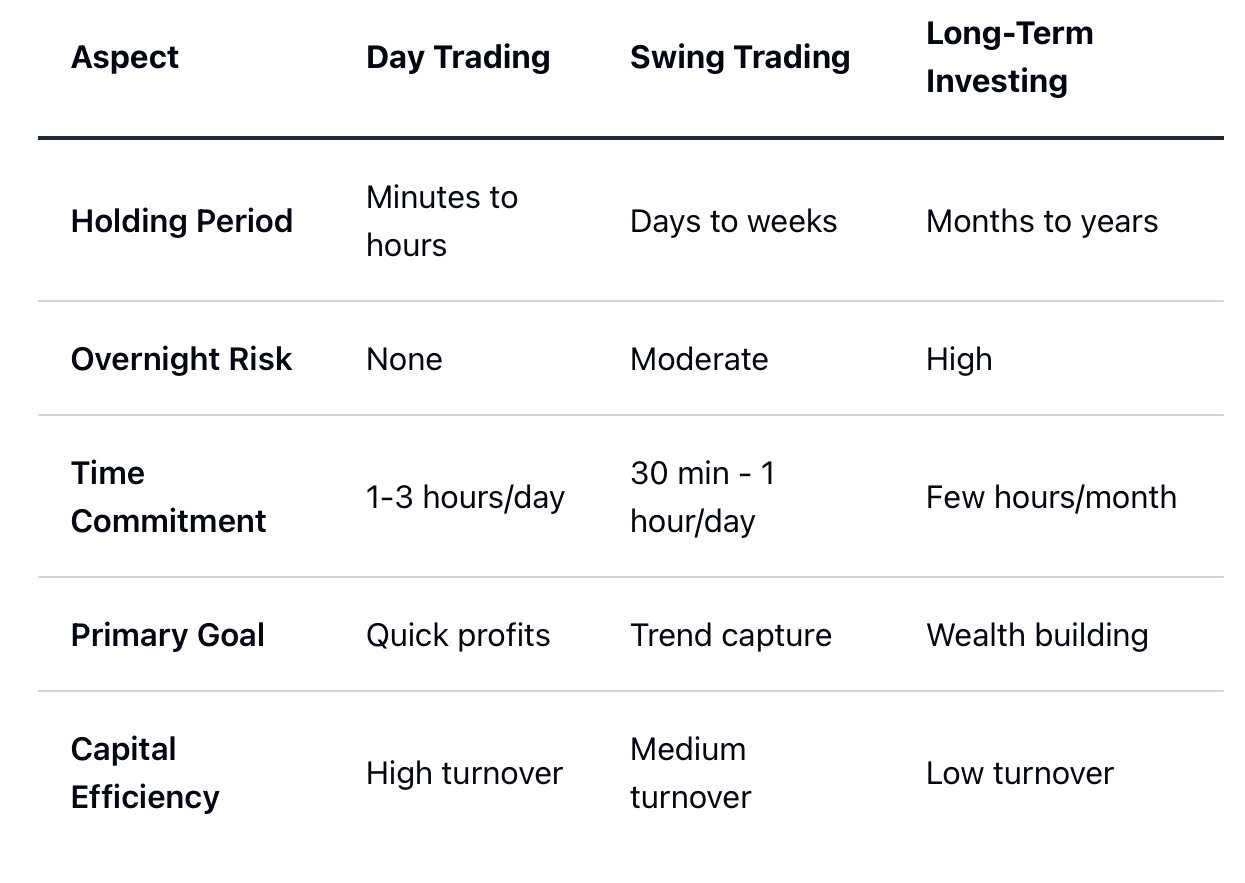
None of these approaches is better/worse than any other, but each is used for different purposes.
The defining difference between successful day traders and the vast majority of all day traders is that the successful day traders view their day trading strategies as a structured business system rather than a gambling session. Everything about how to enter, exit, manage risk, and how long to hold your trade is predetermined, and rules have been put in place before the opening of the market.
While speed is not the primary factor in day trading, structure is.
Why Most Day Trading Strategies Fail: The Hard Truth About Indicators and Retail Traps
It’s easy to spot the repeating losing patterns on any trading forum. Traders constantly mention things like moving averages crossed, RSI hitting oversold levels, and MACD divergence; yet almost every time they also report that the trade failed.
Why did the trade fail?
Indicators do not predict future price movement; they simply give information concerning past price movements.
Moving average tells you where prices have been over the last 20 trading periods, RSI shows you the direction of price momentum over the last few trades, and MACD is used to compare two moving averages; all of the indicators use historical trade data, and they always lag behind actual trade prices.
Price movements come before indicator movements.
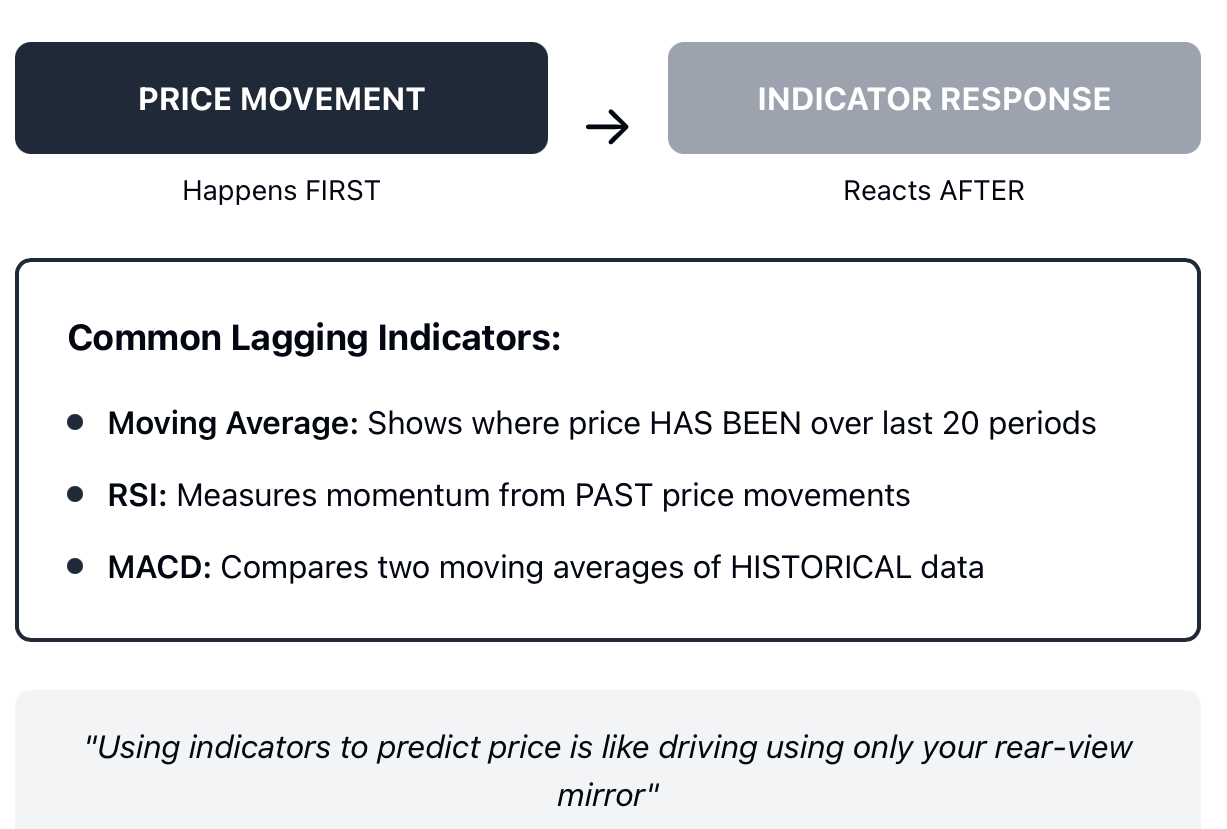
This doesn’t mean indicators are defective tools; it just clarifies the purpose for which they were created. Indicators were created to measure the past, and using them to initiate trades would be similar to driving your car using only your rear-view mirror.
If retail traders continue to experience a high failure rate with their day trading strategies, it is because they make predictive decisions on where they believe the price is headed next.
Retail traders spend a lot of time researching patterns that indicate the direction prices might move, memorising setups and hoping that the market behaves as they expect it to react to those setups. Conversely, institutional traders do not predict ahead of time; they react to where all of the other traders must exit.
This discrepancy in trading processes is the greater influence determining why retail traders continue to fail with their day trading strategies, while institutional traders continue to thrive.
When thousands of retail traders start to adopt the same public breakout system as indicated by the “execution” of the orders, the same retail traders place stop-losses at the same level (i.e. right in front of the breakout point). Therefore, once the price reaches a stop-loss level and the stop-loss is executed, this will direct attention to a specific point as it relates to liquidity (buy/sell orders) for those that caused the price movement.
When market participants rapidly react to price movements based on liquidity levels created by executing stop-loss orders at or near the same points, institutional traders are able to predict the actions of retail traders by observing at which price point the majority of stop order executions will take place. Once an institution identifies the location where stop orders were executed and where most of the losses for retail have been sustained, the same institution can react to the motives behind retail trader losses.
A productive example of this is during the London session opening of the Forex market. During the London session opening, prices typically rise very rapidly in one direction, trigger a large number of stop-losses, and then reverse quickly in the opposite direction. Retail traders consider this an example of “manipulation” or “fake breakouts”; institutional traders consider it another Thursday.
It’s not a conspiracy, it’s just business.
As a beginner-friendly analogy: when preparing for an exam, as a student, you are trying to guess the questions that will be on the exam; however, institutions are those that actually “write” the exam questions and therefore will not have to guess their way through the process.
Unfortunately, most traders don’t make the mental transition from “how do I figure out where price is going next?” to “where are traders that are forced to liquidate their positions?”
Once a trader can shift their perspective, strategies that were once evaluated as “failing” to provide positive results aren’t able to provide positive results by continuing to hope. Instead, they work because they align with the way the market performs.
The Real Edge Behind Profitable Day Trading Strategies: Liquidity, Time, and Trader Behaviour
To comprehend how to use your day trading strategy, you must have complete knowledge of the concept of liquidity. Liquidity means, quite simply, available buy and sell orders in the market. Each transaction in a financial market requires a buyer and seller, so there must be a counterparty for every transaction. If there is no counterparty at the time you wish to execute a trade, then liquidity will not exist in the market.
Stop-loss orders provide liquidity pools that are concentrated around their stop-loss levels. Stop-loss orders are brokers’ pending orders that sit in the market waiting to execute a trade. Traders often buy or sell at their breakout price, and then, after the price has moved up and down based on what is available in the market, brokers will execute trades.
So, while an upward price movement may seem random, the price movement of the market is actually an effort to reach liquidity, where all stop-loss orders are or were. It is not aimed at targeting you or your stop-loss; in fact, your stop-loss may just be a part of a larger pool of stops at the same area.
There are three types of market participants.
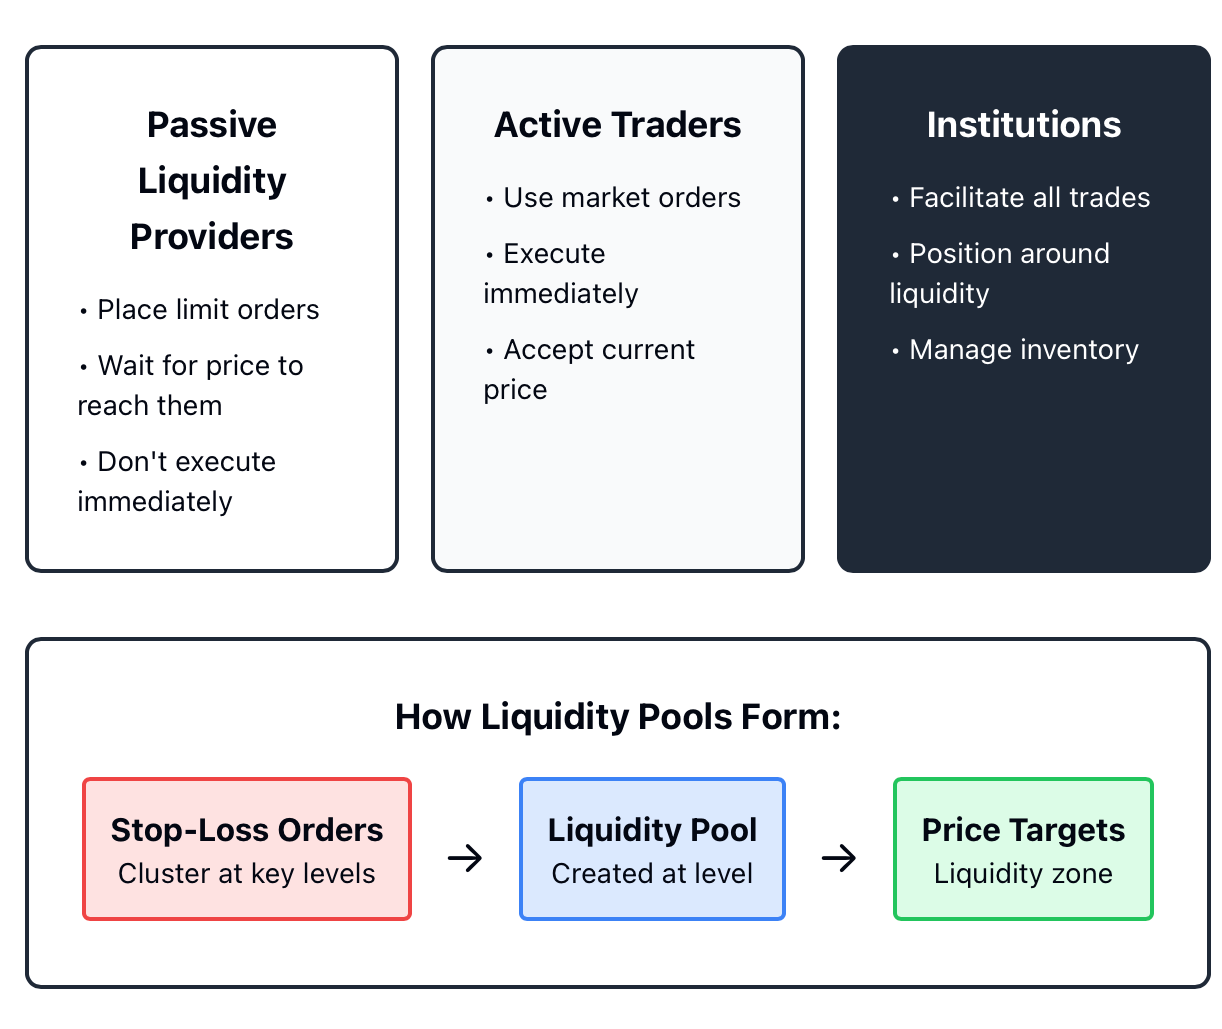
1. Passive liquidity providers, who place buy and sell orders in the market but do not execute an order until the price reaches their order level;
2. Active traders, who use market orders to execute their buy or sell orders immediately based on the best available price;
3. Market makers and institutions, who facilitate passive and active traders, but who also position themselves around liquidity zones. Institutions do not forecast price direction; rather, they manage their own inventory and take advantage of predictable trader behaviour.
The most critical point that separates successful day traders from unsuccessful day traders is this: Instead of predicting which direction the price is going, successful day traders will identify where the majority of traders are experiencing forced exits and then take advantage of these forced exits.
Take this example: At market open, index CFDs typically display a price pattern, where the price rises above the previous day’s high price. When the price rises to that level, it triggers traders who wish to buy breakouts and place stop-loss orders. As a result, the price moves sharply lower and stops all of those traders. After all this activity, the price tends to return to its upward direction.
Why does this happen repeatedly?
The primary reason that this repeated pattern occurs is that breakout traders all follow similar patterns of buying on breakout, placing their stop-loss orders just below the breakout, and waiting for the continuation to move even higher. Because of this, institutions will purposely drive the price above the price breakout to encourage the breakout buyers and gather stop-loss orders to create a liquidity pool for the next move.
The above pattern is not manipulation; it is liquidity management.
To put it in simple terms: Imagine a crowd of people exiting an event. Just like people tend to move in a specific direction toward exits rather than randomly, price will also always be influenced by liquidity clusters.
If you were only to view the market with respect to its base, you would see every failed breakout as the result of a liquidity sweep, and you would see every sudden reversal at an area of support as just a cluster of stop-losses being hit. As a result, it would become a lot easier to read the price action of the market, based on predictable trader behaviour, rather than chart patterns.
Ultimately, every day trading strategy that successfully had time or the type of instrument depended solely on the concepts of liquidity.
If you are able to find and identify where your forced exits are, then you can easily manage your risk and continue to do so on a continuous and consistent basis.
From Zero to One: Practical Day Trading Strategies for Busy and Part-Time Traders
To make use of your theoretical knowledge, you need practical structures. Theory is only worthwhile if you can apply it in real life! Let's look at three separate practical systems that will be effective even with only 30 minutes of trading per day.
Strategy 1: Opening Range Breakout (ORB)
The ORB is best used with stock index futures and major currency pairs, and should be traded in 30 - 60 minute trading sessions. The ORB trading strategy is based on a simple logic.
At the beginning of a new trading session, traders will spend 15 - 30 minutes determining what happened overnight, positioning themselves for potential follow-through moves, and waiting for the market to create momentum. This creates a "range" (high/low).
When the price of an asset breaks the established range on volume and conviction, there is often enough momentum in that direction for an additional 1-2 hours, as this is where the liquidity is created by traders who are committing to their positions. In addition, stop-loss orders placed by buyers and sellers are clustered on the opposite side of the range.
When you buy and sell, you are not trying to predict the direction of the breakout but instead are reacting to the breakout once it has occurred.
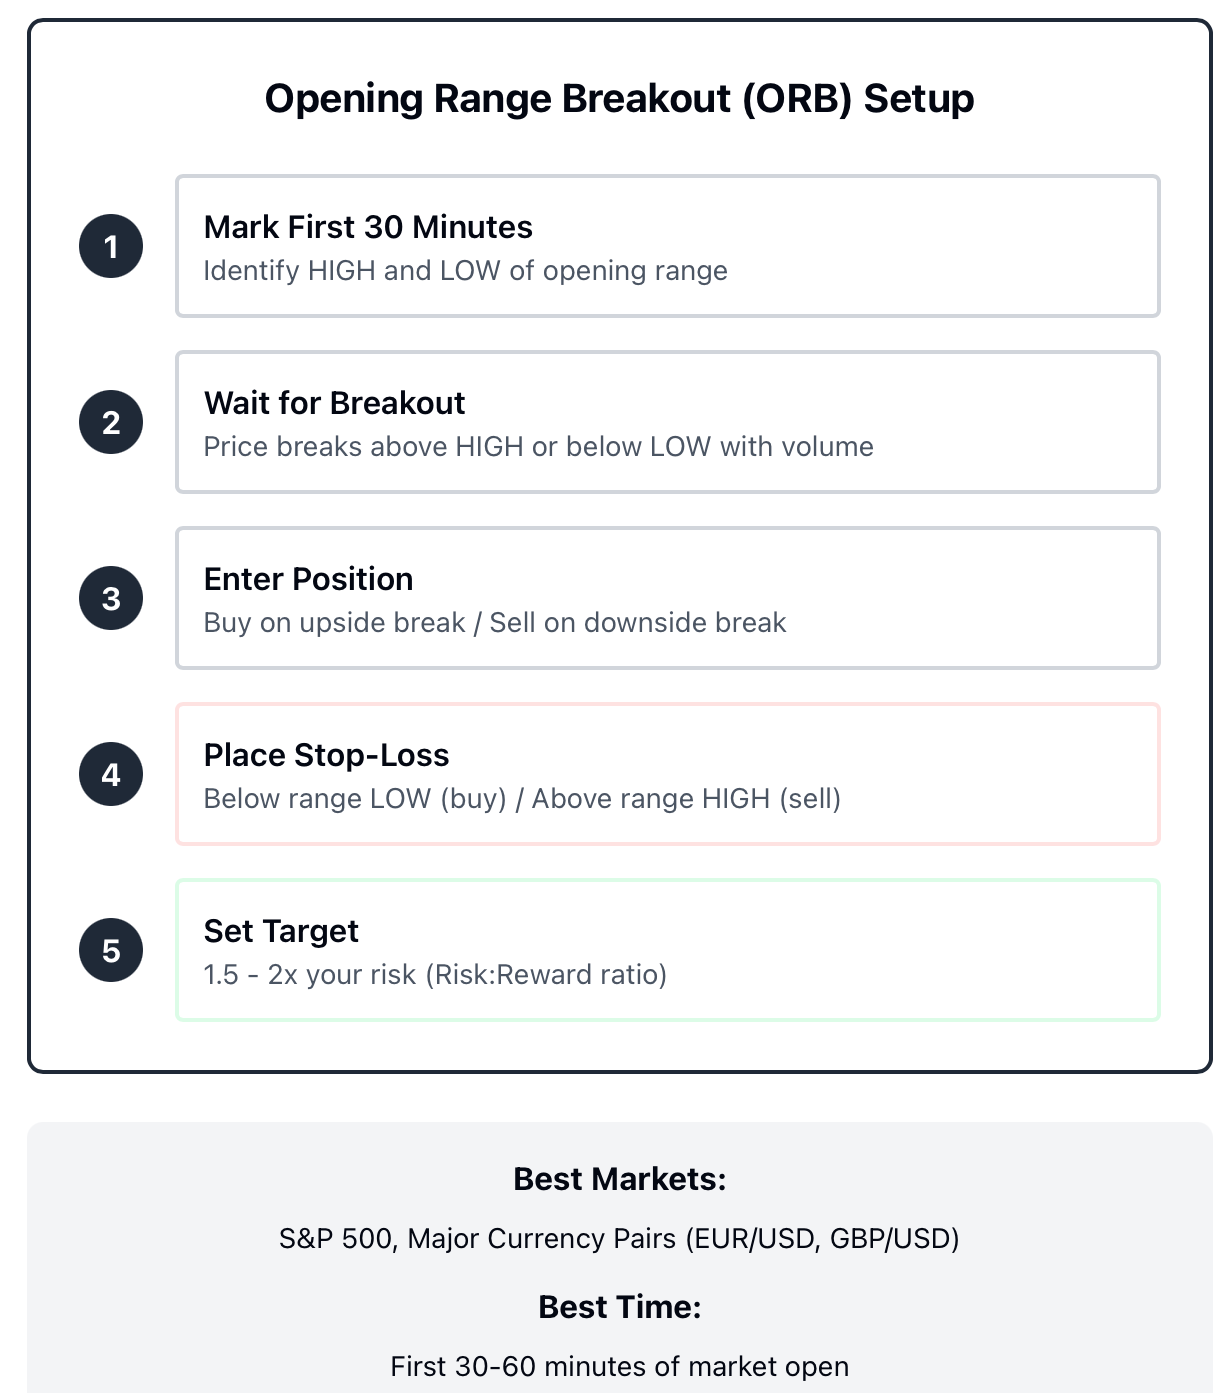
To trade the ORB, mark the high and low of the first 30 minutes of the new trading session with a marker or arrow. Once the breakout occurs, you place your order to buy or sell. You place stop-loss orders below the range low (if buying) or above the range high (if selling). Target a profit 1.5 - 2 times greater than what you risked.
The S&P 500 forms a similar trading pattern almost every day within the first hour of US trading: a range is created, the breakout occurs, and momentum continues after the breakout.
Strategy 2: Liquidity Sweep and Reversal
The liquidity sweep and reversal strategy is not used in the stock index futures market, as it tends to work best in the forex and cryptocurrency markets. This system is based on the stop-hunting strategy previously discussed. Recognising an early level would be something along the lines of: The low yesterday, a recent swing, or any round number such as 1.1000 – EUR/USD. When the price moves through this established level, it would typically spike (up or down), hunt for liquidity, and reverse immediately.
The critical part will be that, following this level being swept, there must be a reversal. The price will not “spend” an extended period below this level. Price will quickly pass it below, grab the liquidity (stop-losses) that were activated, and then return to the established trajectory.
You will then enter the reversal. The stop will go slightly beyond the point where you expect the reversal to occur, and the target will generally be the opposite side of your most recent range.
This trading strategy does not focus on predicting what price does with the information available; rather, it focuses on identifying a pattern associated with consuming liquidity.
FAQ: In hindsight, you recognise the liquidity sweep. With time and practice, you will learn to identify the liquidity sweep as it occurs.
Strategy 3: Trend-Day Pullback
Best for trading index CFDs during index trends. There are days when markets move in a consistent direction (trend). On trend days, the market, in general, opens with a gap, momentum builds, and pullbacks remain relatively shallow. Trend days are relatively few; however, they are one of the most profitable if you can take advantage of the trend correctly.
As a trader, the most common mistake is to enter into positions at the points where the trend is at its highest or lowest. Therefore, you need to wait for the first significant pullback to occur at the SMA or to a minor support level.
You will then enter into the trade as the price moves away from the pullback. Set your stop at a price slightly below the low of the pullback and target the next significant price extension in the trend.
An analogy that best illustrates how you should view this type of day-trading strategy would be an event such as a concert. When you are at the concert, the line keeps getting longer. You will typically find a time when the line is fairly stable, so you would step into it. You would continue moving forward where you left off as the price moves back up.
Less Is More: Why Simple Day Trading Strategies Outperform Complex Systems
Trade with confidence knowing you’re not alone in seeking out ways to improve your execution - many traders believe that stacking up indicators on multiple time frames or developing intricate decision trees equate to successfully executing their trades. That is, until they become frustrated when their ambitions of executing real-time trades never seem to pan out successfully. It is a matter of fact that decision fatigue sets in very quickly on a high-frequency trading platform, as each indicator measures out different aspects of market movement.
With the use of price action trading, we strip down the decision-making process to three variables: price, time, and risk.
Price provides the trader with an indication of activity on the market; Time allows us to see the right moment to take action; And lastly, we determine what our risk tolerance level is before we take action.
The price chart is the only chart you need to focus on when making your trade decisions, as it is the only chart providing you with current activity on a security.
Consider this example with the two charts:
The first chart is covered with moving averages, Bollinger Bands, RSI, MACD, volume, and Fibonacci levels. The second chart is 100% price bars with one key level on the chart. Which chart would provide you with a quicker response time when it comes time to enter your position? The price chart is updated every time.
Professional traders use a naked price chart and recognise that price patterns and strength levels are more important indicators of market movement than anything else; they look for signs of price behaviour at significant support and resistance levels, whether it is a breakout, a hold, or a reversal. All of this information is on the price chart.
An easy way to think about it is to compare driving a motorcycle with a poor dashboard alert system to one with only a few alerts. If you had too many notifications, your attention would be diverted from the road to the notifications and ultimately lead to an accident.
Price action Trader focus solely on the price, and therefore are not distracted by unnecessary alerts that will slow down their ability to make decisions and execute their trades.
All tools have a place in the world of trading, whether you use them in conjunction with your strategy or not. A single moving average can provide insight into trending vs ranging conditions, while key levels of support and resistance help determine how much to risk while taking a position based on market activity.
However, valuable tools should always add clarity and not simply create the illusion of control!
When approaching trading, be aware of the pitfalls of thinking that the more sophisticated your trading system, the better you will execute your trades. Consistency is the key to success because a simple day trading strategy executed with discipline over and over again provides a higher rate of return than a more complex strategy executed only a few times due to uncertainty.
The most successful traders are those who have mastered the few key tools of their craft rather than attempting to create or rely upon more sophisticated or complex systems.
Timing the Market: How Trading Sessions Define High-Probability Day Trading Strategies
Consider the Importance of the Price Action; however, it is more important for you to be in the right place at the right time.
The same trading strategy that would be unsuccessful if executed during the Asian timezone could succeed through the higher levels of liquidity and activity that exist during the London-New York time frame.
There are 3 primary trading sessions in the world's financial markets. They are:
-
The Asian session (Tokyo)
-
The European session (London)
-
The North American session (New York)
Each of these timeframes has its own characteristics, traders, and volatility levels.
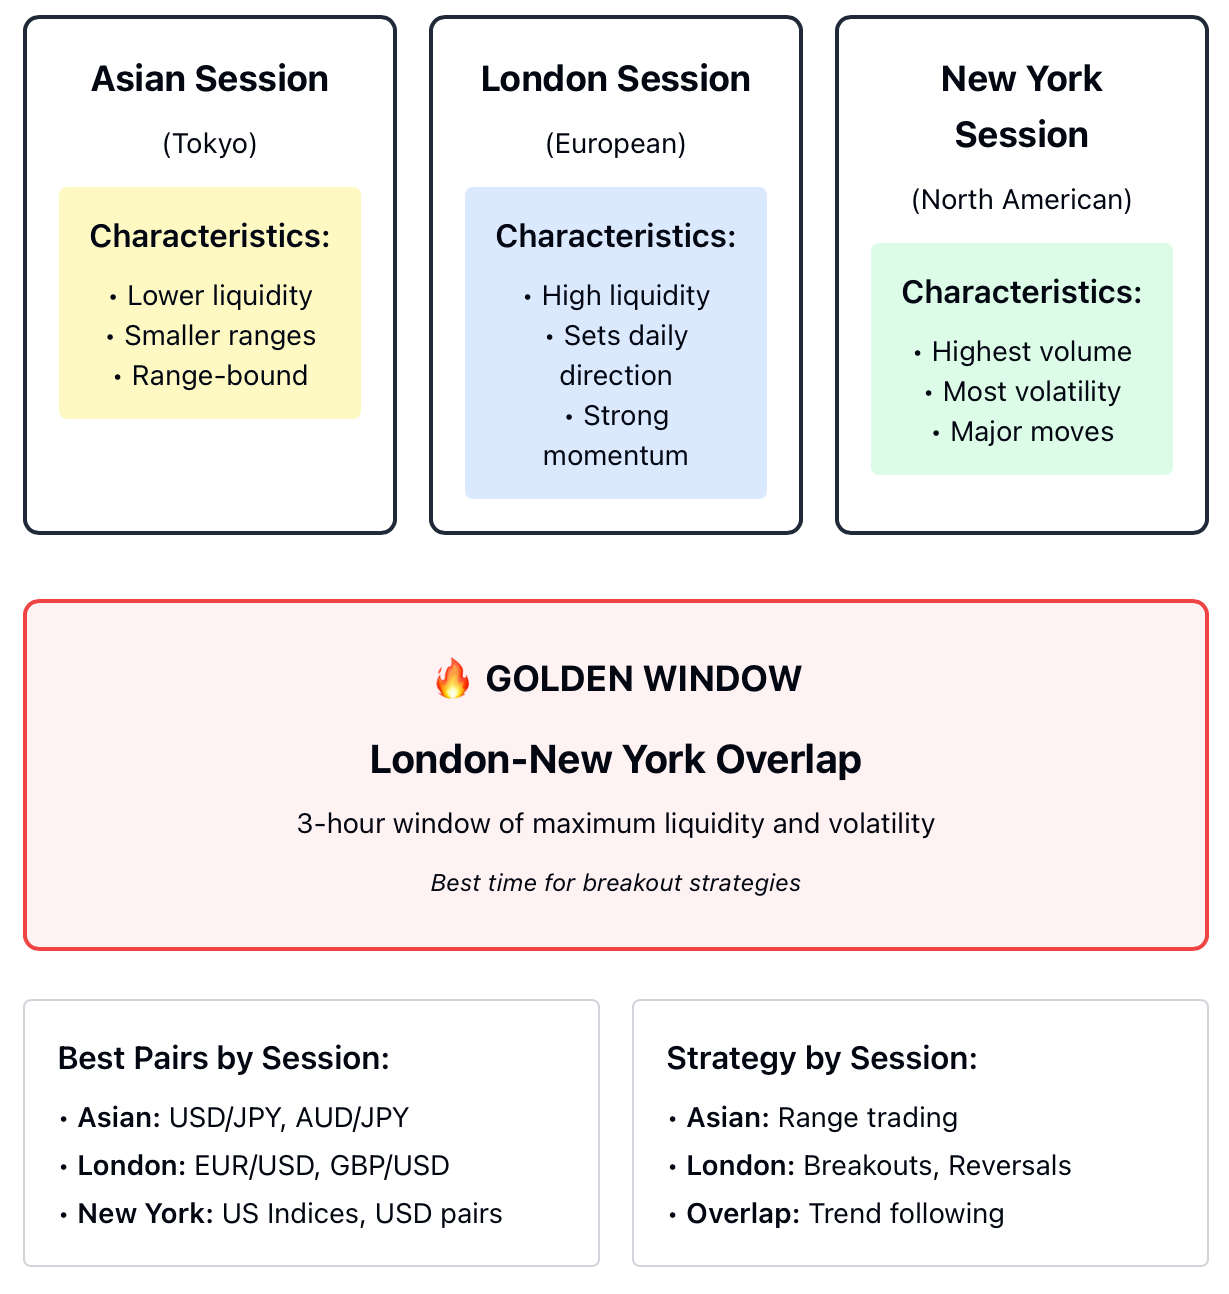
The market is typically quieter during the Asian session and, therefore, price ranges are smaller. As such, it is more appropriate to trade range-trading strategies during this time than breakout strategies. Major market moves typically do not happen until after the London session begins.
As traders enter the European market during the London session, the market becomes more liquid, causing the volume to increase, and thus leading to the price moving with a higher level of conviction. The opening of the London session is typically when the market's direction will be established for the rest of that trading day.
Once the North American session begins, there exists a 3-hour window in which both the London and North American sessions are operating concurrently. This overlap creates the highest levels of liquidity and volatility that exist within a 24-hour trading cycle.
If you are trading any of the top Forex pairs that occur daily, you should pay close attention to the timing of these sessions. When you compare GBP/USD during the Asian session compared to the London session, you will see that GBP/USD performs much better due to the increase in participation and liquidity.
When it comes to EUR/USD, when EUR traders "wake up," that party begins for EUR/USD.
Remember that this is not about creating a prediction. It is simply a matter of probabilities. As you trade into higher levels of liquidity, you will see a greater number of trades that have a high probability of follow-through after the trade is made.
A breakout during North American trading hours has a higher degree of probability of continuing following through than a breakout during 3 AM during Asian trading hours, because the breakout occurs within a larger volume of trades, momentum and number of participants.
By aligning your instruments with the best possible trading windows, you will be able to take GBP/USD trades during the London session and USD/JPY trades during the overlap of the Tokyo and London sessions, and trade U.S. indices during the North American session.
It makes sense to do your shopping in the early morning rather than just before the stores close. The same type of analysis applies to day trading strategies and, therefore, will ultimately improve your success rate without having to change any part of your trading strategy.
Risk Management in Day Trading: Why Survival Beats Winning More Trades
Both statements are correct. One can be profitable in the long term even if they do not win on 60% of their trades, as there is a wide range of win rates from which a profit can be made. However, because a trader who is not able to manage risk appropriately will eventually fail (regardless of their win rate), managing risk should be a trader's first priority.
A trader's maximum drawdown (MDD) is their most important statistic. Most traders who experience an MDD of 40–50% never recover fully from that level; not because they lost their ability to trade effectively, but rather because they lost their psychological stability.
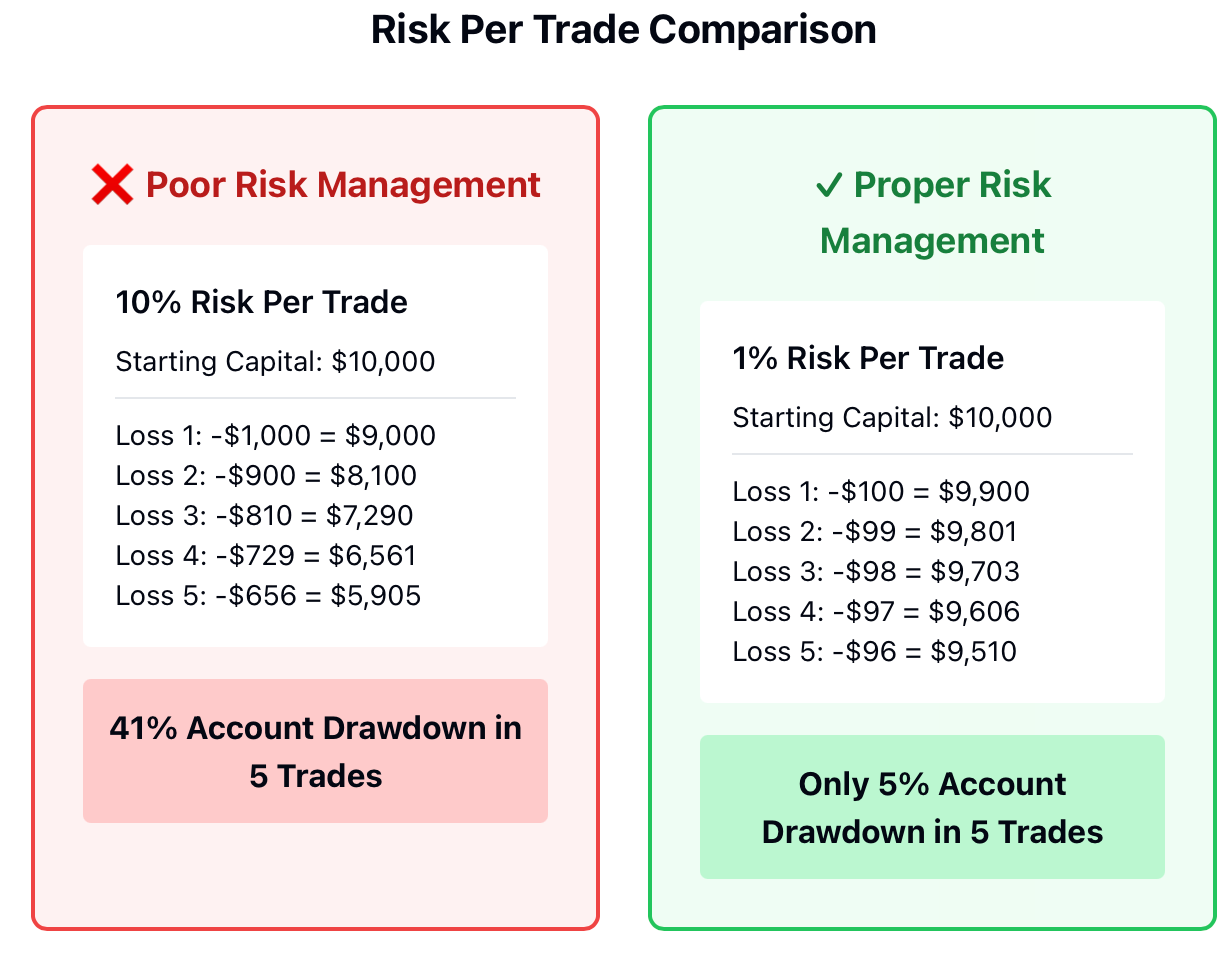
Because of this, it is critical that a trader sets a fixed risk per trade so that a trader can survive a string of losses without being destroyed by excessive risk. For example, if a trader has established that they are willing to risk no more than 1 or 2% of their total capital on any trade, then they will be able to withstand a loss of 20 or 30 trades without being put in a position where they will no longer want to trade. If a trader risks 10% of their total capital on a trade, after 5 losing trades, they will have lost half of their account value.
The mathematics of the risk-to-reward ratios function the same way. If you have a risk-to-reward ratio of 1:2, and you are trying to generate $200 with an investment of $100, you would only need to win 35% of your trades to break even after the associated costs. If you win 40% of your trades, you will be profitable, and if you win 50% of your trades, you are making money.
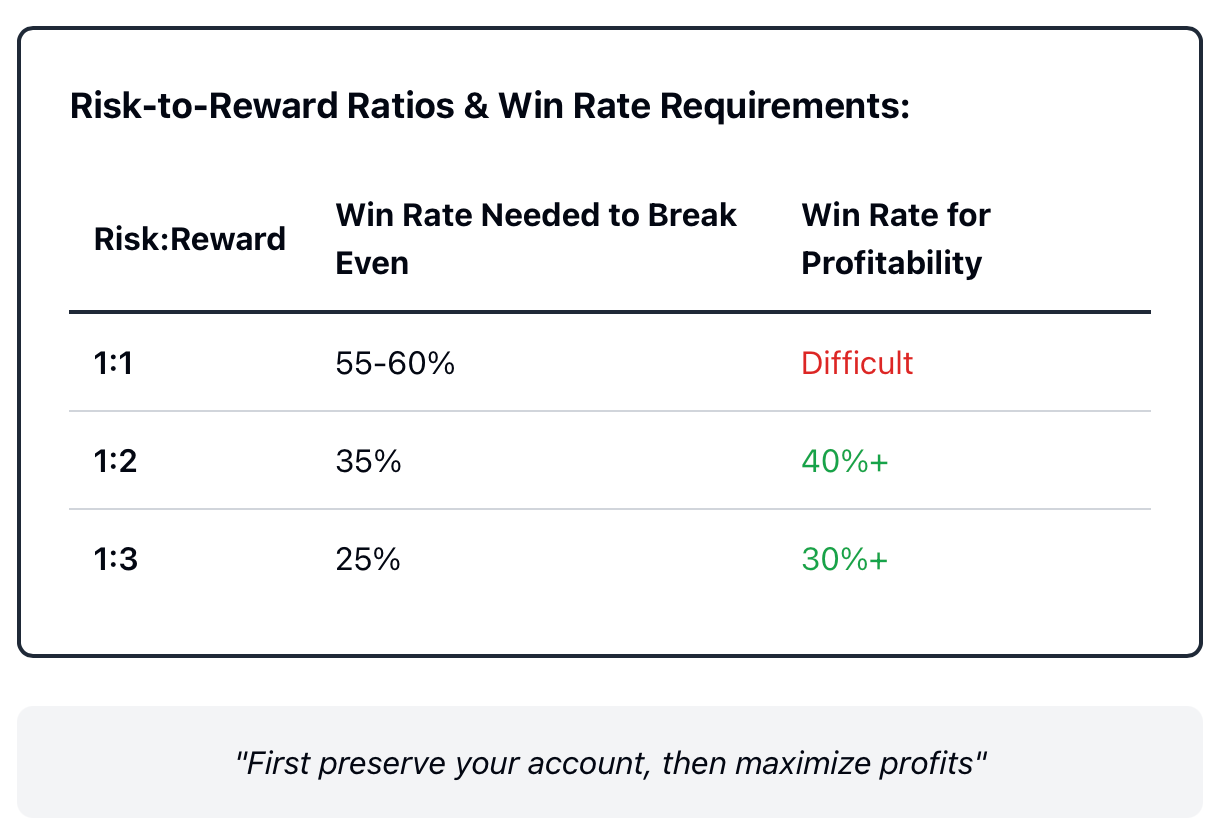
If you risk $100 with the idea of trying to generate $100, you would need to have a 55% to 60% win rate on your trades to break even after accounting for the associated costs.
All successful long-term day trading strategies have the same underlying principle: first is to preserve your account, and second is to maximise profits. The guiding principle of all day trading strategies is not to maximise profits, but rather to preserve your trading capital.
Having the capacity to size your positions correctly is more critical than having perfect entry points. For example, if a trader has entered a trade at a price that is close to the average price of the underlying asset, but has sized their position correctly, they will be able to withstand any eventual losses. However, if a trader has entered a trade at the right price but has sized their position recklessly, there is a good chance they will lose their entire trading capital due to one bad trade.
There is a clear distinction between sizing based upon fixed risk and sizing based upon a fixed amount of position. Sizing on fixed risk means the position is based upon the distance between the entry and stop loss price, while sizing based upon a fixed amount of position means the position will be the same amount each time, regardless of the stop distance.
Sizing based upon fixed risk is much more advantageous than sizing based upon fixed-position amount. To illustrate, if you were at risk of losing 50 pips and have a max drawdown of 10%, it would be necessary for you to size your position smaller than normal to maintain the same 1% risk for your position.
Using fixed-risk sizing will prevent traders' maximum drawdown from exceeding the excessive amount of risk to which they are exposed. Fixed risk will also provide the trader the greatest ability to protect themselves from large stop losses, and to maintain uniform exposure throughout the entire account.
Most traders get too focused on their entries and exits while not focusing on keeping the edge on their fixed-risk sizing, MDD limits, and daily loss limits. Establishing these limits for success will allow a trader to develop their trading skills.
Execution and Psychology: The Hidden Edge Behind Consistent Day Trading Strategies
The best strategy can still fail, making the divide between knowing and doing a greater downfall to traders than any bad strategy could.
Why is this? It is due to the amplification of emotions when trading intraday. Since every tick is real-time and time-sensitive, the trader feels an urgency with every decision. The time frames for fear and greed are now condensed into minutes versus days.
The reason for this is, it creates predictable psychological traps for traders. Some examples include: revenge trading after a loss, oversizing your position after a win, taking profits too soon on winning trades, and holding losses too long in the hopes of a reversal. Every trader goes through these cycles; however, the difference is in the point you recognise this pattern and stop it.
Keeping a journal has proven to be a very effective aid for traders; journaling not just your trades, but also your emotional condition while you are trading. Were you tired? Were you angry from a previous loss? Were you trading just for the sake of trading? When you review your journal, patterns of behaviour become apparent.
Many traders do not keep journals because they do not feel it is necessary. This leads to repeating the same mistakes for an extended period without being aware of the reasons for those mistakes.
To build discipline while under pressure, it is very important to think about the process rather than the trading results. You can follow your trading plan flawlessly, and still lose money on the trade, or you could disregard your trading plan and win money on the trade. In the long run, the results of your trades have no positive or negative impact on your process.
The most important thing to focus on is whether or not you adhered to your trading plan. Did you wait for your trading setup? Did you size your position correctly? Did you exit your position at your predetermined profit? If you answer yes to all three questions, then you have successfully executed your plan, regardless of whether the outcome was profitable or not.
This shift in thinking is often difficult to adjust to at the beginning. Your trading balance does not take the trading process into consideration. However, it is the trading process that dominates all trading results over more than 100 trades, as opposed to the noise created by short-term trading results, that is the only factor to determine the quality of your trading process.
There is no separation between trading psychology and trading strategy; trading psychology is the basis on which you will be able to follow through with your trading strategy when your money is at risk.
Discipline is the true alpha of all day trading strategies. While many traders learn the trading setups, only a few traders know how to execute those trading setups consistently under pressure.
Final Thoughts: How to Build Your Own Sustainable Day Trading Framework
In summarising everything that is covered, day trading strategies are a system, not a shortcut to being successful. The first step is to have a mental shift. Stop predicting and start identifying likely forced exiting points and liquefied zones. You must change the way you think about the market; replace guessing with reacting.
Once you have made a mental shift, you can structure your system. Pick the type of framework you want based on your available time. For example, if you have a couple of hours in the mornings during opening times, you may want to utilize Opening Range Breakouts (ORBs). If you're able to monitor important levels throughout the day, then you should use Liquidity Sweeps (LSs). If you're able to monitor price behaviour during volatile sessions, then Trend Pullbacks should be your framework.
Execution is the fourth piece of this system. Your execution will determine everything else in your trading system. Risk Management, Position Sizing, and Psychological Discipline are all much more important than your entry technique. You must focus on survival first. Profits will come after survival.
What you're reading above is not motivated rhetoric. It is how markets actually work.
Many traders fail because they apply the order in reverse to the way these items are actually structured. They start with execution, by purchasing training courses or following trade signals copied from other traders, and then try to build a structure around all their random trades instead of creating the correct mindset to support the structure they create.
You need first to develop your ideas about how to manage risk before structuring your system to encompass risk management, and only after doing that can you begin thinking about how you're going to execute the trades.
Once you've the right tools in place to implement the principles stated above, you can start to put these principles into action with demo accounts so that you can test your framework without any risk. Also, through tradewill.com demo accounts, you can learn how to spot the patterns mentioned throughout the article through educational resources. Finally, once you're ready to start participating in the actual markets where those day trading strategies work best, you can use contracts for differences (CFDs) to do so.
Remember, the tools you have at your disposal, as well as the education you receive, will play a significant role in enabling you to take advantage of these strategies.
Disclaimer: The content of the blog does not represent any position of Trade W, does not serve as any trading-related decision advice, and does not endorse any third-party.