
 Trade W

Some traders hear “diamond pattern” and think of a sweater design, but in trading it means something very different. The diamond pattern is a rare chart formation that can signal an upcoming reversal in price. Missing a diamond top can mean missing the early warning before a sharp move lower. Identifying it early can help traders position themselves before the broader market reacts.
This article focuses on the diamond top pattern.
Definition of the Diamond Top Pattern
The diamond top pattern is a bearish reversal pattern that forms near the end of a strong uptrend. It is called a “diamond” because the price structure resembles a diamond shape on the chart, with the middle section expanding outward and the beginning and end narrowing inward.
In simple terms, price initially begins making wider and wider swings, creating an expanding pattern. Then those swings begin to narrow, forming a contracting pattern. Together, these two phases create the diamond shape.
The reversal is typically confirmed when the price breaks below the lower trendline of the contracting portion of the pattern.
The diamond top pattern is considered rare because the volatility conditions needed to create it do not occur often. However, when a diamond top does appear, it can precede a significant move lower, which is why many traders pay close attention to it.
The Structure: What You're Actually Looking At
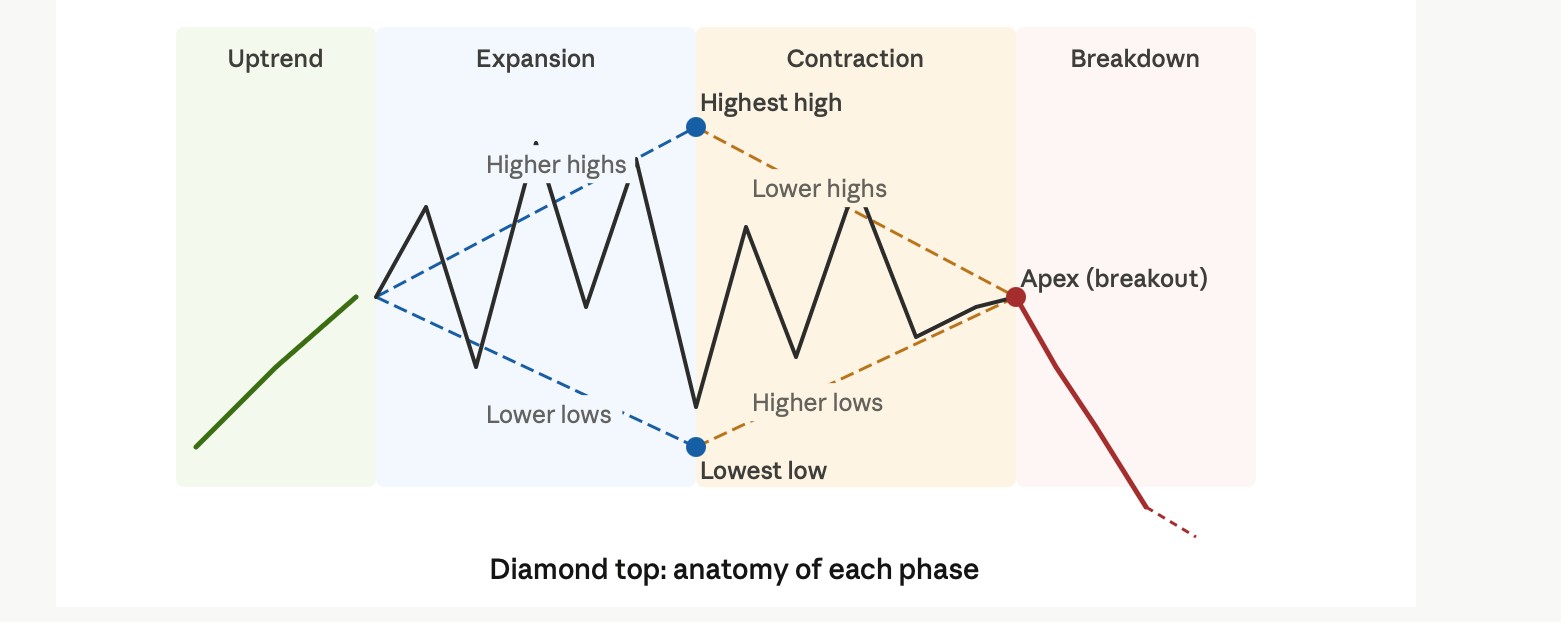
A diamond top is made up of two distinct halves. The first half is an expanding triangle, where price continues making higher highs and lower lows. The swings become larger with each move, reflecting instability and growing volatility. During this phase, both buyers and sellers remain active, and price action becomes increasingly stretched in both directions.
The second half transitions into a symmetrical triangle, where those price swings begin to tighten. Swing highs start coming in lower as buyers begin losing momentum. At the same time, swing lows begin forming higher as sellers are no longer able to push price down as aggressively as before. This tightening range creates pressure as the pattern approaches resolution.
To identify the full structure, traders typically draw four trendlines: two around the expansion phase and two around the contraction phase. Together, these lines form the diamond shape. The apex, where the two contraction trendlines meet on the right side of the pattern, represents the point where the market is approaching a decision.
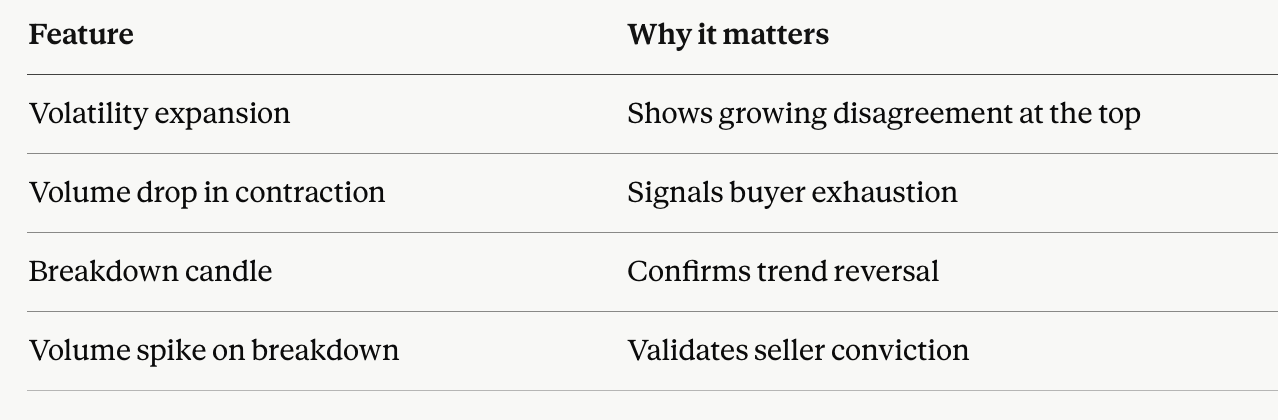
Volume often provides additional confirmation. It may increase during the expansion phase as volatility rises, then gradually decline during the contraction phase as the range tightens. When the price finally breaks down below the lower boundary, traders often look for a volume spike as confirmation that sellers are committing to the move.
The Market Psychology Behind It
Understanding how a diamond top forms makes it much easier to recognise the pattern in real time.
A diamond top typically begins with a strong, healthy uptrend. Buyers are in control, price is moving higher, and overall market sentiment is bullish. As prices continue rising, however, new buyers often become less willing to chase the move, while earlier buyers may begin considering taking profits.
At that point, the pattern starts to form through growing disagreement between buyers and sellers. This uncertainty often leads to wider and more volatile price swings, with neither side able to take clear control. Institutions may begin reducing exposure by selling into rallies, while retail traders continue chasing momentum. The result is the expansion phase, where price swings become increasingly broad and unstable.
Eventually, the market begins to lose energy. Volatility starts to contract as both buyers and sellers become less aggressive. Fewer traders are willing to open new positions, volume begins to decline, and price action starts tightening into a narrower range. This creates the contracting side of the diamond pattern.
The breakdown occurs when sellers regain control, and the price closes decisively below the lower contraction trendline. Because the market is often still near recent highs and sentiment remains bullish from the previous uptrend, many participants are caught off guard by the reversal. That shift in positioning can add momentum to the move lower once the breakdown begins.
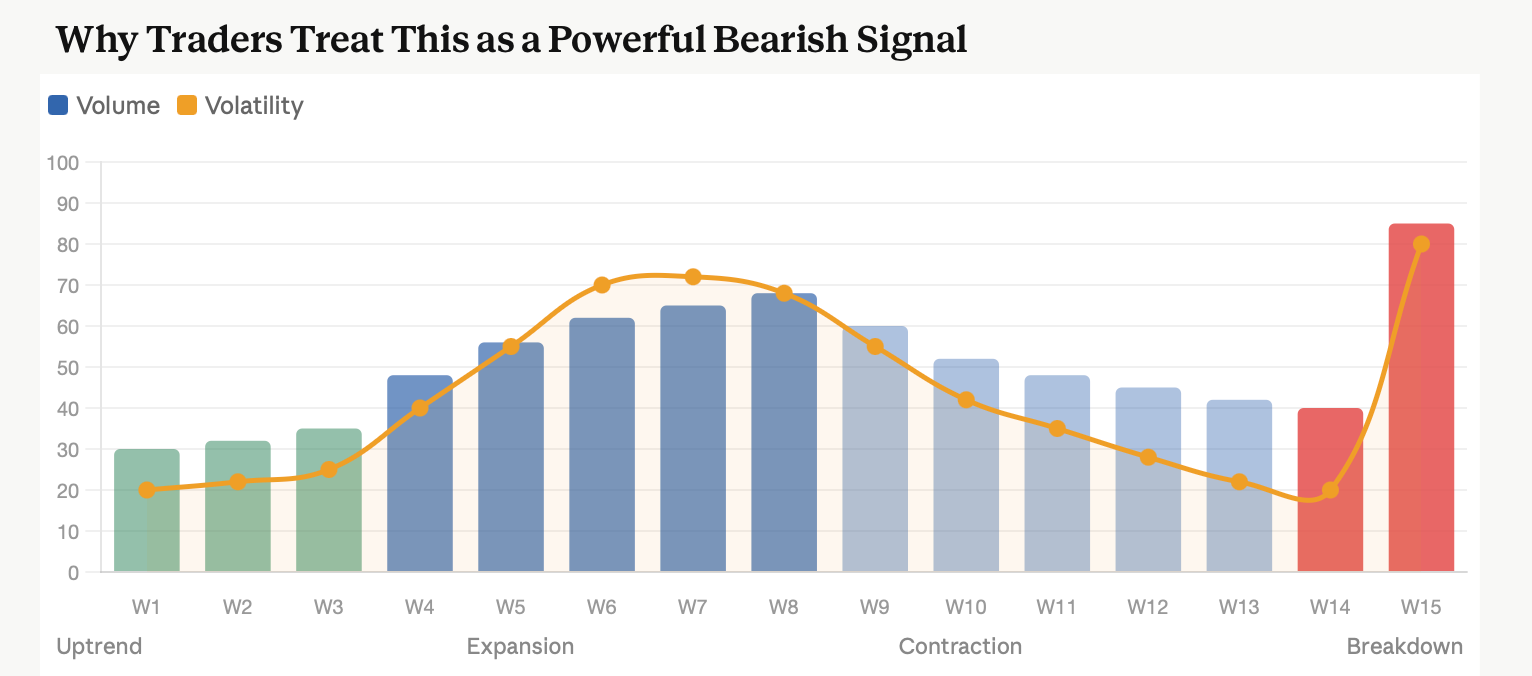
Traders pay close attention to the diamond top because it often confirms three important things.
First, a diamond top usually develops after a large and sustained upward price move. The stronger and longer that move has been, the more stretched buyers tend to become. Because of this, diamond tops that form after extended rallies generally carry more weight than those that appear earlier in a trend.
Second, volatility tends to increase as the pattern develops. The wide price swings seen during the expansion phase reflect growing instability in the market. Volatility often rises when buyers and sellers strongly disagree on value, and this tension can be an early sign that the existing trend is weakening. These broader swings often represent a real struggle for control between both sides of the market.
Finally, the breakdown itself tends to be decisive. By the time price reaches the contracting phase, the market has often tightened into a smaller range, and volume may begin to fade. When the price breaks below support, traders look for a clean and confirmed move through the lower boundary. This allows traders to react to confirmation rather than trying to predict the reversal too early.
This is one reason the diamond top attracts attention from traders. It offers a structured setup where the price action, volatility, and eventual breakdown all work together to signal that the prior uptrend may be coming to an end.
Two bearish reversal patterns that often create confusion for traders are the diamond top and the head and shoulders. While both tend to form near market tops, they develop in very different ways.
The head and shoulders pattern consists of three distinct peaks: a larger central peak, known as the head, with two smaller peaks on either side, known as the shoulders. It usually reflects a gradual weakening of buying pressure, where buyers begin losing momentum in a more structured and orderly way.
The diamond top tends to appear much more chaotic. Its early expansion phase is marked by wide, unstable price swings before transitioning into the tighter contraction phase. This creates the diamond shape and reflects a more volatile disagreement between buyers and sellers.
Where a head-and-shoulders pattern often suggests a gradual loss of momentum, a diamond top tends to reflect sharp instability and uncertainty at the top of a trend. It often signals a more aggressive struggle between buyers trying to continue the uptrend and sellers beginning to take control.
Diamond tops are less common than head-and-shoulders patterns, but they can sometimes lead to larger moves once the breakdown is confirmed. Head and shoulders patterns, on the other hand, appear more frequently and are often easier for traders to identify and trade systematically.
How to Actually Spot One on a Chart
Most guides leave out one of the most important parts of the diamond top pattern: how to identify it in real time.
The first thing to confirm is that the price is already in an uptrend. Without a prior uptrend, there is no diamond top. The pattern forms only after buyers have controlled the market for an extended period, and the price has already moved significantly higher.
As the pattern begins developing, price action often starts to widen. Highs become slightly higher than the previous highs, while lows begin pushing lower than the previous lows. These widening swings create the expansion phase of the pattern. At this stage, traders can begin drawing trendlines across the highs and lows to define the outer boundaries.
As the market starts losing momentum, price action begins tightening. Highs become lower and lows become higher, creating a contracting structure. This contraction phase gradually narrows toward a point on the right side of the pattern.
Once both the expansion and contraction phases are visible, the four trendlines together begin to form the diamond shape. At that point, the pattern may be considered in development.
Confirmation comes only after the price breaks below the lower trendline of the contraction phase with a decisive close. Many traders also look for increased volume during the breakdown for added confirmation. Entering before that confirmation can expose traders to false signals, especially if the price remains trapped inside the pattern.
Timeframe also matters. Diamond tops that form on daily or weekly charts generally carry more weight than those that form intraday. In general, the longer the pattern takes to develop before breaking down, the more significant the potential reversal can be.
How to Trade the Diamond Top Pattern
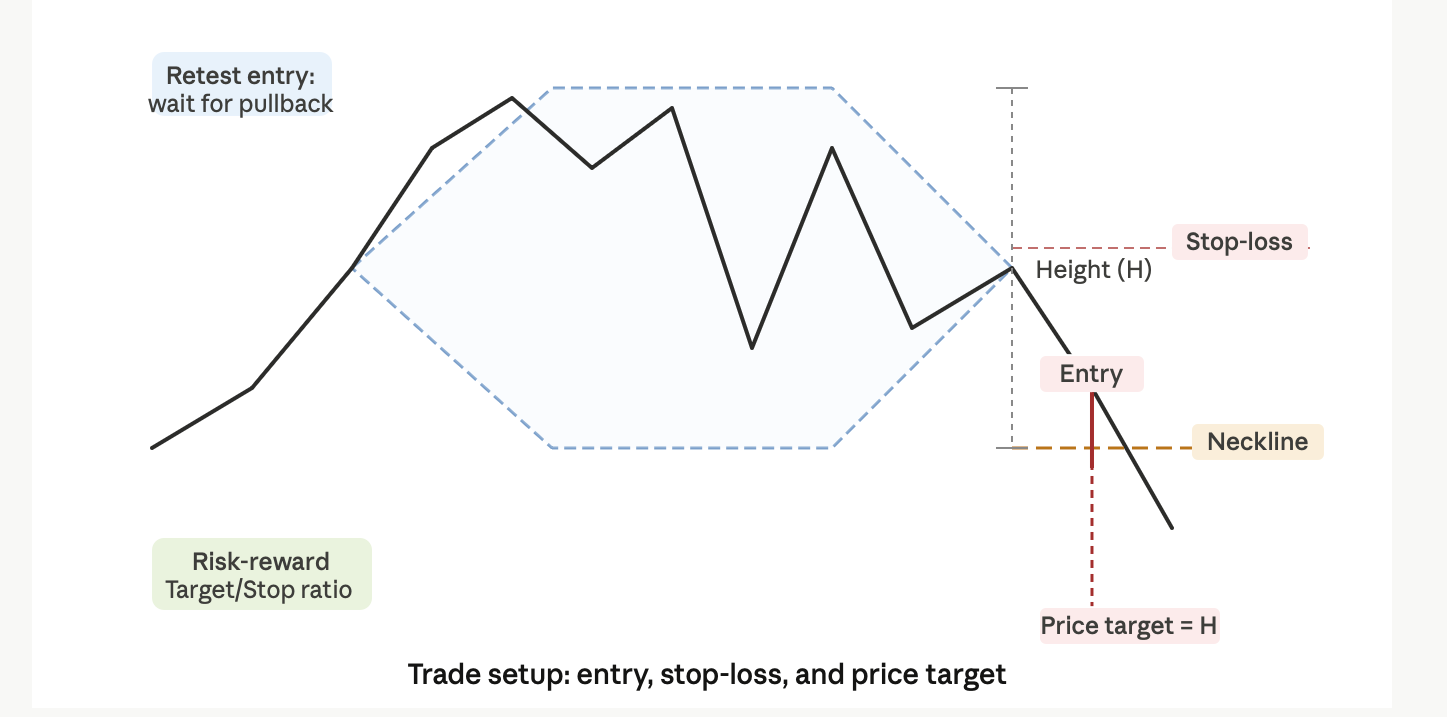
You can use one of two common entry strategies when trading a diamond top, depending on your risk tolerance.
Breakdown Entry Method
This entry is taken when the price breaks below the lower contraction trendline, often referred to as the neckline, with volume confirmation. Traders using this approach may enter on the close of the breakdown candle or at the open of the next candle. This is the more aggressive approach because it gets you into the trade earlier, but it can also carry a higher risk of false breakdowns.
Retest Entry Method
After the breakdown, the price will sometimes retrace back to test the broken support level, which can now act as resistance. This retest can offer a cleaner entry with lower risk. While you may miss part of the initial move, the benefit is often a tighter stop loss and clearer confirmation that the breakdown is holding.
Stop Loss
A common stop-loss placement is above the highest point of the diamond formation. If the price moves back above that level, the pattern is generally considered invalidated.
Price Target
A common way to estimate a target is to measure the height of the diamond, from the highest high to the lowest low within the pattern, and project that distance downward from the breakdown point. This projected move can be used as an initial price target.
Risk-to-Reward
Many traders look for a minimum risk-to-reward ratio of 1:2, meaning risking $1 to potentially make $2. A well-formed diamond top can sometimes offer larger setups, with risk-to-reward profiles of 1:3 or greater.
Mistakes to Avoid
The most common mistake is labelling any period of volatile consolidation as a diamond top. Not all choppy price action forms a diamond. You need to see the full structure: a clear uptrend leading into the pattern, followed by the expansion phase, then the contraction phase. Without all three, the setup is incomplete.
Another common mistake is trading before confirmation. A diamond top is not confirmed until the price breaks below the lower trendline of the contraction phase. Entering too early in anticipation of the breakdown can lead to getting stopped out if the price makes one more push higher before the reversal begins.
A third mistake is ignoring volume. Volume often plays an important role in confirming the breakdown. If price breaks below support on weak volume, the move may lack conviction and be more likely to fail. Many traders look for increased volume during the breakdown as confirmation that sellers are committed to the move.
Finally, traders often overlook higher-timeframe context. A diamond top forming on a lower timeframe may carry less weight if the broader market remains in a strong uptrend on the daily or weekly chart. Always check the larger trend before taking a reversal setup. Strong higher-timeframe momentum can sometimes overpower a lower-timeframe pattern.
The key is patience. Wait for the full structure, wait for confirmation, and always place the pattern within the context of the broader market.
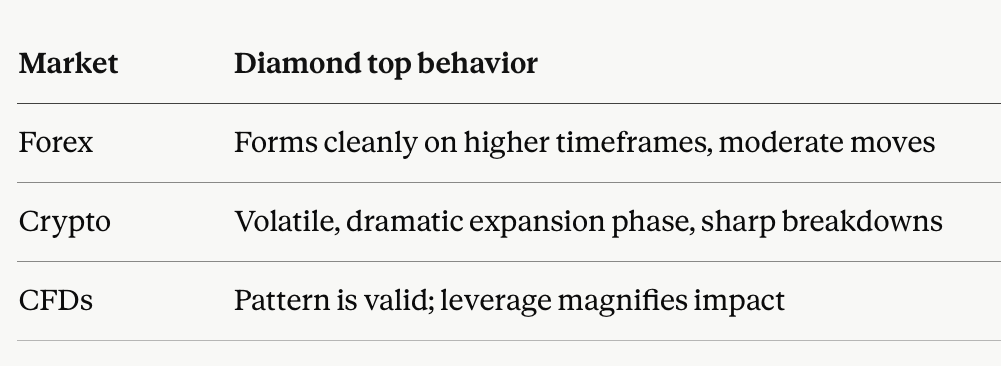
Diamond Top Patterns in Forex, Cryptocurrency, and CFDs
The diamond top pattern can appear across all liquid markets and is not limited to equities.
In the forex market, diamond tops are most commonly observed on the 4-hour and daily charts of major currency pairs such as EUR/USD or GBP/USD. Because these markets are highly liquid, price action is often cleaner, which can make the structure easier to identify compared with lower-volume instruments.
In the cryptocurrency market, diamond tops appear regularly due to the higher volatility of the asset class. The expansion phase can become especially pronounced, with wider price swings than those typically seen in forex. Bitcoin has produced several textbook examples of diamond tops near major highs, and the breakdowns that follow can often be sharp and fast-moving.
In the CFD market, the pattern can also be traded across indices, commodities, and individual shares. Because CFDs involve leverage, both potential reward and risk are amplified. A breakdown from a diamond top can create strong short-selling opportunities, but position sizing becomes especially important. Many traders manage this by sizing their trade based on the distance to their stop loss rather than on the pattern alone.
Regardless of the market, the pattern itself remains the same. The main differences are usually the speed of price movement, the level of volatility, and how aggressively price reacts once the breakdown is confirmed.
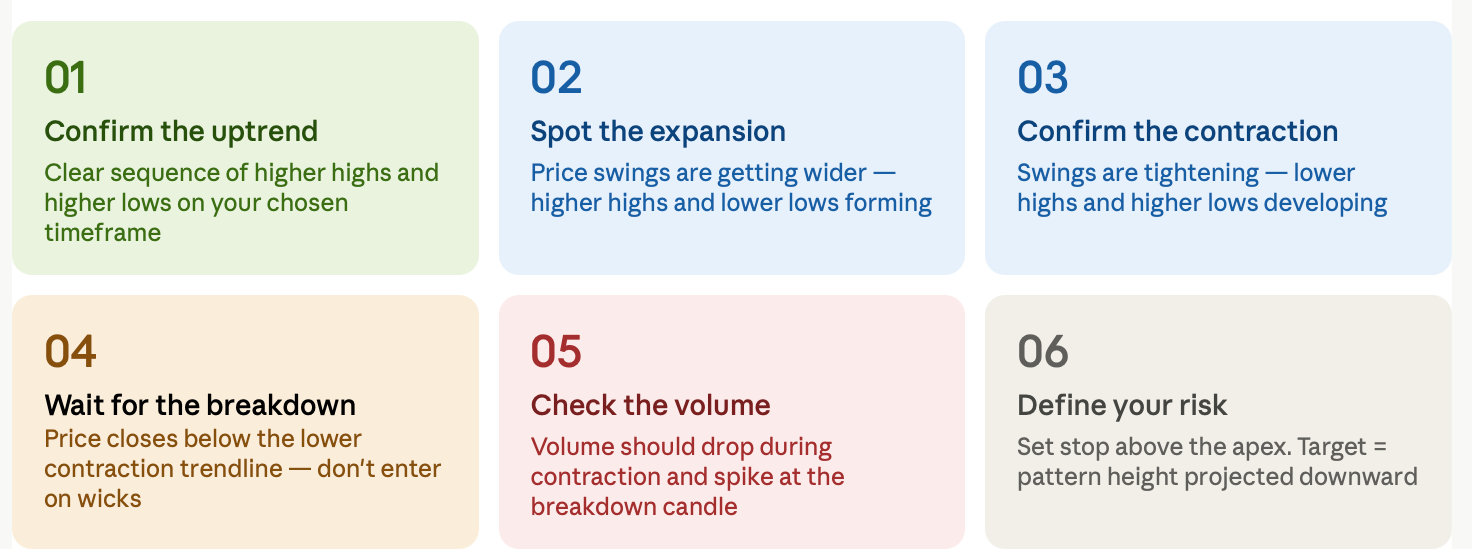
Your Diamond Top Trading Checklist
FAQs
What is a diamond top pattern?
A diamond top is a bearish reversal chart pattern formed by four trendlines, two expanding and two contracting, that together create a diamond shape near a market peak. It often signals that buyer momentum is weakening and a reversal may be approaching.
Is the diamond top pattern bullish or bearish?
Bearish. It typically forms at the top of an uptrend and suggests that price may move lower once the pattern breaks down.
How reliable is the diamond top pattern?
No chart pattern is guaranteed, but the diamond top can be a reliable reversal signal when confirmed with a decisive breakdown and strong volume. False signals are more common when traders enter before the pattern is fully confirmed.
How do traders confirm a diamond top breakout?
Traders often look for a decisive close below the lower contraction trendline, ideally supported by above-average volume. Some also wait for the price to retest the broken level as resistance before entering.
What’s the difference between a diamond top and head and shoulders?
A head-and-shoulders pattern forms with three peaks and usually reflects a more gradual weakening of trend momentum. A diamond top develops through a phase of expanding volatility followed by contraction, creating a more unstable structure. Diamond tops are less common, but the move after the breakdown can sometimes be sharper.
Why do some people search for “diamond pattern on sweater” instead of chart patterns?
Because “diamond pattern” is also used to describe textile and knitwear designs. Same term, very different chart.
Ready to apply this on live charts? TradeWill gives you real-time pattern alerts and charting tools built to help traders spot setups as they develop, not after the move is already underway.
Disclaimer: The content of the blog does not represent any position of Trade W, does not serve as any trading-related decision advice, and does not endorse any third-party.