

 Trade W

Every candlestick contains a story. Some induce momentum. Some denote hesitation. And some are completely void of motion with no favorability to either the buyers or the sellers, thus creating a stalemate between buyers and sellers. A doji is a great representation of this.
When you trade forex, cryptocurrencies, or CFDs, there will undoubtedly be numerous occasions where you will come across doji candles but will be unaware of their importance. This article outlines and explains each of the five core varieties of doji candles, explains the psychology behind them, and shows you how to utilise them in your trading so as not to become another victim of the classic traps that novices often fall foul of.
Firstly, a doji does not represent a trade signal. It never has and never will. The only thing that is of relevance is its location and the failure of movement that was exhibited before and after the doji candle. This is something you must remain conscious of while you read the remainder of this article.
What’s A Doji Candle?
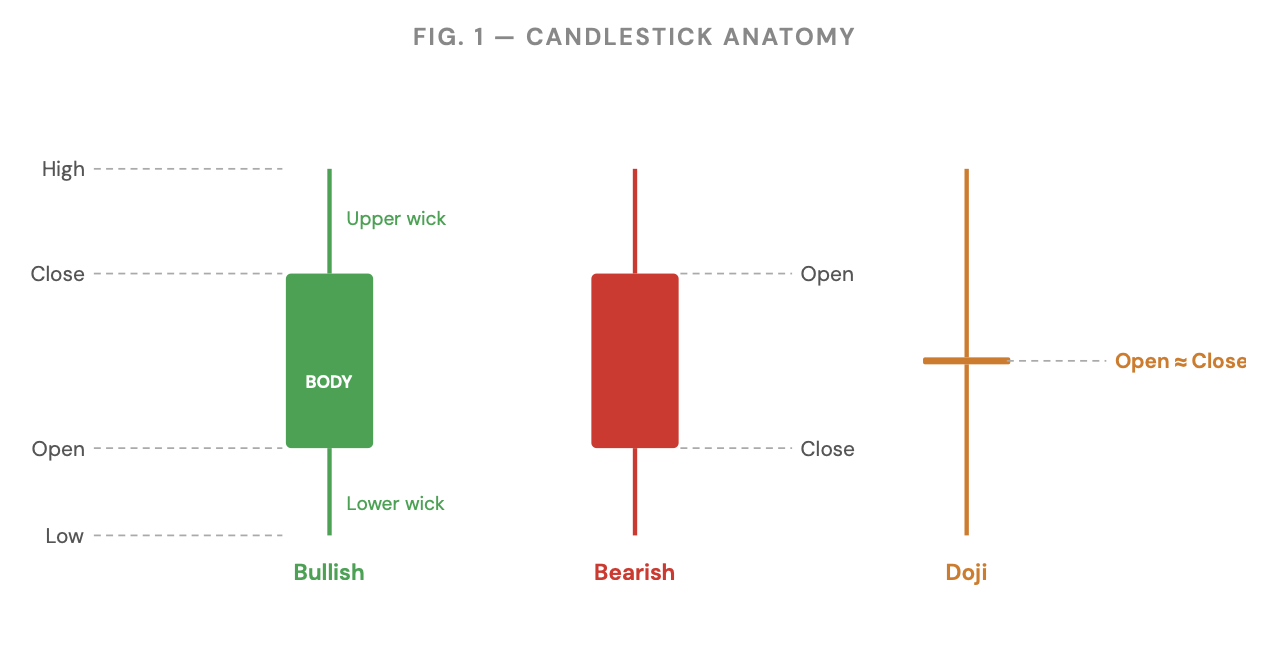
A doji candle is formed when the opening and closing prices of the candle are the same or very close. The candle will have very little or no body and long wicks above and below. In appearance, it will look like a cross or plus sign.
Psychologically, the buyers were able to push the price higher, and the sellers pushed the price back lower within that candle. In effect, neither the buyers nor the sellers had a winner at the end of the time period. It is like a game of tugging and pulling on a rope that never produced a winner.
Doji candles can occur during different market conditions, such as during transition phases of losing a trend, waiting for news, and/or the possible start of a big price move before breaking out. You will only be able to figure it out by looking at the surrounding context.
Important point: A doji alone does not indicate an impending reversal; it indicates that indecision is currently predominant in the market. The next candle will provide more information for making this determination than the doji will.
Doji Types And Their Importance
Not all doji candles have equal significance. For example, the significance of a doji that forms after a powerful uptrend of twelve candles on Bitcoin's daily chart is markedly different from a doji that forms when mid-range of an increasingly narrow range during consolidation for EUR/USD over five minutes.
Where the doji forms are of critical importance. A doji that forms at a major resistance level with declining volume is worth following. Conversely, a doji that forms in the middle of a tight range is noise.
When a doji forms, the key information provided to you by the market is that momentum has stalled, that buyers and sellers are approximately equal. The direction of the next move in the market will depend on which side steps back into the market with the most vigour. Doji patterns with greater price ranges, such as long-legged dojis, indicate that there was an intense battle between buyers and sellers. Similarly, doji patterns with smaller price ranges, such as four-price dojis, indicate there was little movement in the market.
Overview Of 5 Different Types Of Doji Candles
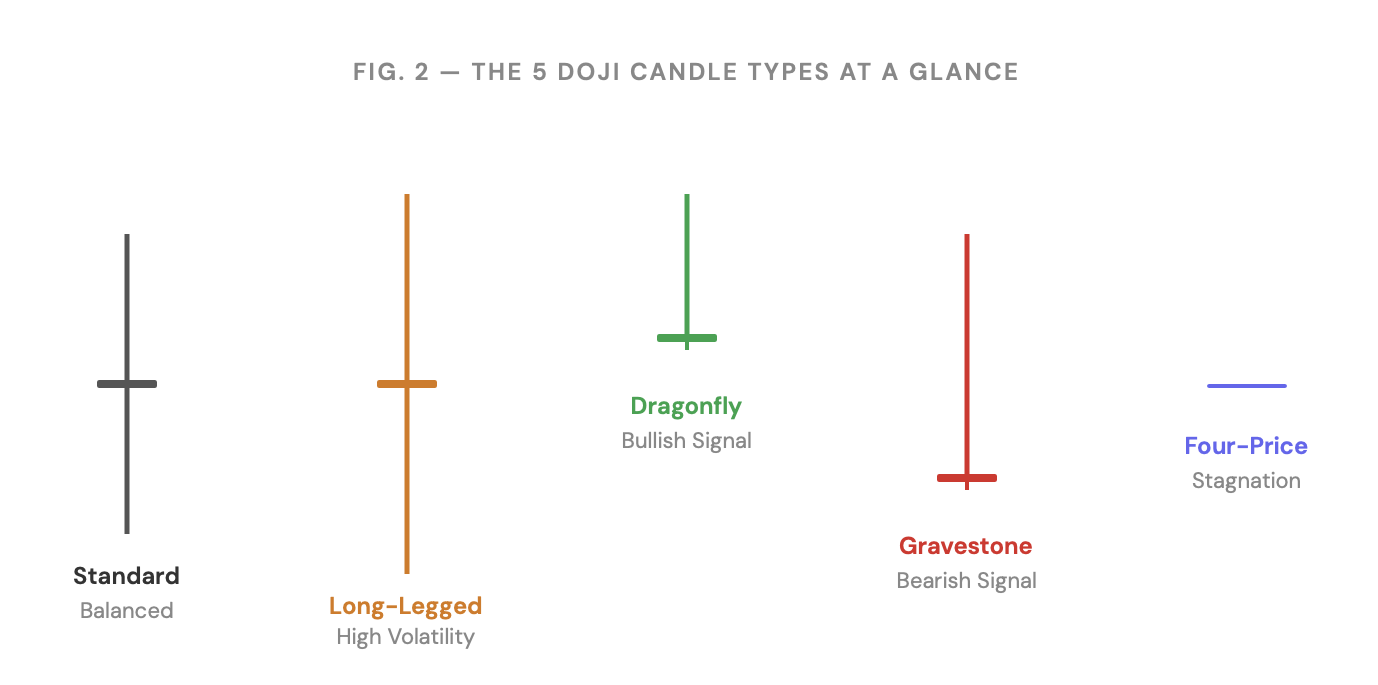
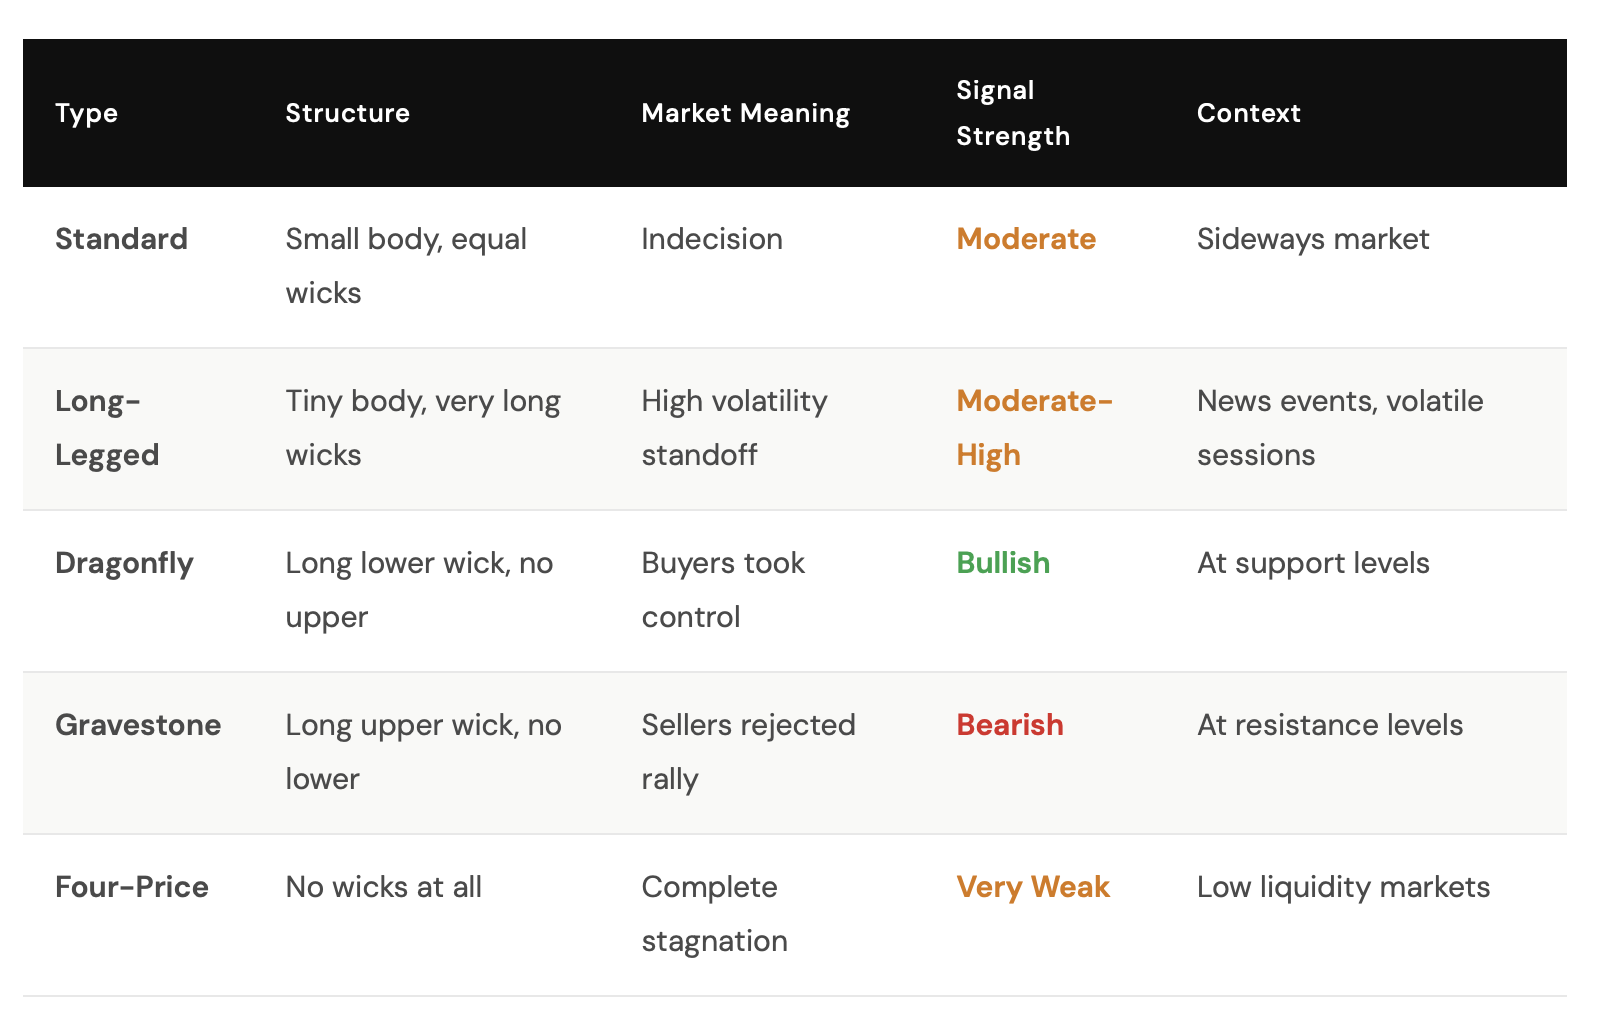
Doji candle types include classifications based on the length and placement of wicks around the doji itself. Here is a brief overview before we provide more detail for each type of doji candle.
Standard Doji - The classical indecisiveness indicator
A standard doji has approximately equal upper and lower "wicks" with virtually no body. Standard doji represents where the market failed to make a decision; therefore, it is the most common and simplest type of doji pattern.
Standard doji patterns generally emerge during consolidation phases (periods of price coiling), before the breakout of the market. A doji occurring in the middle of a price range has very little significance, while a doji appearing after a strong trending candle at a major level indicates the area where the market will pause to gather itself before continuing either upward or downward.
Signal strength is mediocre at best: It is important to wait for confirmation with the first candle following the doji prior to entering into any trades.
Long-Legged Doji - A battle of volatility
A long-legged doji is evident because both wicks are notably extremely long to either side. The price action has travelled long distances in both directions before closing back where it started or opening.
Because of this form of doji, inclement weather developed and created mass price swings - this will occur most typically when a major news event has occurred and created volatility. Long-legged doji candles are often seen with gold when related and/or unexpected reports have been released.
The message behind this doji pattern is highly amplified uncertainty. The length of the wicks does not suggest there was added traffic in the market; it indicates the market could not find a price consensus. This can be a significant indicator if it appears after an extended trend.
An example: Bitcoin, following a major announcement by a global regulatory organisation within the cryptocurrency space, creates considerable uncertainty and can be seen exhibiting long-legged doji 4-hour bars with wicks that range between 5%-8% from the closing price.
Significant Price Reversal — Dragonfly Doji
A dragonfly doji has a T-shape with price opening lower, falling to its low point for the day's trading session and recovering fully back to its opening price at the end of the day's trading with an average daily price return. The dragonfly doji has no upper wick, indicating that sellers tried unsuccessfully to sell the security but were unsuccessful.
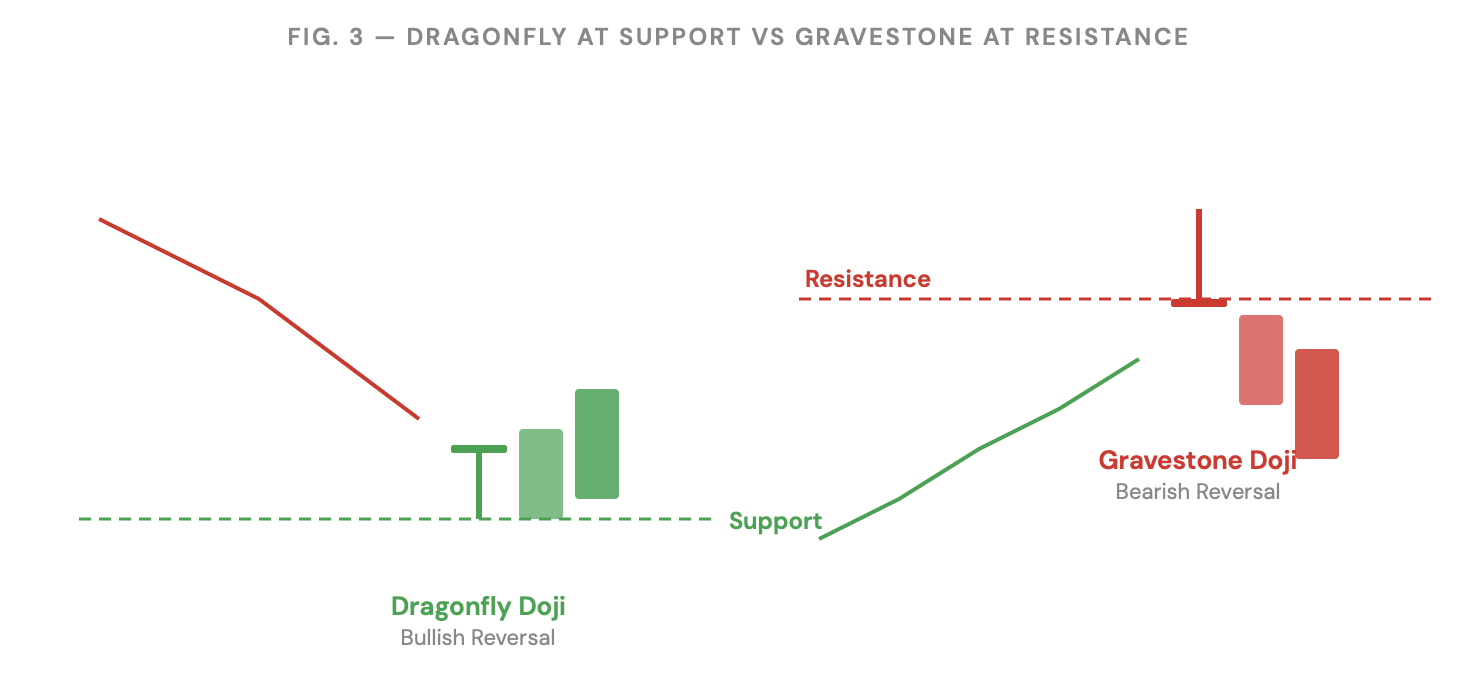
Overall, the dragonfly doji is the most bullish price reversal candlestick of the five major candlesticks, as it provides specific market evidence of sellers losing their ability to control the price of the security. When it appears at a major support zone, it may be used as a stronger candlestick price reversal indicator based on the strength of the dragonfly doji candlestick.
Gravestone Doji — Sellers Rejected the Rally
The gravestone doji is an upside-down "T" and is the opposite of a dragonfly. The price opened low on the day, ran up, and then completely sold off back to the low. A rally attempted by buyers resulted in a failure to hold any of those gains.
When this pattern forms at a resistance level, it is an extremely strong bearish signal. The upper shadow is evidence of how buyers were dominant, and then sellers came in and swept away the entire rally.
Look for this pattern after a stock has rallied post-earnings, or if Bitcoin is approaching historical highs of a previous cycle. Not only is this pattern in line with book definitions, but if accompanied by heavy volume, it will often lead to more bearish prices.
Common trap: A trader sees a gravestone doji and immediately sells short. Don't! Wait for the following candle to close below the gravestone doji's body before selling short. Otherwise, it's merely guesswork.
Four-Price Doji — The Flatline Market
This doji is rare among candle patterns. Four-price Doji's have no wick; thus, the open, high, low, and close occurred at the same price, resulting in a horizontal line on a chart. The candle reflects no movement at all during that time period.
This normally means there has been virtually no trading activity occurring in the market. A four-price doji appears in low-volume markets, thinly traded instruments, or instruments traded under market conditions.
The four-price doji should not be used for entry to any type of trade. The four price doji should only be used for assessing liquidity. Do you see a liquidity opportunity based on the four price doji? Yes. Price direction? No.
Doji Candles vs. Other Candle Patterns
New traders tend to confuse doji candles with two other popular candle patterns: the hammer and the spinning top. The original definition of these patterns is important because it will be used to determine which one of these three formations is currently being traded.
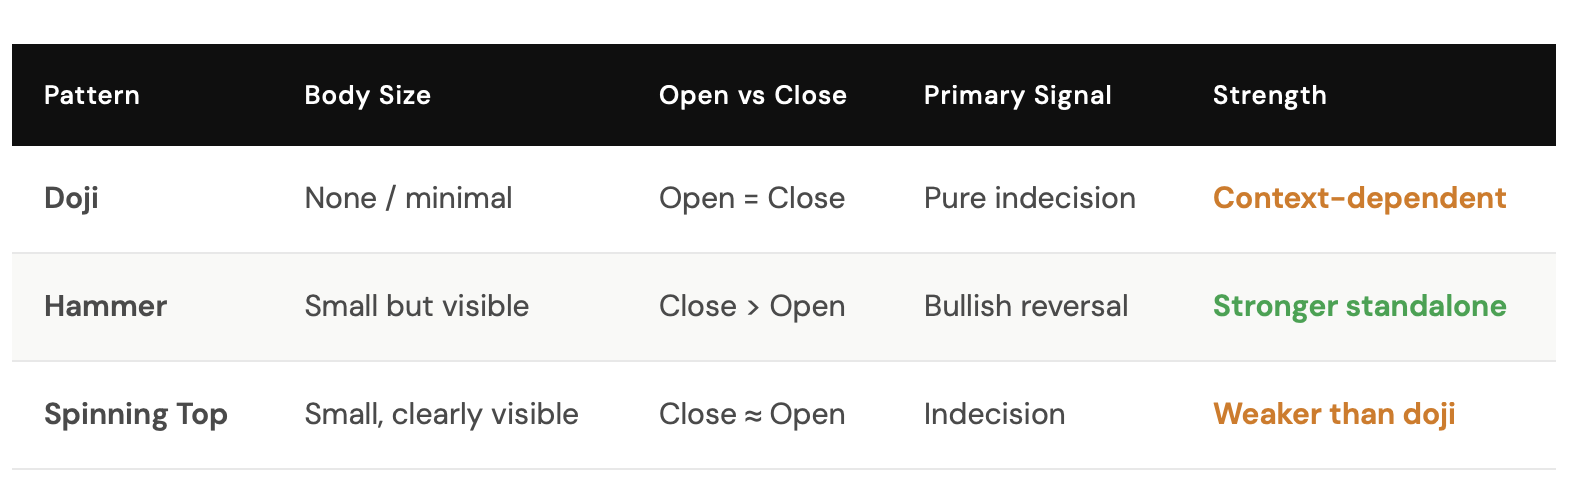
Because the hammer pattern has a small amount of physical body, there is already a slight directional bias inherent in it before making a trading decision. Since a doji does not have an actual body to rely on, it is considered to be completely balanced. This difference is crucial when you are attempting to evaluate how much confirmation you should require prior to entering into a position.
How Can You Successfully Trade a Doji Candle Type?
The first rule of trading candles: Do not isolate the doji candle! This means that you will have to locate the context surrounding the doji pattern; it really doesn't matter which type you are trading from. If there is no context, then there is no value to this shape on a chart at all!
Practical Framework for Using Doji Types as Part of a Real Portfolio Decision-Making System.
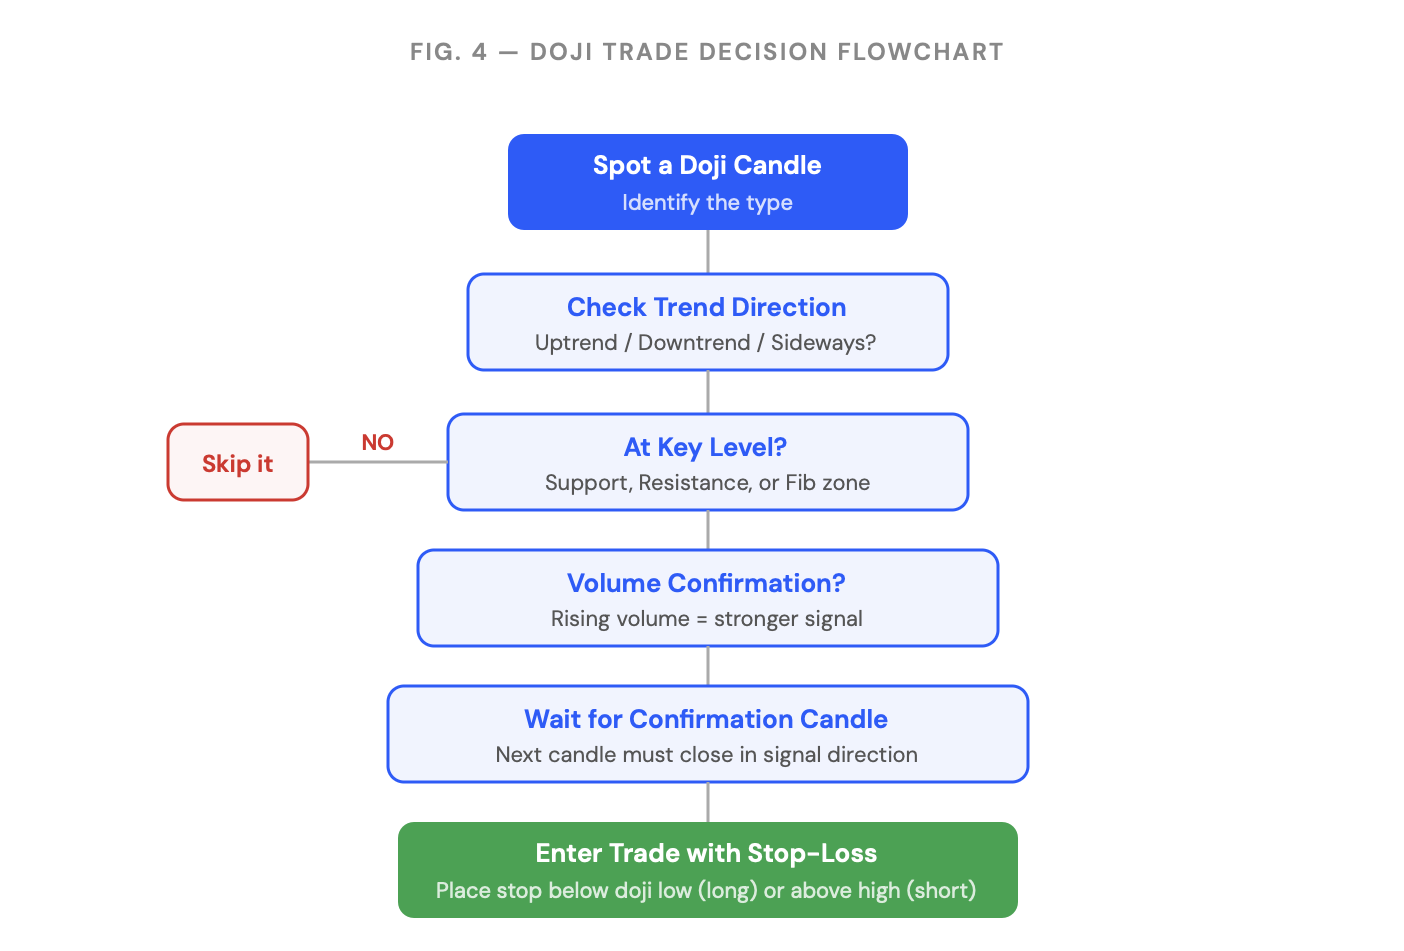
The tips below will help boost your confidence in making trades based on doji patterns while maintaining discipline at the same time.
Remember that trends are what really count when considering a trade. If you see a dragonfly doji at the end of a very strong downtrend but have no confirmation from the broader market before you buy the doji, that means there is a low probability of making a profit on the trade, regardless of its bullish appearance.
Make sure to consider the volume associated with the doji candle. In other words, the greater the volume on the candle compared to average daily volume, the more credible the candle will be as an entry signal to buy.
Before buying the doji candle, always wait for the confirmation candle to close in the same direction you intend to buy from the doji pattern.
You always need to have a stop loss order, which will limit your loss on this trade if it does not work out as you intended. The stop loss order should be placed just beyond the point where the dragonfly doji’s wick edges out of the top of the doji candle.
Creating a disciplined trading approach based on doji patterns requires two components: understanding how a doji pattern develops and then executing the successful doji pattern trade according to established guidelines without allowing emotion to play into the decision-making process. Many traders do not make money on the same doji pattern repeatedly because they do not stick to those guidelines after learning them.
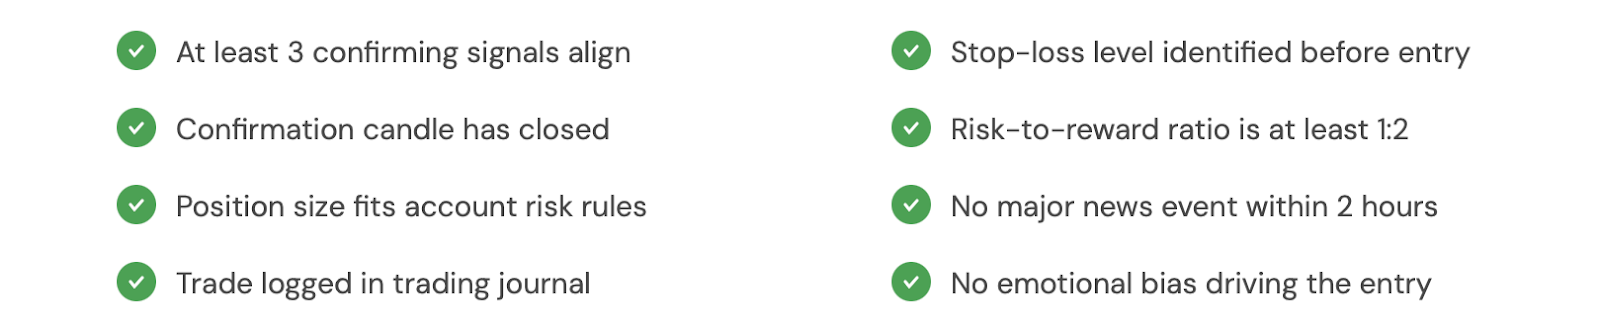
Most Traders Don’t Realise That the Journal Portion Of Trading Is Important.
In Your Weekly Review Of Your Doji Trades, You Can Discover Patterns In Your Decision-Making.
You Can See That Your Best Trades Follow The Checklist, And Your Worst Trades Don’t. There’s Your Lesson.
Three Typical Errors That Communicating Traders Make Regarding Doji Candles
Common practice among inexperienced traders
Using a doji candle as an active trade without waiting for confirmation is common practice among inexperienced traders. This type of behaviour is characterised by a lack of proper technical analysis - putting down money based on subjective determination rather than following a trading pattern.
Doji candles by themselves do not have any particular meaning, and therefore, the use of doji candles alone is not a valid trading strategy.
You must take note of the trend (up/down) before putting on a trade using a doji candle. A doji candle formed during a downtrend may require a greater confirmation to trade than when it occurs during a period of uptrend.
You do not need to trade every doji candle. After you become proficient at doji candle trading, you will learn that knowing when not to trade a doji candle is just as important as when to trade it.
Use a stop loss as you enter a trade; this way, you can manage your stop loss at the end of the day and avoid losses that can severely affect your account balance.
You cannot confuse a hammer with a dragonfly candle. The price body of the candle matters when interpreting the potential signal — it is not just a creative guess about a doji.
The Following Forex, Crypto, and CFD Trading Examples Illustrate Specific Doji Candle Types Based On Price Action and Market Sentiment
You can use doji candles in all trading markets. However, how you use them may vary depending on the type of trading market you are in:
In Forex, Doji Candles are much more valuable using higher time frames, such as daily QQE (Yuen-Yen Cross) charts. A dragonfly on the day EUR/USD chart is a strong signal because price action has pushed through major support levels. However, a dragonfly doji pattern on a 1-minute chart will have less reliability for trading.
In Crypto, doji candles carry added importance because there are 24 hours a day, 7 days a week, without automatic shut-off switches. Bitcoin and Ethereum will frequently print extremely large doji candle formations after there has been a significant change in foundation, a bearish ATR range extreme, or some type of surprising on-chain data event.
For cryptocurrencies, it is very common to have a doji with long legs simply because emotions tend to change faster than you can blink. Volume should always be confirmed.
In CFD trading, the concept of reflation increases the risk you take under each respective market. Going into a gold CFD trade, if a gravestone doji candle has formed at resistance, it can be classified as both a signal to trade and an event for risk management — that is, you need to set tighter stops for all leveraged products when trading these types of signals.
DEFINITION:
What Are Doji Candle Types? Doji candles are characterised by a near-zero closing price relative to the opening price. Each of the five styles of doji candle - standard doji- is representative of the level of volatility or number of individual market participants. You cannot use doji candles without the assistance of additional analysis.
Frequently Asked Questions
Are all doji candles reversal signals?
No. Doji candles signal indecision, not reversal by default. A doji in the middle of a range or consolidation means very little. It only becomes a potential reversal signal when it appears at a key support or resistance level with confirming factors like volume or a confirmation candle.
Which doji type is the strongest?
The dragonfly doji at a support level and the gravestone doji at a resistance level are generally the strongest in their respective directions. They show a clear one-sided rejection rather than balanced indecision.
Can beginners trade doji patterns?
Yes, but they should start on higher timeframes like the daily or 4H chart and always require at least one confirmation candle before entering. Jumping into doji trades on lower timeframes without experience is a fast way to get shaken out repeatedly.
Should I use doji in crypto trading?
Doji patterns work in crypto, but pay extra attention to volume. Crypto markets can move fast on low volume, creating misleading patterns. Stick to major pairs like BTC/USD or ETH/USD and use daily or 4H charts for more reliable signals.
How do I confirm a doji signal?
Wait for the candle that follows the doji to close in the direction you're expecting. For a potential bullish reversal, you want a full green candle closing above the doji's body. For a bearish reversal, a full red candle closing below. Volume above average on that confirmation candle makes the signal significantly stronger.
Stop Guessing. Start Trading With a System.
At Tradewill, we give you the tools, education, and market access to turn pattern recognition into real trading decisions — not just theory.
Disclaimer: The content of the blog does not represent any position of Trade W, does not serve as any trading-related decision advice, and does not endorse any third-party.