
 Trade W

Many traders often overlook the consolidating pattern of the market, yet it frequently leads to larger moves than most people can handle, namely the large movements of foreign exchange markets (Forex), crypto, and Contracts for Difference (CFDs).
Markets do not move linearly. If you will, markets "breathe," squeeze, compress, and ultimately come together into a small, subtle grouping of converging trend lines prior to a big movement in the market by way of Elliott Wave triangles. Once you have the ability to recognise an Elliott Wave triangle, it will be very difficult to ever miss one again in the future.
An Elliott Wave triangle is an upward-moving corrective pattern comprised of 5 subwaves (i.e., A, B, C, D, and E) that each contain 3 waves themselves, forming the entire Elliott Wave formation as a 3-3-3-3-3 continuum with respect to an overall trend line (the larger trend line).
Additionally, during these complex, time-consuming, and consolidating triangles, which can sometimes take up to 20 months to peak, traders on the sidelines are typically waiting patiently while the market has been growing steadily up to that point until one day it becomes apparent that there is significant price energy to be gained by breaking the upward resistance of the previous solid level.
Elliott Wave triangles are exceptionally reliable patterns that appear on charts immediately before a forex breakout, as well as before dramatic upward surges of new buying volume in volatile crypto markets and just prior to the final wave exhibiting climbing price behaviour relative to the last impulse movement they represent. Therefore, Elliott Wave triangles should be a priority learning resource for all Elliott Wave traders.
What Is an Elliott Wave Triangle?
An Elliott Wave triangle is not a neutral pattern; it is a corrective pattern. It represents a temporary pause or correction within an overall primary trend, not a reversal of that trend. Therefore, the market is not without direction. Instead, when forming a triangle, the market is building up.
An Elliott Wave triangle is formed when the price action creates five overlapping waves between two converging trend lines, neither buyers nor sellers can prevail, and volatility compresses prior to resolution, which is generally rapid and in the direction of the primary trend.
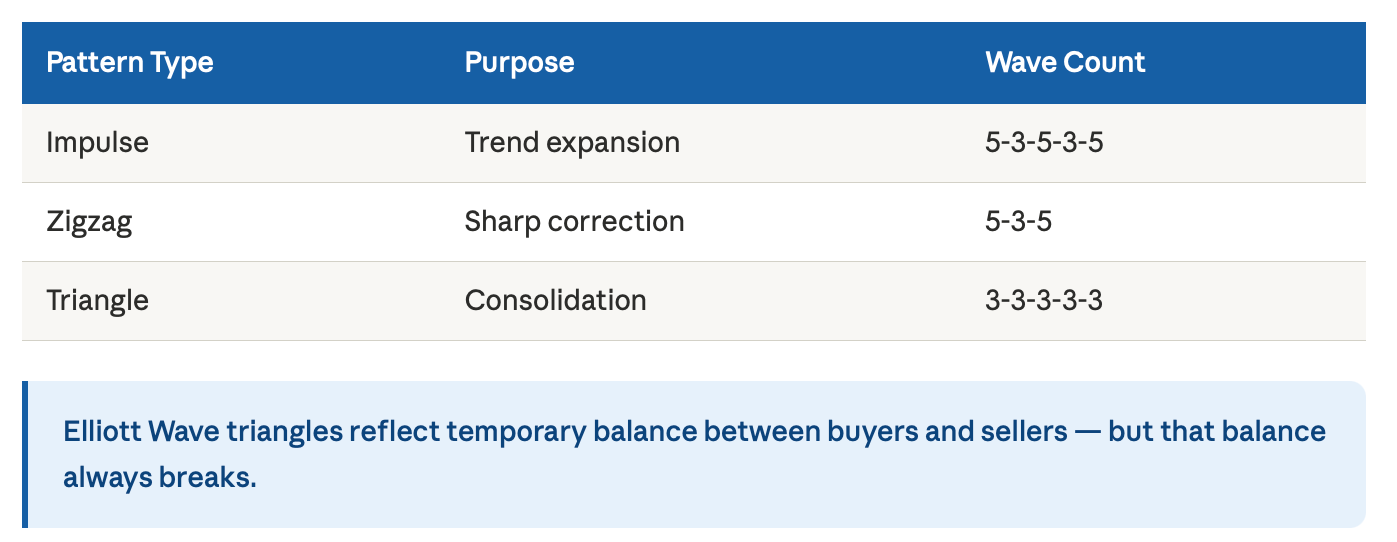
An Elliott Wave triangle reflects a temporary equilibrium between buyers and sellers, which eventually breaks as the market continues its trend.
The 3-3-3-3-3 Structure of an Elliott Wave Triangle
The key distinguishing feature of the Elliott Wave triangle from other patterns is its internal structure. Each wave within the triangle can be classified as a corrective wave.
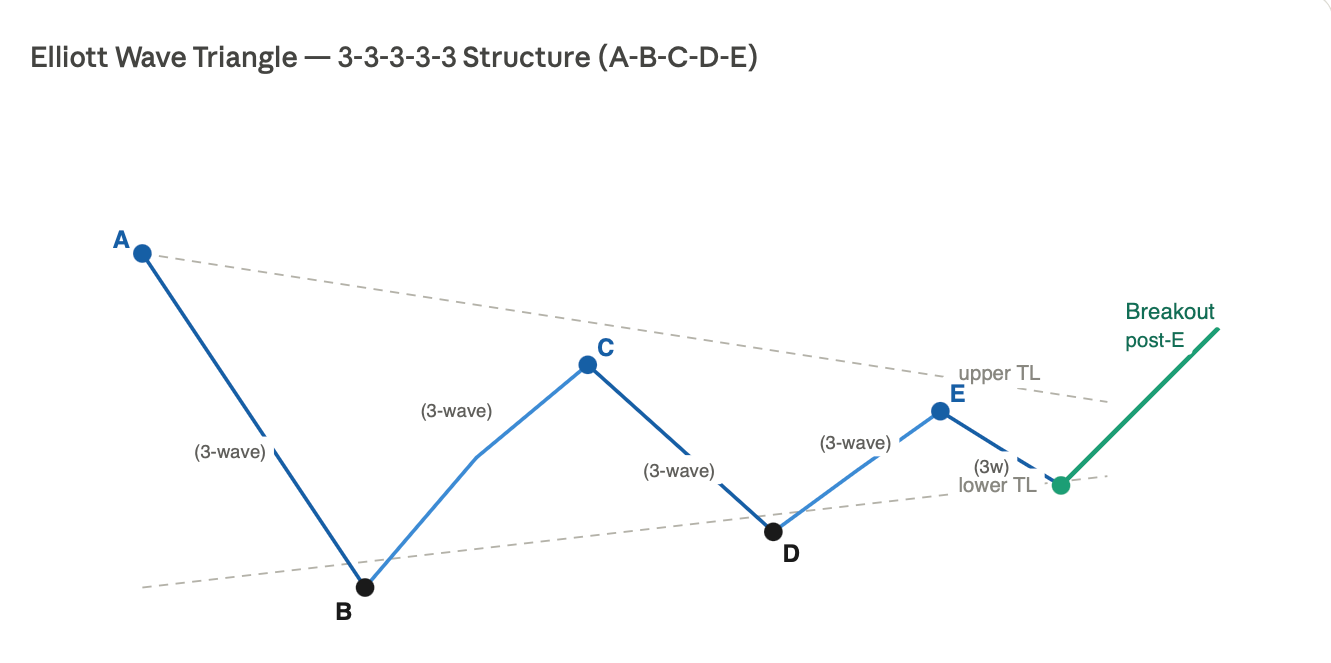
Wave A has three smaller waves. Wave B also has three smaller waves. The same is true for Waves C, D, and E. Thus, the overall structure of a triangle is 3-3-3-3-3. Therefore, if you identify an impulse wave, meaning an upward or downward move, within the pattern, you cannot identify it as a triangle.
Here’s your text with grammar corrected only where needed, keeping the structure unchanged:
Every wave in Elliott Wave triangles can be broken down into smaller three-wave sequences, with each wave subdividing into three waves. As you progress from A to E, volatility decreases and becomes more controlled. The trend lines become increasingly narrow as the overall wave pattern approaches completion with wave E.
Every single wave in a triangle formation is classified as corrective in nature, not impulsive, which allows us to determine whether or not this wave sequence fulfils the 3-3-3-3-3 rule for verification purposes.
The Five Sub-Waves: What Each One Tells You
Wave A — First sign of consolidation
Wave A indicates that the price trend will be consolidating; therefore, it retraces in three-wave increments rather than five-wave increments that continue the prior trend. Many traders do not label Wave A as the first wave of a triangle but instead see it as a regular pullback from the previous price trend.
Wave B — Counter trend reaction
Wave B has a counter reaction to Wave A, following the previous price trend, but does not exceed the range of Wave A, which is the key element showing that this triangle is beginning to look like a consolidation rather than a continuation. Additionally, Wave B has typically shown a drop in volume.
Wave C — Contraction confirmation
Wave C continues in the same corrective direction as Waves A and B, remaining within the Wave A and B boundaries. At this point, the trend lines will have become more defined as the overall pattern approaches completion, moving towards triangulation. Traders following Elliott Wave charts and those interested in pattern recognition can use these triangulated wave lengths as a reference for future price movement.
Wave D—Weakening momentum
The size of Wave D is smaller than that of Wave B. This is when it is most evident that the market has been compressed, meaning that the price swings, up and down, are getting progressively narrower with less force behind every push and pull. Institutional traders frequently use this stage as a "quietly built" position.
Wave E — the trap
Oftentimes, Wave E is considered by retail traders to be the most dangerous. During Wave E, the price usually looks like it is "breaking down" (going down) or "breaking up" (going up) toward the end of the triangle formation, the apex. A number of traders put on positions in the wrong direction, anticipating a reversal at that point. When they are stopped out of their positions, the market then breaks out in the opposite direction.
Wave E will often "trap" traders before the true breakout. This is no coincidence. It is done intentionally to flush out weak hands in the market.
Rules Every Trader Must Know
Every trader must recognise a number of rules pertaining to Elliott Wave triangles. Triangles must consist of a configuration that follows these rules because if a triangle does not follow them, then it is not valid.
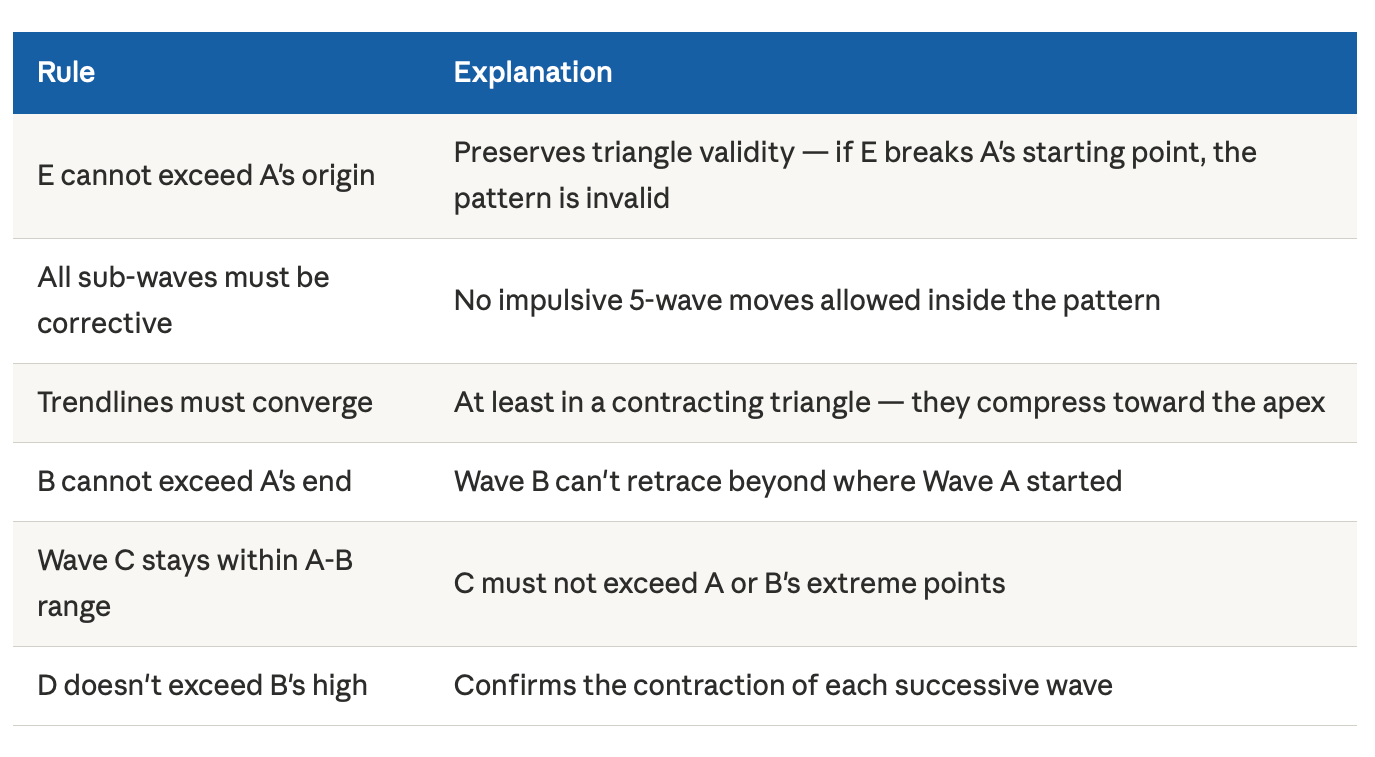
Not following any one of the strictest rules of the triangle invalidates the entire count.
The Psychology of Triangles
There is a correlation between what is happening in the market and psychology because the market reflects human behaviour. Therefore, every triangle reflects a specific point of indecision that leads to conviction as we move through the development of the pattern.
A definitive direction for either buyers or sellers has yet to be established during the initial phases of the triangle, and therefore, there is no clear winner in terms of market momentum. Additionally, both volume and volatility continue to decrease. Thus, traders begin to become frustrated, and many of them are forced out of their trades out of boredom right before they see the breakout direction.
Institutional players enjoy the consolidation period because it allows them to accumulate positions without creating a significant change in the market. Therefore, when the final Wave E is completed, there is a high likelihood that those same institutional players will have already accumulated their positions and are prepared for the breakout.
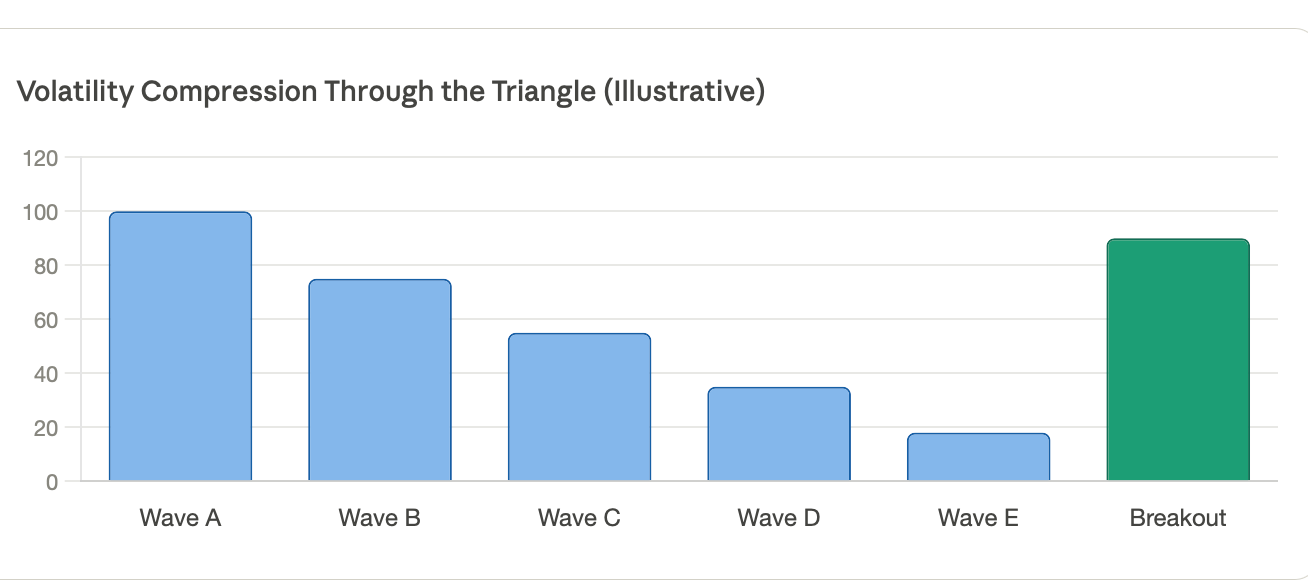
Elliott Wave triangles represent a contraction of market energy. Therefore, once the triangle completes its development, that energy will be released.
Types of Elliott Wave Triangles
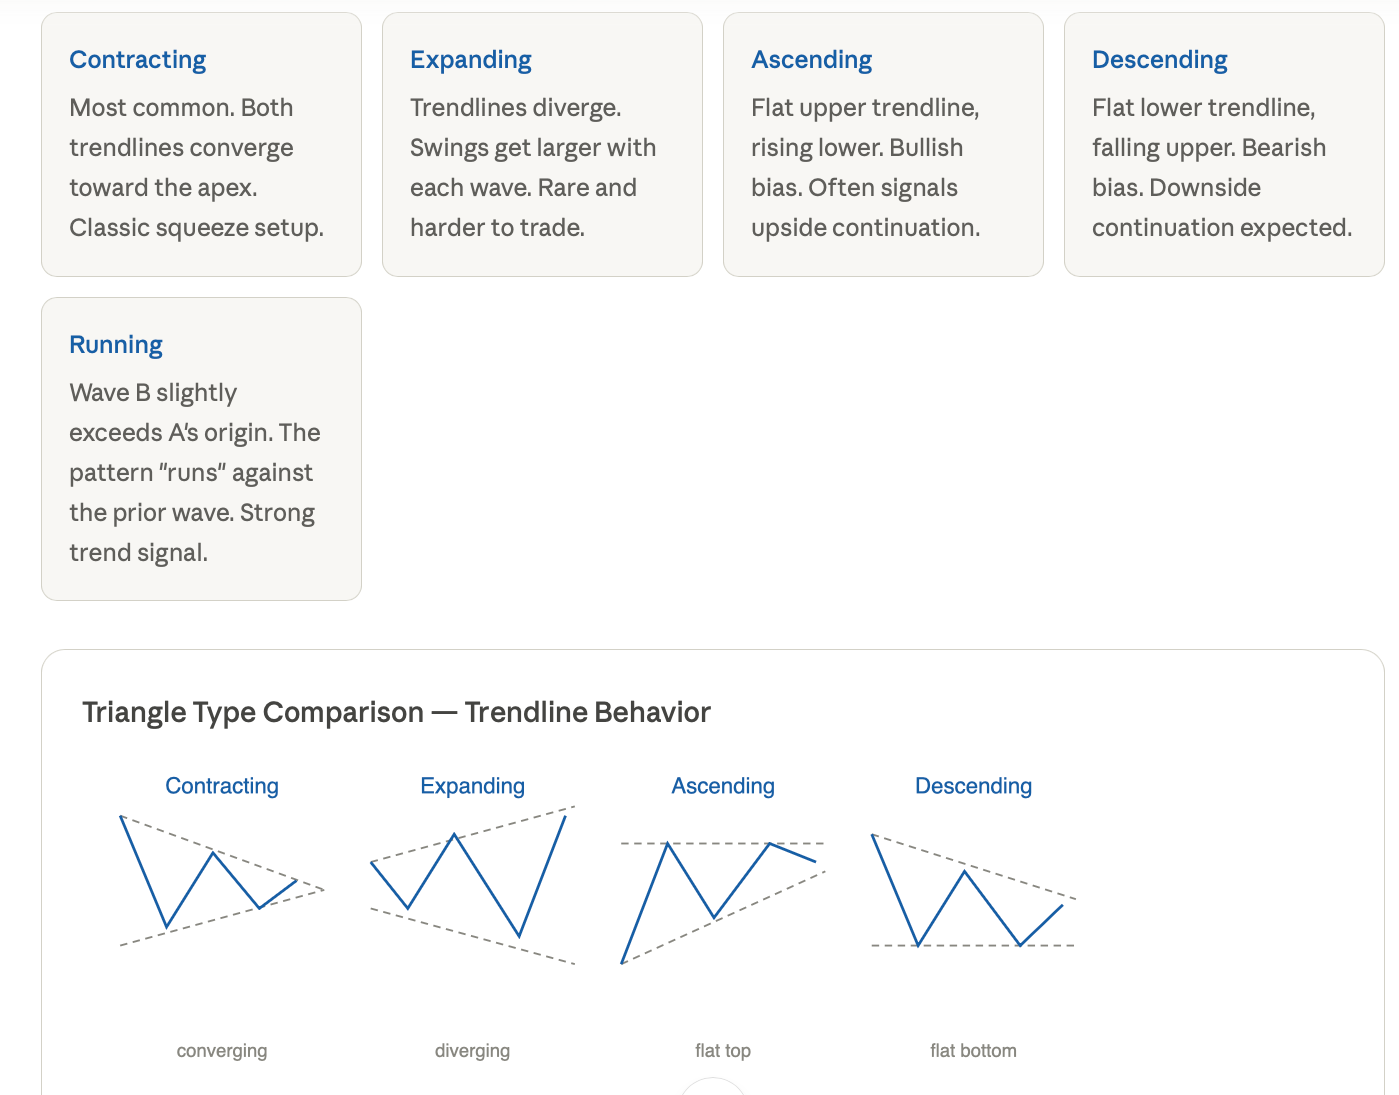
The triangle's function in various market environments shows different pressures. Contracting triangles can be counted on with greater certainty, while expanding triangles are more difficult to trade.
Where Triangles Are Found in the Wave Pattern
Triangles do not exist at random locations. They exist in certain positions within the overall Elliott Wave pattern, and being able to find those locations gives you insight into what will come next.
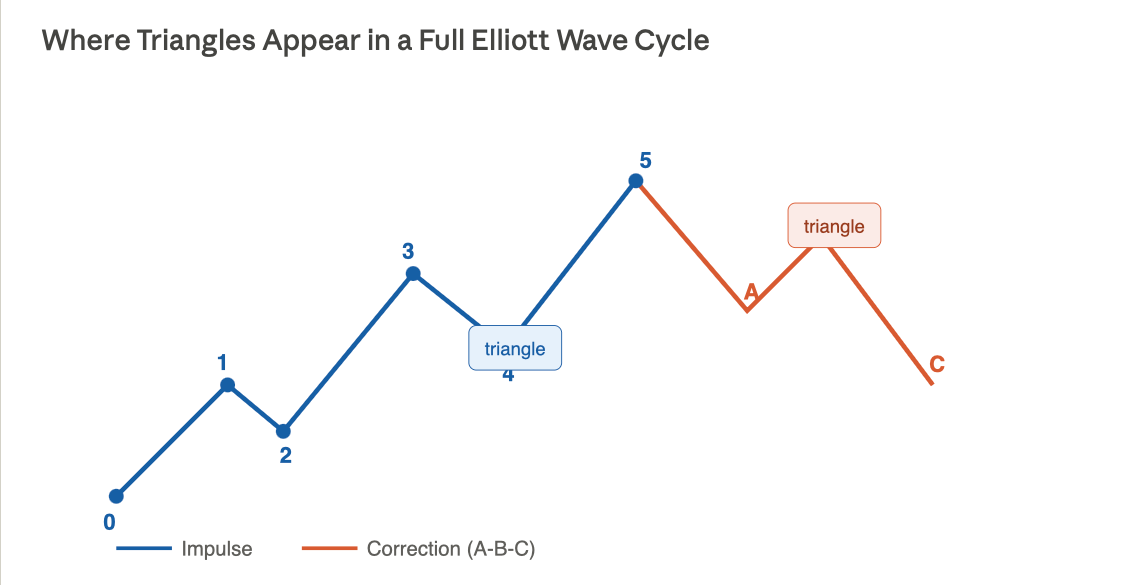
Wave 4 is usually the most frequent place to find a triangle after Waves 1 through 5 in corrections. As a result, you often have a triangle consolidation before the 5th and final wave occurs, predicting a higher high if we are in a bull market.
Wave B of zigzag or flat corrections will also often develop into a triangle, indicating that complex corrections are likely taking place and suggesting a follow-up with a final C wave after the triangle. Additionally, a triangle developing as an X wave will indicate that a complex correction is taking place.
The last possible location for a triangle may be in Wave 2. Normally, Wave 2 tends to have a strong upward or downward movement, such as a zigzag or flat. However, it can also have a much slower upward or downward consolidation compared to other waves in this environment.
Elliott Wave Triangles: How to Trade Them
An entry would occur at the breakout of Wave E once E has finished.
Do not anticipate where E will be when it finishes. Wait for confirmation of the breakout and enter the trade then.
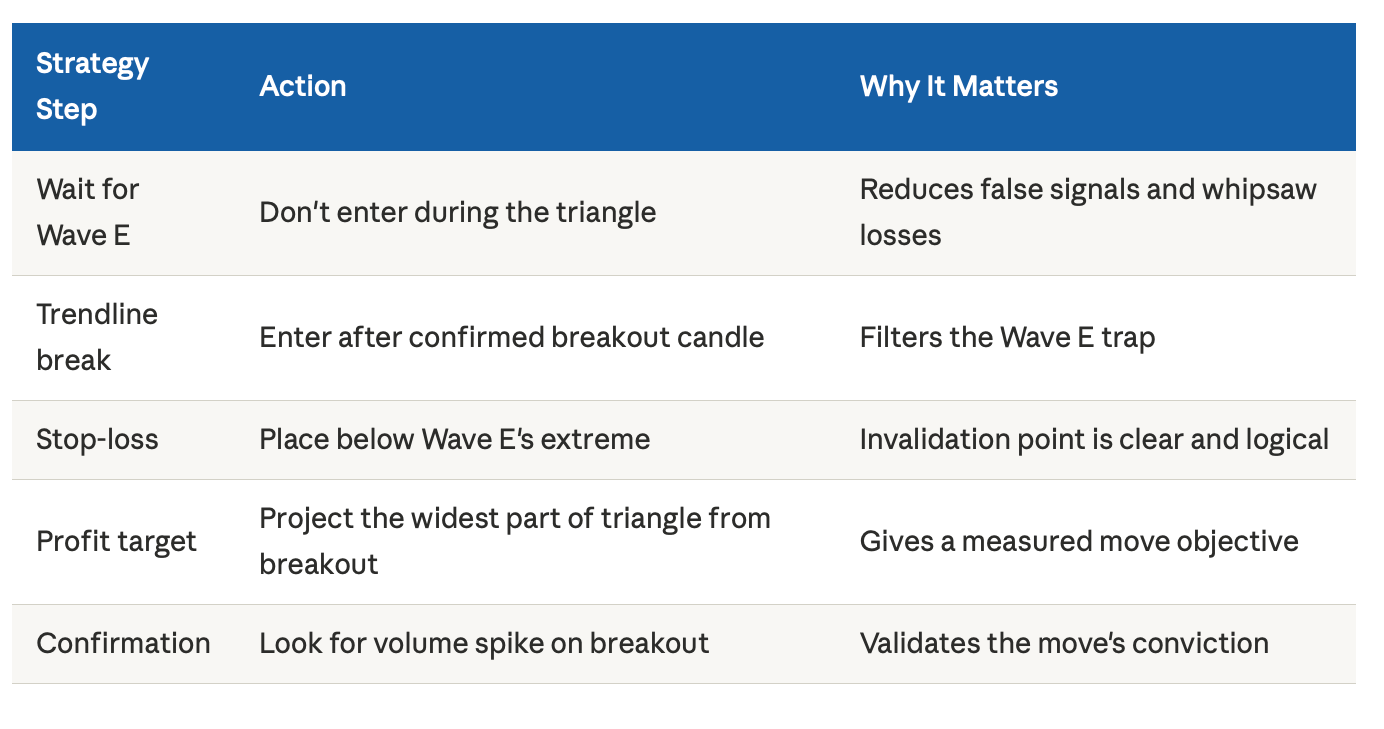
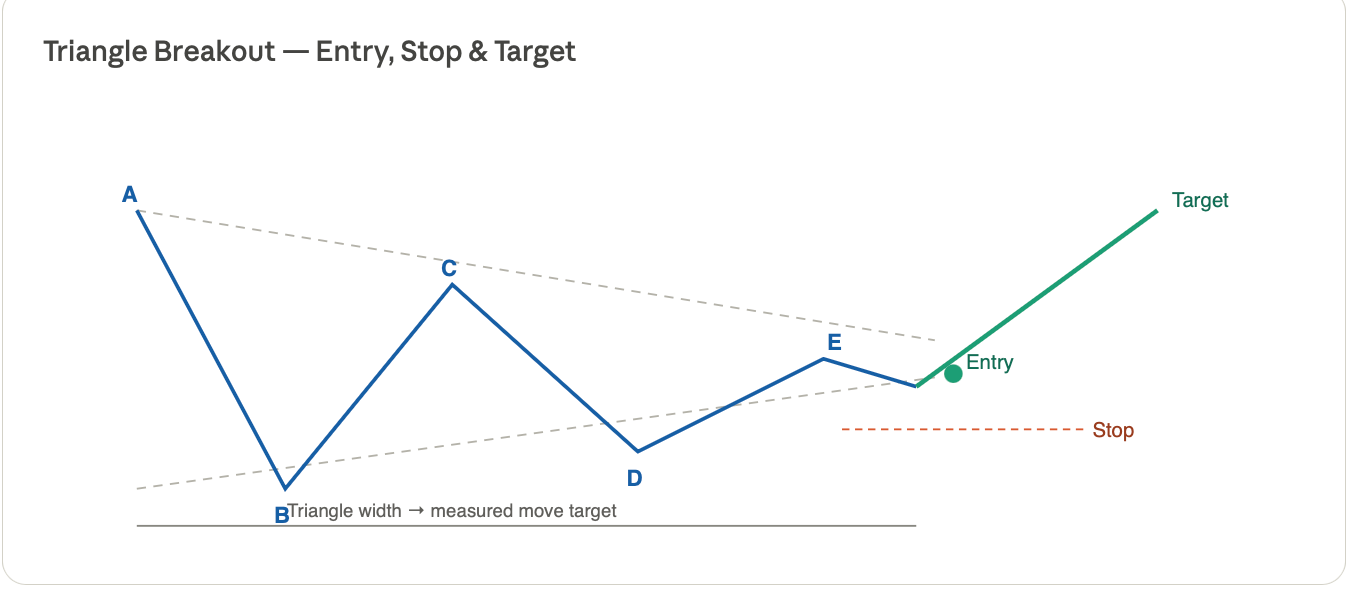
The greatest opportunities result from trading after a triangle is complete. Therefore, keeping patience with the count, once E has broken, is just as vital as successfully executing a breakout trade.
Commonly made mistakes when trading Elliott Wave Patterns
Forcing a triangle count onto a sideways market. Not all sideways markets equal triangle counts. In cases where five sub-wave counts cannot be visually validated using the structure of the triangle, the market is not a triangle.
A habit that contributes to poor performance is entering during Wave E. Even though E appears to have broken out of a triangle, often the count breaks down or retraces rapidly after the trade is entered. Waiting for the trendline to be violated with a high-volume breakout is key before entering the trade.
Mislabeling impulse waves as corrective waves will cause an incorrect count. If any wave forms five clear sub-waves within a pattern, this shows an impulse. If so, the overall structure of that pattern is invalid.
There are examples of how triangles fail to form due to forcing the count on a range-bound market. Forcing a triangle count will create worse trades than those you would receive as a result of trading them.
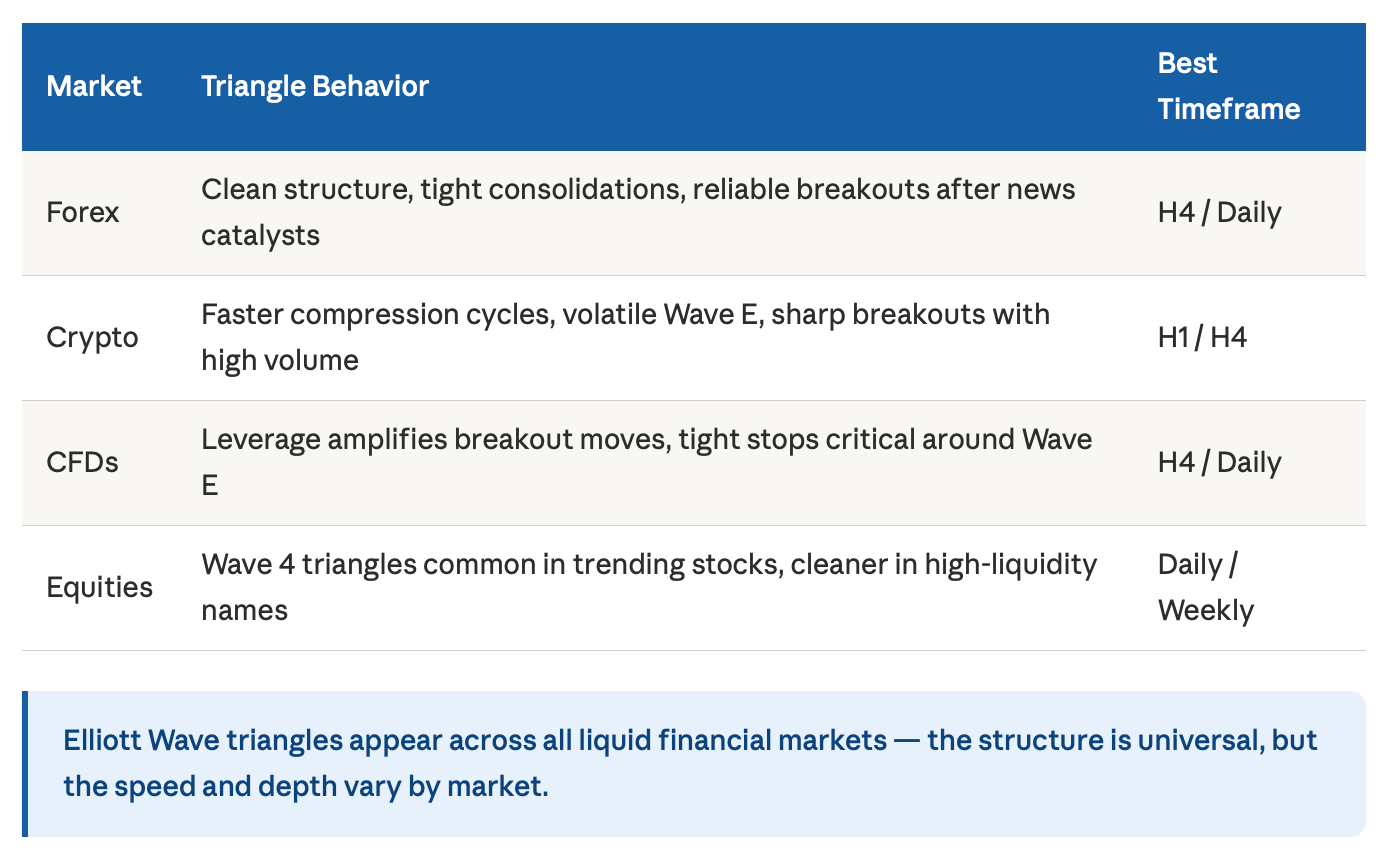
Elliott Wave Triangles Across Markets
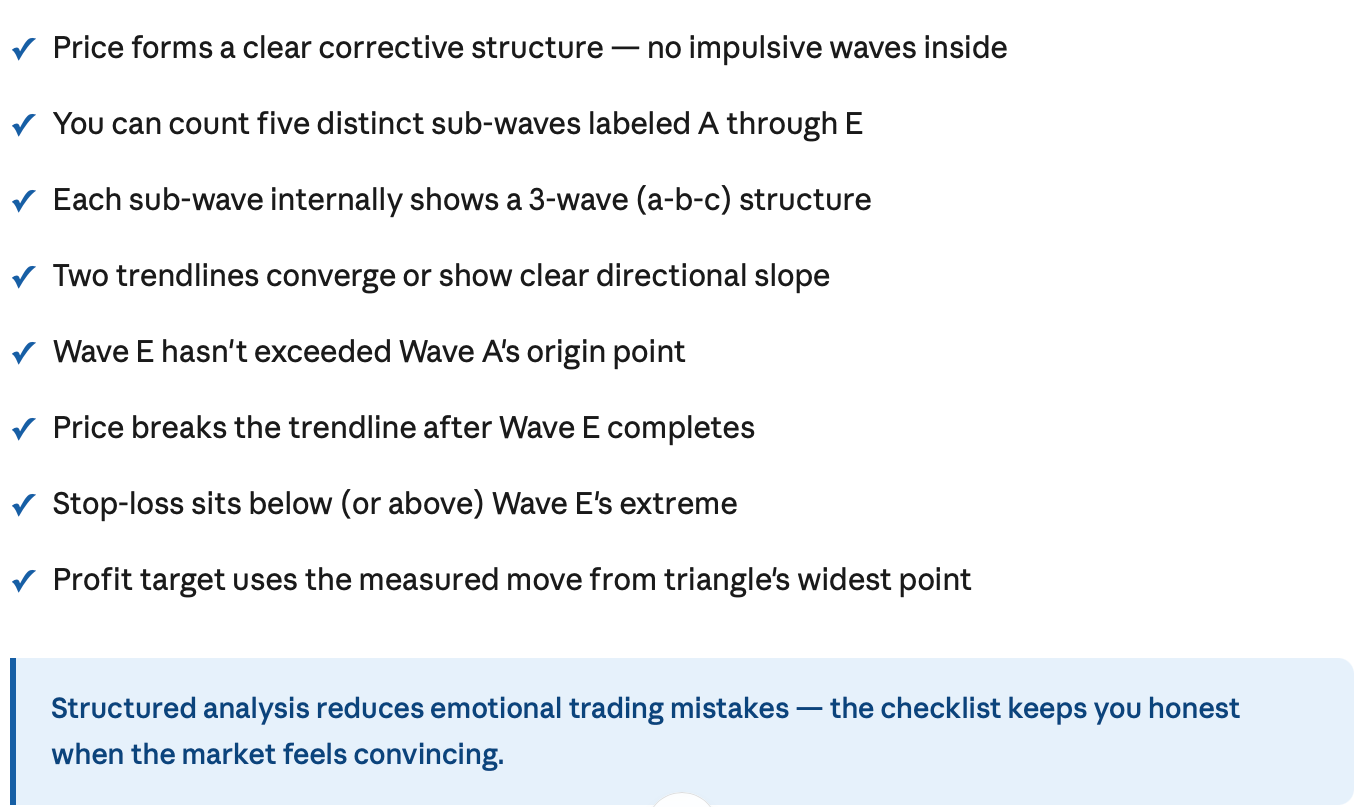
Triangle Trading Checklist
FAQ
What is an Elliott Wave triangle?
It's a corrective chart pattern made of five sub-waves (A-B-C-D-E), each following a 3-wave structure. The pattern forms a sideways consolidation between two converging trendlines and usually precedes a strong trend-continuation breakout.
What does the 3-3-3-3-3 structure mean?
Each of the five sub-waves inside the triangle (A, B, C, D, E) consists of three internal waves. None of them is impulsive. This 3-3-3-3-3 signature is the defining characteristic of the triangle pattern.
What are the rules of an Elliott Wave triangle?
Wave E can't exceed Wave A's origin. All sub-waves must be corrective. Trendlines must converge in contracting triangles. Wave B can't exceed Wave A's endpoint. Breaking any of these rules invalidates the count.
Where do Elliott Wave triangles usually appear?
Most often in Wave 4 of an impulse sequence or in Wave B of a complex correction. They rarely appear in Wave 2, which tends to be sharp rather than sideways.
How do traders trade triangle breakouts?
Wait for Wave E to complete and for the price to break the trendline, then enter in the breakout direction. Place a stop below Wave E's extreme and target a measured move equal to the triangle's widest point.
What's the difference between a contracting and a running triangle?
A contracting triangle has trendlines squeezing toward the apex. A running triangle is rarer. In it, Wave B slightly exceeds Wave A's origin, signalling an even stronger trend continuation ahead.
Disclaimer: The content of the blog does not represent any position of Trade W, does not serve as any trading-related decision advice, and does not endorse any third-party.