

 Trade W

A lot of traders will go into an expanding triangle expecting that it behaves in much the same way that other formations do, only to leave the trade with a blown position and no idea why. Expanding triangles do not behave in the same way that many other chart-based formations do, which is what makes them both dangerous and uniquely rewarding if you have the proper approach to them.
An expanding triangle, also known as a broadening pattern or megaphone pattern, is when the price series makes a series of higher highs and lower lows, where the distance between the swings increases as you progress through the price series.
The primary difference between a triangle pattern and an expanding triangle pattern is the behaviour of the price series leading up to the apex. Most triangle patterns are formed as a result of decreasing volatility and are compressing toward a common apex.
An expanding triangle, however, is formed as the price series moves away from an apex due to an increase in the amount of volatility and the market structure weakening as a result of all participants, retail traders chasing breakouts and institutions grabbing liquidity, contributing to the chaos.
One of the biggest misunderstandings beginner traders make is that just because the market is "expanding", this must also mean the market is building up energy to break out cleanly in an upward direction. Instead, what expanding is telling you is that the market now has the potential to be highly unstable, with an increasing probability of false breakouts, shakeouts, and emotional traders, increasing with each swing in the price series. The understanding of this distinction is critical to everything that is discussed throughout this guide.
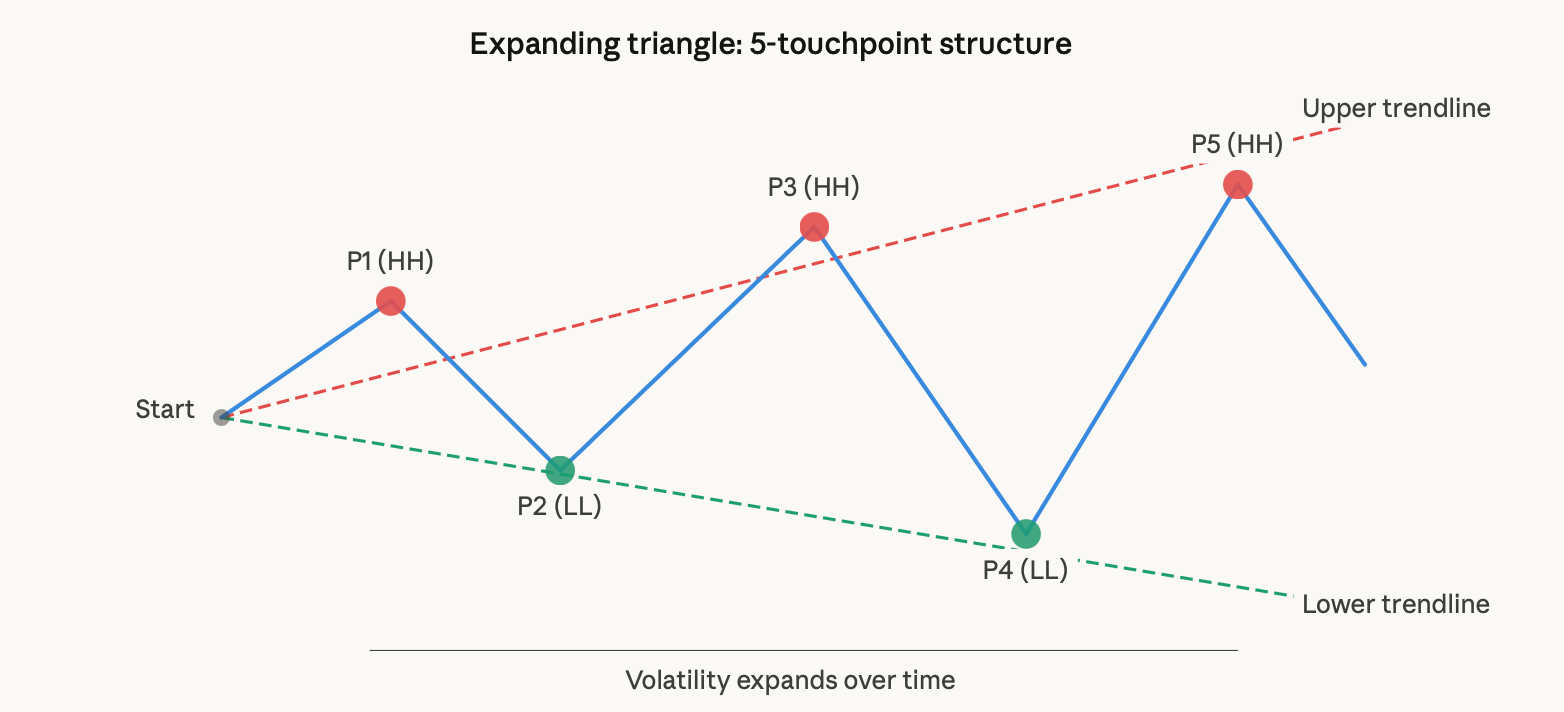
The diagram above captures exactly what separates this pattern from everything else you'll encounter on a chart. Notice how each swing doesn't just reverse; it exceeds the prior extreme in both directions, which is the structural fingerprint that defines the pattern.
What Is an Expanding Triangle?
The expanding triangle pattern is a price chart formation, which is produced by prices making higher highs and lower lows. This will produce two diverging trendlines, which will widen apart over time and signify that the market is becoming increasingly unstable, as both buyers and sellers repeatedly alternate between gaining and losing control by swinging in both directions. Typically, this pattern indicates that the market is becoming unstable and occurs at the end of large trends, during periods of higher volatility before an announcement has been made, or within a period of emotional retail trading.
Expanding Triangle vs Symmetrical Triangle: Key Differences Every Trader Must Know
Most technical analysis mistakes that involve the incorrect identification of two patterns will generate a larger number of losing trades than any other type of identification error combined. Both patterns have similar appearances, but they work almost entirely differently. Trading the two using the same system will repeatedly result in losses.
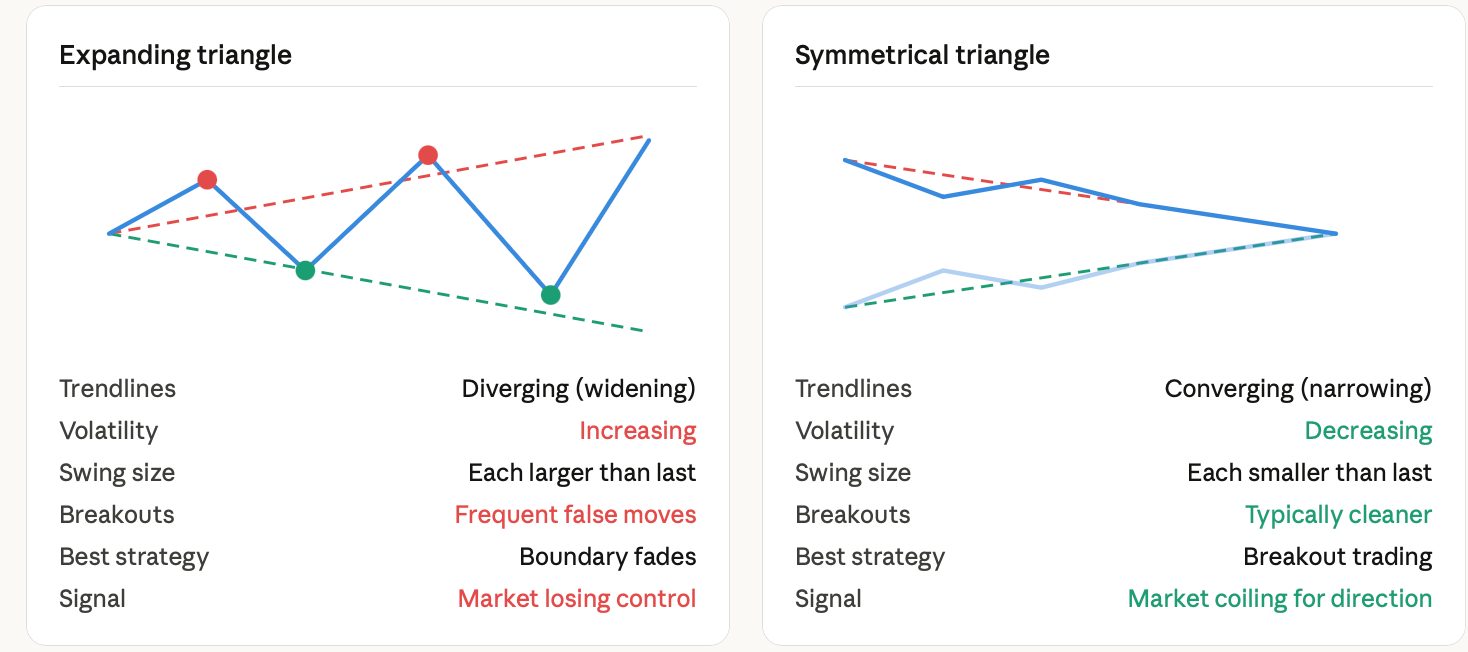
A symmetrical triangle is essentially a price-reduction triangle, in which prices decline at a slower pace than they would in a normal market because they are approaching their high and low points simultaneously. In contrast, an expanding triangle represents the opposite of this dynamic. Because volatility is abundant within the expanding triangle, every breakout from the upper trendline appears to be a breakout, and therefore, is generally seen as an opportunity to trade a bounce back toward the upper trendline.
However, when using a breakout strategy on an expanding triangle, traders will likely experience retaliation since breaks above the upper trendline are most commonly "false" breaks that result in a quick reversal of price to the downside. The trading strategies for these two types of triangles require completely different thought processes.
The Psychology Behind the Expanding Triangle: Greed, Fear, and Market Instability
Not only do you need to know how to trade the expanding triangle pattern, but you also need to understand the psychology that governs the behaviour of all participants trading within this triangle pattern.
When the price creates a new high above the last swing high, retail traders will be in FOMO mode and will aggressively buy into what they believe is the resumption of an uptrend. After the price reverses direction and creates a new low below the last swing low, those same traders will panic sell and create a new low. Large players are taking advantage of these extremes to create liquidity by breaking down orders and reversing positions on both sides of the market, creating cycles that keep the volatility at the high end of each emotional extreme.
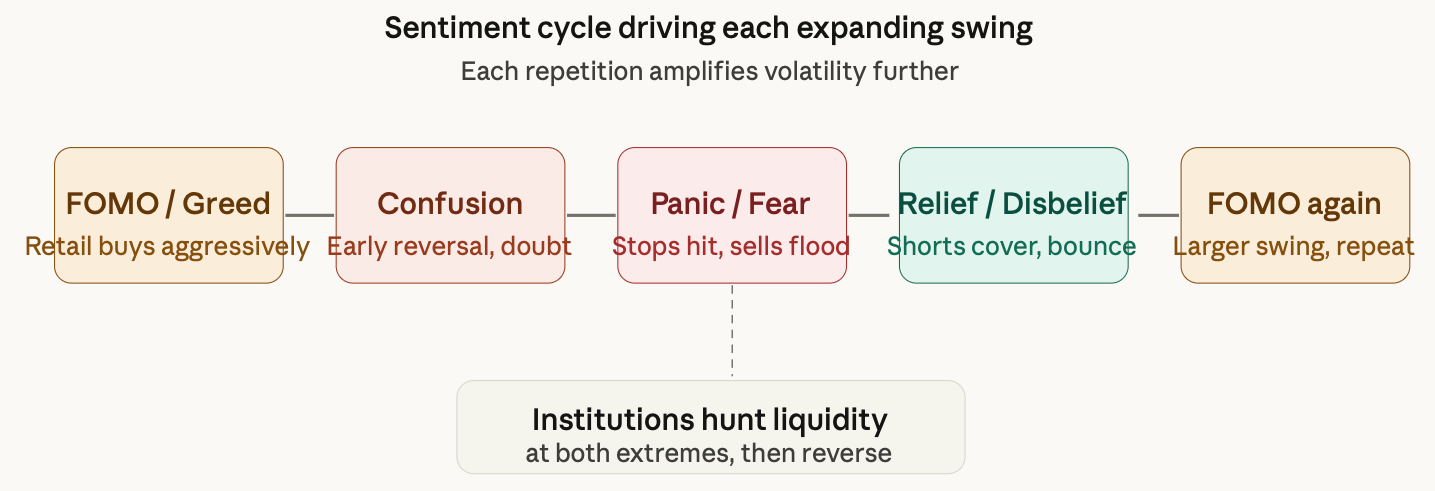
The pre-news volatility environment is one of the best places for this scenario to develop. Traders who are unsure of what direction an economic release, a central bank decision or a geopolitical event will take will hedge and bet in two different ways, and this creates the exact type of price action seen in the pattern. Each time there is a false breakout, it is a liquidity sweep, where they will trigger their stop orders and fill their institutional positions before the real reversal happens.
3 High-Probability Expanding Triangle Setups That Actually Work
There are three setups that have shown a constant edge in various markets/time frames. All three have the same one critical rule to follow: never trade from inside a pattern outwards, because the risk-to-reward in both directions on either side of the middle of the pattern is poor.
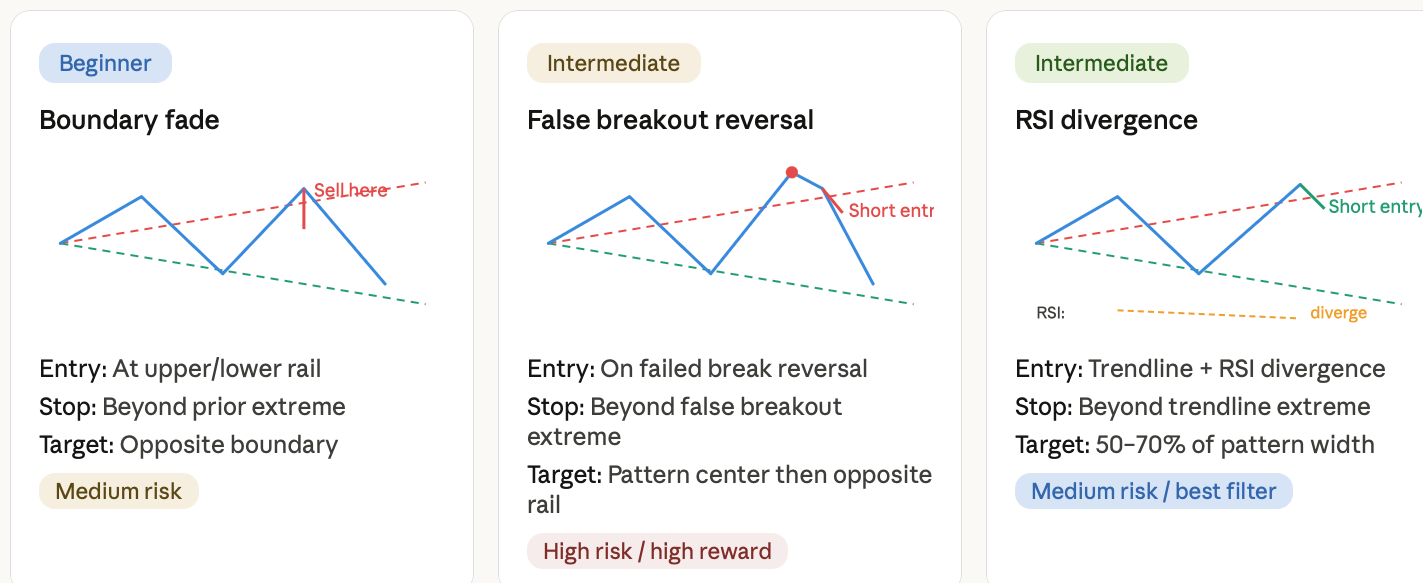
More experienced traders know that this is where their true advantage lies: The false breakout reversal setup. In 2024 and into 2025, the Nasdaq experienced a lot of volatility; many times, after some significant price action had pushed through a short-term resistance level (albeit by a very slight amount) and triggered a significant amount of stop-buy orders, this price action would reverse dramatically within one to two candlesticks. Any trader who had positioned themselves on the side of these false/misleading moves was able to capitalise on those reversals while having risk/reward profiles that were exceptional. The RSI divergence setup also helps traders filter out the majority of the false signals associated with boundary trading because they require two confirming conditions rather than simply one.
Risk Management for Expanding Triangle: Why Most Traders Fail
The triangle expansion trend that we've been monitoring punishes 2 of the most important behaviours: taking on oversized positions or using a too-generous stop-loss order. With this style of trading, the way in which the trend pattern is defined is via swings that are increasingly larger. Because of this, the stop placed "slightly beyond" the outer triangle line is most likely going to be 3-5% your entry price when viewed on a daily chart. One lost trade will destroy your entire account if you are not sized appropriately.
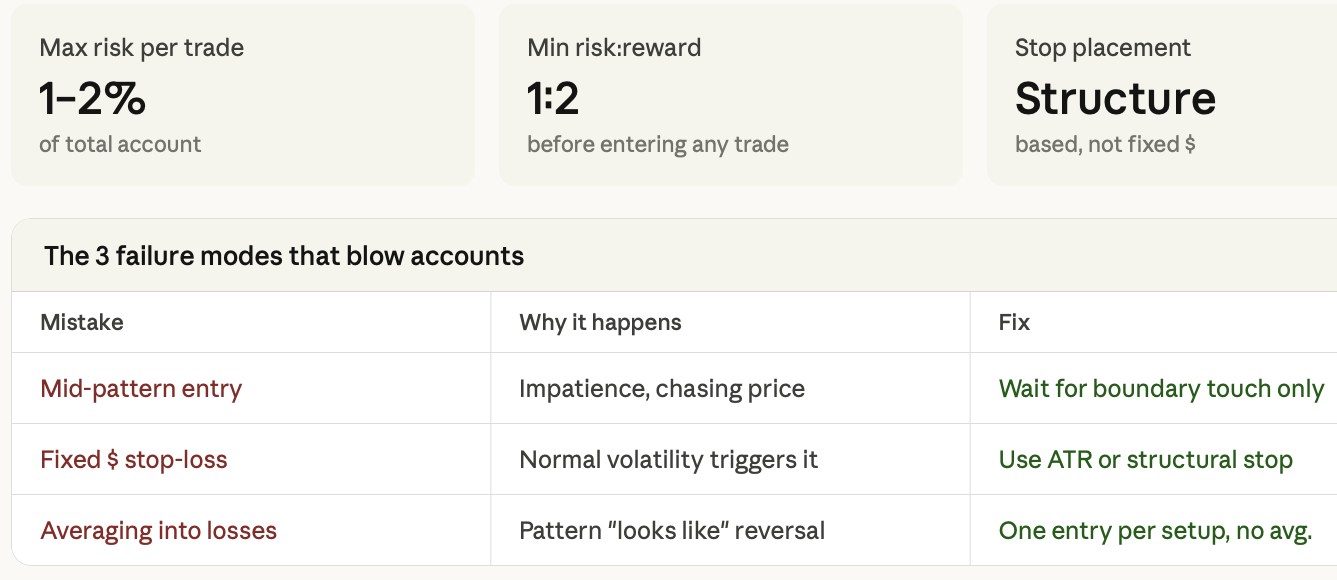
All three types of risk that commonly rob account balances from an expanding triangle trade stem from poor emotional decision-making when there is no written plan. Successful traders will consider each trade in an expanding triangle individually with a pre-established maximum loss per trade and will reduce their position size in relation to the position size they would normally utilise with more traditional setups due to this strategy having a higher chance of being stopped out before a real move occurs, versus the majority of other trade setups.
Real-World Expanding Triangle Case Studies
The price of Bitcoin (BTC) exhibits a repeated pattern of "expanding triangles" preceding a major trend shift or reversal. In the prior scenario, Bitcoin made a new all-time high and many traders entered, thinking that the price would continue to rise. There was then a significant reversal in the price, which caused the price to close below an important previous support level, followed by many panic-selling trades, causing the price to rally again sharply. All of these moves were greater than the previous extreme and generally would be telling of having formed an expanding triangle within 4-6 weeks.
The Nasdaq Index (NDX) exhibited the same pattern multiple times during the AI-related volatility in 2024. Bullish sentiment around AI allowed the index to make multiple ATHs, but with the Fed becoming increasingly hawkish and valuations being suspect, all of the corrections continued to be larger than the previous corrections. This process occurred over a multi-month period with many false breakouts resulting in major reversals in both directions.
The Crude Oil (WTI) market exhibited the same pattern, with the expanding triangle occurring through most of 2025 as a result of supply-demand volatility. In the case of WTI, there were constant swings between pricing in supply cuts and demand contracting, but the ultimate resolution of each swing generally occurred near the end of each run. The traps were created by the false breakouts at both ends, and the eventual resolution occurred after the fifth confirmed touchpoint and would align with a major OPEC+ announcement.
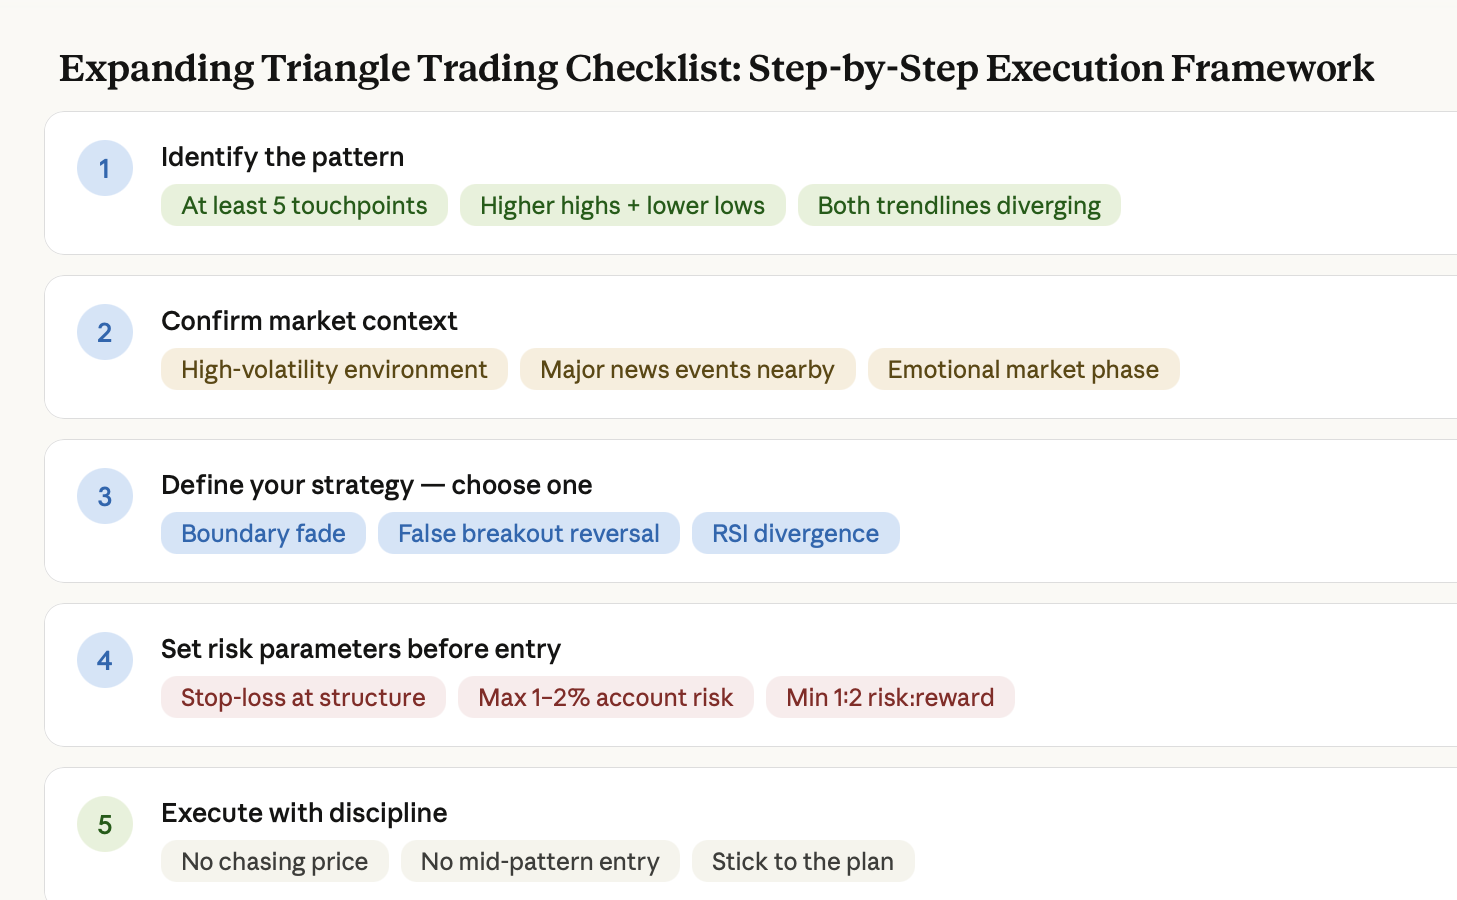
Trading in this pattern without a checklist leads to an emotional reaction rather than making decisions based upon a clearly thought-out plan of action. Market forces/behaviours have intentionally been built into the pattern, causing you to want to stray from your original plan, therefore making it essential to have one documented prior to looking at the chart.
Conclusion: Mastering the Expanding Triangle in High-Volatility Markets
If you're a passive trader who prefers clean, easy-to-read setups, you won't find this expanding triangle to be suitable; however, if you possess the qualities mentioned above, this could be a very rewarding pattern for you! In order for this pattern to be triggered, it requires five touch points, two diverging trend lines, stop-losses located at structurally invalid points, and position sizes reflective of how far apart those stops are from where the trade started.
Traders who are successful trading this pattern do not try to predict which direction will break out at the end, they manage their risk on each swing, are disciplined not to take trades in the middle zone, and size their positions small enough that they can absorb any false breakouts without suffering any significant loss on their accounts. The expanding triangle does not give you any information about where it is going; instead, it is testing your ability to trade the price action in front of you!
Ready to test your expanding triangle strategy without risking real capital?
TradeWill's demo environment replicates live market conditions with millisecond execution across Crypto, Forex, and CFD markets, meaning the false breakouts and sharp reversals you'll face in demo are the same ones waiting for you in live trading. Start your free demo at TradeWill.com and run at least 20 expanding triangle trades before you commit a single dollar to the pattern.
FAQ
What is an expanding triangle in trading? An expanding triangle is a chart pattern defined by consecutive higher highs and lower lows, creating two diverging trendlines that signal increasing market volatility and instability.
Is the expanding triangle bullish or bearish? It's neither inherently bullish nor bearish. It reflects market indecision and instability, and the final breakout direction depends on the broader market context rather than the pattern itself.
How reliable is the expanding triangle pattern? Reliability is moderate when the pattern is correctly identified with five confirmed touchpoints. False breakouts are frequent within the pattern, which is why boundary fading and false breakout reversal strategies outperform pure breakout approaches.
How do you trade an expanding triangle? The three most effective approaches are boundary fading (trading reversals from the upper and lower trendlines), false breakout reversals (entering against failed breakouts), and RSI divergence setups at the boundaries.
What markets does the expanding triangle work best in? It performs best in high-volatility markets where emotional retail participation is high, including Bitcoin, Nasdaq, Crude Oil, and major forex pairs during macro uncertainty periods.
Disclaimer: The content of the blog does not represent any position of Trade W, does not serve as any trading-related decision advice, and does not endorse any third-party.