
 Trade W

Price chart fluctuations occur quickly, with many red and green candles flashing across the chart. Because of this fast market behaviour, stops are often hit while traders are trying to determine a trend.
Price data is also noisy. One large upward candle doesn't create a trend, and neither do three very small upward candles. Therefore, you need a filter that separates noise from signal without creating so much lag that, by the time you assess the information, all entries are aged and can no longer be acted on.
The exponential moving average has the ability to meet the criteria above, unlike virtually any other type of indicator. The EMA reacts quickly to new price action while smoothing out prior price movement. Many professional traders in the forex, crypto, and CFD markets use this indicator because it focuses on recent price movement while keeping the bigger picture in mind.
You will learn how the exponential moving average works, why it works, and how professional traders who use the EMA apply it to time their key entry and exit points in live trading markets.
A brief description of EMA
The EMA is a moving average that uses historical data over a specified time frame but weighs each data point differently based on its recency.
Like grades on a test, the most recent one you took is more important than one from three months ago. In the same way, the EMA averages the price of the last set number of historical prices while giving more weight to the most recent price than the others.
The term “exponential” relates to how the weighting is calculated to create a curve that is smooth enough to respond more quickly than a simple average to price movement.
For example, a 20-period EMA takes into account the last 20 price bars but gives the most recent candle more weight when determining the overall price trend. Because of this responsiveness, traders often prefer EMAs over SMAs.
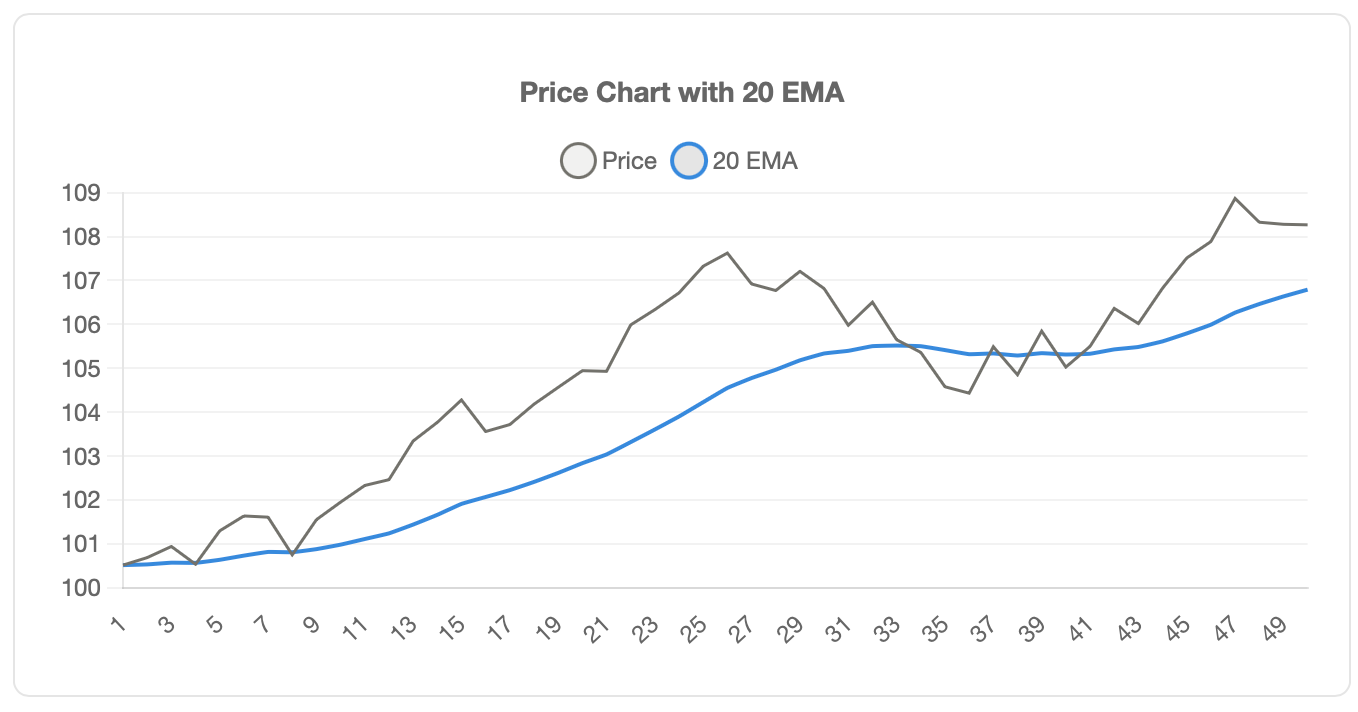
How the Exponential Moving Average Works
The EMA (Exponential Moving Average) is created using a "smoothing constant," which determines how much influence the latest price has on the average.
While the formula appears complicated, the concept is straightforward: the latest price gets multiplied by the smoothing constant, and the EMA from the prior period gets multiplied by (1 - smoothing constant), then the two are combined.
For example, with a 20-period EMA, the smoothing constant would be approximately 0.095. This means that the latest price would account for approximately 9.5% of the new EMA, while the previous EMA would account for the remaining 90.5%.
This provides a way to continuously adjust the average so that recent price movements are reflected instantly, while still preserving the context of historical averages.
In comparison, an SMA (Simple Moving Average) weights all prices over the selected period equally. Therefore, if you were tracking a 20-period SMA, a price from 20 days earlier would have the same influence as today’s price in determining the average. Once that older price drops out of the calculation, the average can increase or decrease sharply.
Because of this smooth rate of decay in weighting, the EMA does not experience the same abrupt changes in value caused by the removal of a single older price from the calculation.
Which moving average should you use, EMA or SMA?
SMA is more stable. It smooths price action to prevent traders from getting spooked by minor fluctuations. However, this stability adds lag to the SMA.
EMA is quicker than SMA. It reacts to price movement faster, typically within several price candles. However, because the EMA is so responsive, it can create false signals in choppy markets.
When making this decision, consider the following framework:
Use the EMA when trading high-volume markets. Cryptocurrencies and forex pairs can reverse quickly, so you need a faster-moving indicator. A 9-period EMA on a 5-minute chart can show you momentum shifting nearly in real time.
Use the SMA when you prefer confirmation over speed. Trend-following traders often use the 200-period SMA as a way of filtering out lower-timeframe market noise, including day trading volatility. When price interacts with the 200 SMA, those levels are often viewed as more meaningful than shorter-term moving averages.
Many professional traders follow both moving averages. They may look for potential entry points using the 50 EMA while confirming the overall trend with the 200 SMA. If both moving averages are aligned, the strength of the signal tends to increase.
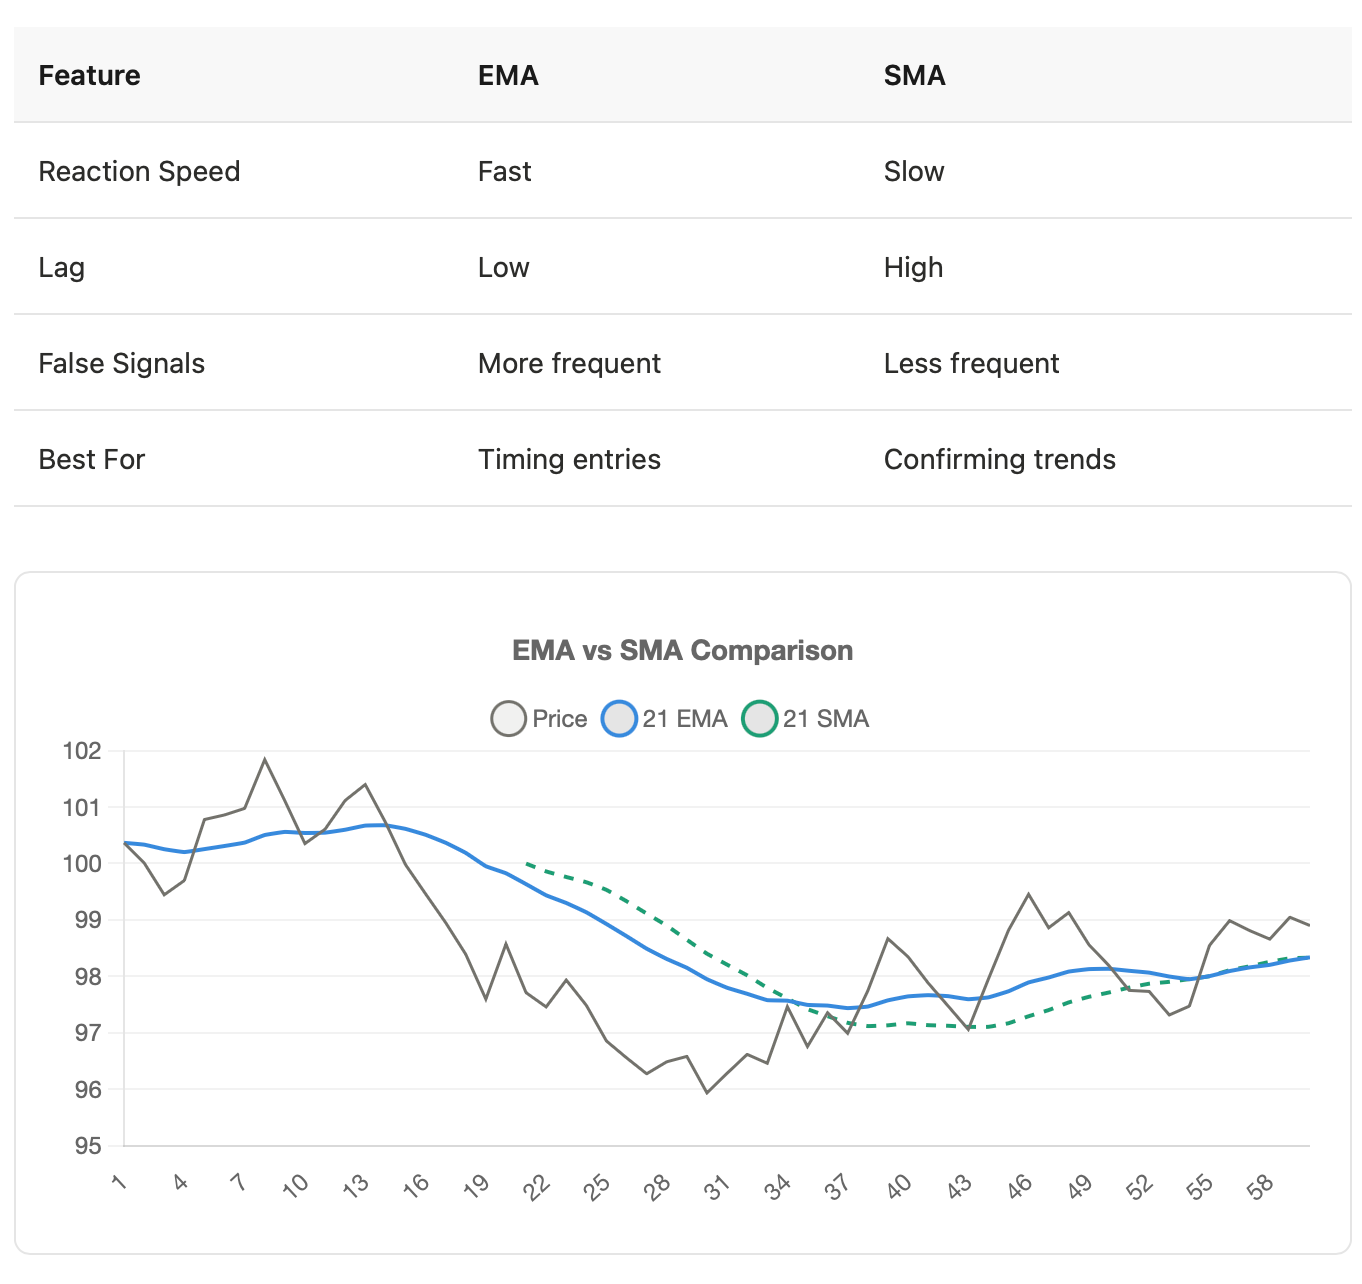
How Traders Use Exponential Moving Average in Real Markets
Identifying trend direction using an EMA is relatively simple. If the price of an asset is above the EMA, the trend is generally considered bullish. If the price is below the EMA, the trend is generally considered bearish. When price crosses over the EMA, traders often monitor the price action for a possible reversal or pullback.
Dynamic support and resistance at the EMA are where things get especially useful. When an asset is in an uptrend, it often pulls back to the 21 EMA for support. Because of its dynamic nature, it can act like a floor where traders look to buy on the bounce. Conversely, in a downtrend, price may rise into the 21 EMA and then be rejected. In that case, the EMA can act as resistance, giving traders a level to sell from.
Crossover signals are a popular method of identifying potential trade entries. A common example is using two EMAs together, a “fast” EMA and a “slow” EMA. If the 9 EMA crosses above the 50 EMA, it is considered a bullish crossover signal. If the 9 EMA crosses below the 50 EMA, it is considered a bearish crossover signal.
Crossover signals tend to work well in trending markets but can perform poorly in ranging markets, where price often whipsaws back and forth.
Professional traders often add filter conditions to crossover signals. For example, they may only consider long trades when the 9 EMA crosses above the 200 EMA. They may also require an accompanying volume to confirm the price movement. In addition, they often look for prices to be forming higher highs and higher lows before entering the trade.
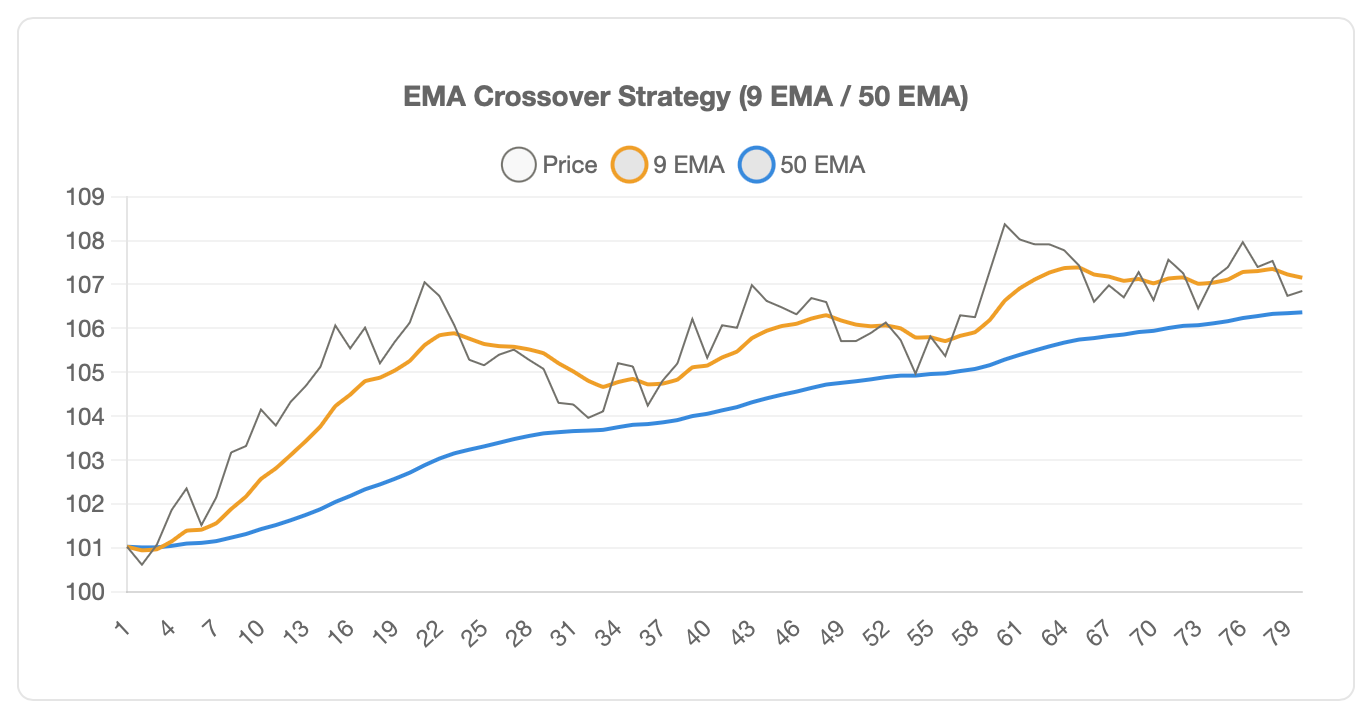
Optimal Exponential Moving Average (EMA) Settings for Forex, CFD, or Cryptocurrency Trading
There are no universal EMA settings because all markets behave differently and move at different speeds.
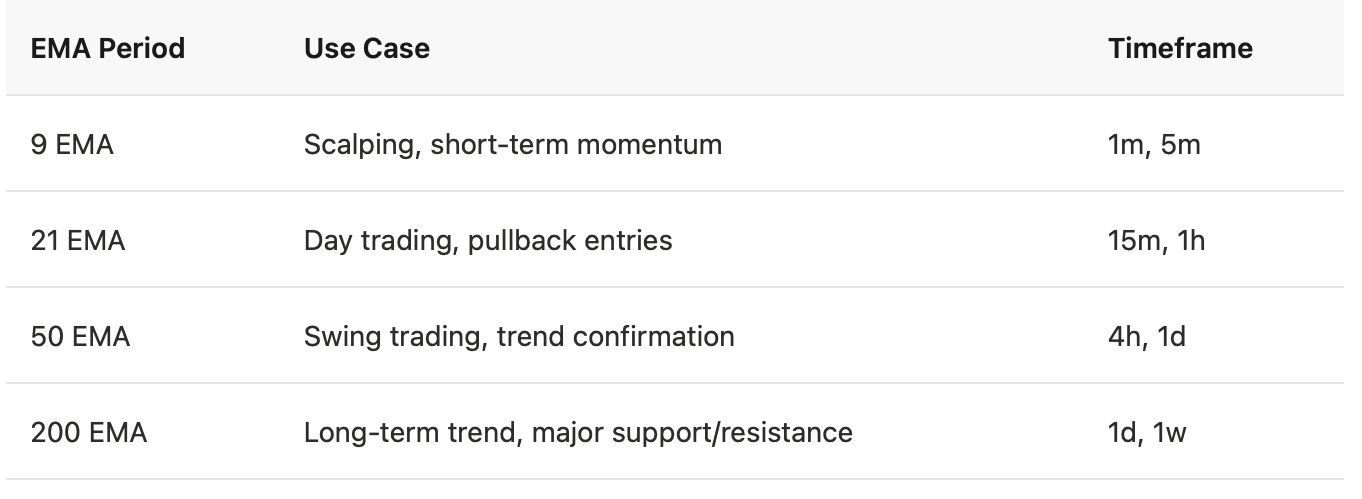
Scalpers typically work on a 1-minute or 5-minute chart using the 9 EMA to capture micro-trends that usually last between 10 and 20 candles. This allows for quick reactions while filtering out some of the noise created by other price movements.
Day traders often use the 21 EMA on a 15-minute or 1-hour chart to capture intraday trends that can last several hours. As a result, price is more likely to react around the 21 EMA than the 9 EMA because the added smoothing filters out some of the random price spikes.
Swing traders commonly use the 50 EMA on daily charts. These traders may hold positions for several days to several weeks, and the 50 EMA gives them a reference point for whether the intermediate-term trend is holding or beginning to break down.
Position traders generally use the 200 EMA on either a daily or weekly chart. The 200 EMA moves more slowly than most other commonly used moving averages. Major trend changes are often confirmed when price moves through the 200 EMA.
The key difference between trading forex and trading cryptocurrency is volatility. Cryptocurrencies typically move much faster than most currency pairs. Because of this, traders may choose a faster EMA in crypto, such as a 12 EMA, rather than using a 21 EMA that might be more common in forex. It is always worth testing multiple EMA settings to determine which one best matches the rhythm of the market you are trading.
Why the Exponential Moving Average Works
The Exponential Moving Average is effective because the market responds to new information first. For instance, if the Federal Reserve raises interest rates, the currency pair reacts immediately. This means last week's pricing is not necessarily as relevant anymore because pricing is always happening in real time. If there are more buyers than sellers, prices rise. If there are more sellers than buyers, prices fall. The EMA is useful in trading because it places more weight on the most recent prices, which is where the current imbalance exists.
The EMA is used to track recent momentum without ignoring the broader price context. For instance, the 50-period EMA does not completely disregard price movement over the previous 40 days. However, it also does not allow that older movement to outweigh what is happening in the market right now.
The reason the Exponential Moving Average works is not that it is magical. It works because it reflects the way traders naturally think about price. The most recent activity tends to matter more than what occurred a month ago, and the EMA takes that intuition and turns it into a clear visual line on your trading chart.
Why does EMA fail?
An EMA can break down in a sideways-moving market. Price may repeatedly cross back and forth over the EMA. Each time this happens, many traders may see it as an entry point. Often, those entries reverse within a few candles, resulting in a series of small losses while price itself has barely moved.
Sideways or volatile markets can weaken EMA-based strategies because when price lacks direction, the EMA begins to flatten out. Price tends to stay close to the EMA without committing to a clear trend. In these conditions, it becomes much harder to determine whether the price is likely to move higher or lower.
Another common issue is false breakouts around a flat EMA. Price may move sharply through the EMA with momentum, which can trigger an entry. Shortly afterwards, the price may reverse and cross back through the EMA. What looked like the start of a new trend ended up being only a temporary spike.
Lag is another limitation of the EMA. Although it reacts faster than an SMA, it still follows price rather than leading it. As a result, by the time the EMA confirms a reversal and you enter the trade, the price may have already moved significantly. This can reduce your potential profit while increasing your risk.
EMAs tend to work best in trending markets. If the market is ranging or moving sideways, it may be better to wait for a clearer trend to develop or consider using indicators that are better suited to range-bound conditions, such as Bollinger Bands or RSI.
Combining EMA with Other Indicators
EMA is not a reliable signal generator on its own, so it is better used as a tool to help you build context around what might happen next in the market.
For example, EMA can become much more useful when combined with divergence analysis. Price may be making a new low while the RSI is making a higher low, and at the same time, the 21 EMA may be starting to curve upward. When these conditions align, it can offer far more confidence than using the EMA by itself.
You can also filter out many weak signals by using volume. For example, even if the 9 EMA crosses above the 50 EMA, you may still want to avoid entering the trade if volume remains low. Waiting for volume to increase adds confirmation that real buyers are stepping into the market. If there is strong volume behind the move, the signal is generally more meaningful.
Another way to improve EMA signals is by combining them with price action. For example, instead of buying simply because the price touches the 50 EMA, you might wait for a bullish engulfing candle or a hammer to form at that level. This gives you an additional layer of confirmation that the bounce may hold.
This is how many experienced traders use the EMA. They build a complete framework where the EMA shows direction, volume provides confirmation that real buyers or sellers are active, and price action provides the entry trigger.
Professional EMA Trading Strategies
Using a Trend-Following Strategy
You can buy on a pullback to the 21 EMA during an uptrend. The trend is your friend until it ends. The 21 EMA can act as a dynamic level of support in the market. If price bounces off the 21 EMA, that may present a potential entry point.
Before entering a trade, verify the current trend. Price should be making higher highs and higher lows. The 50 EMA should be sloping upward, and the 200 EMA should be positioned below the current price.
You may look to enter when a bullish candle forms at the 21 EMA. Place your stop loss below the most recent swing low. Traders may choose to take profit once the price reaches the nearest resistance level or continue riding the trend until the price closes below the 21 EMA.
Using a Pullback Strategy
Wait for a strong move away from the 50 EMA. When price extends too far from the 50 EMA, momentum often begins to slow as traders take profit. As price retraces back toward the 50 EMA, buyers may begin stepping back into the market.
This strategy is commonly used on longer timeframes, such as the 4-hour chart, where the 50 EMA has already shown itself to be a meaningful support level. A pullback to the 50 EMA on a 4-hour timeframe can often mark the end of a correction within a broader trend.
You may look to enter when the price reaches the 50 EMA and shows a reversal signal. A doji candle, hammer candle, or bullish engulfing candle forming at the 50 EMA can all serve as potential confirmation. Place your stop loss just below the 50 EMA. A common target is the previous swing high.
EMA Ribbons
Create an EMA ribbon using at least five EMAs across multiple settings, such as 8, 13, 21, 34, and 55. The strength of a trend becomes more visible when all five EMAs are aligned in the same direction. When they are tangled together, it often suggests there is little or no clear trend.
Trade the expansion of the ribbon. Momentum tends to build when the EMAs begin expanding away from one another. Momentum often starts to fade when the EMAs begin converging back toward each other. Traders may look for entry opportunities during the expansion of the ribbon in the direction of the trend and may consider exits as the ribbon begins to converge.
Avoiding Common EMA Mistakes
One mistake some traders make is relying solely on EMAs for buy or sell signals. Just because there is an EMA crossover does not always mean a trader should enter a trade. Many traders fail to consider volume, trend structure, and price action when relying only on EMAs to make decisions. The result can leave traders frustrated and with poor win rates.
Another mistake is using the wrong timeframe with EMAs. If you are a scalper using the 200 EMA on a 1-minute chart, the EMA may not be very useful for your strategy. If you are a swing trader using the 9 EMA, you could easily get stopped out on normal pullbacks. Your timeframe should match your trading style when choosing EMA settings.
Not considering the overall market context can also lead to poor trades. If an EMA crossover occurs in a sideways or range-bound market, it may not provide a reliable signal. You may not get meaningful support or resistance from the EMA if the broader market lacks direction. Always check higher timeframes before acting on an EMA signal.
Adding too many EMAs to your chart can also create unnecessary complexity without improving your trading decisions. Having five EMAs on your chart may look sophisticated, but it does not automatically improve performance. Most professional traders use only two or three EMAs and focus more on execution, discipline, and reading price action than on building a crowded chart full of indicators.
EMA Trading Decision Framework
Confirmation of Trend: Is the price above the 200 EMA? If so, look for opportunities to go long. If the price is below it, look for selling opportunities or stay flat.
Volume Check: Is the current move supported by volume? If the volume is below average, it may be best to pass on the signal. If volume is increasing or showing spikes during the move, it suggests stronger momentum behind it.
Control Risk Before Entry: Where is your stop loss? How much are you willing to lose? Where is your target? If the risk-to-reward ratio is worse than 2:1, it may be better to pass on the trade.
Timing the Entry Using Price Action: Don’t buy just because price is at or near the 50 EMA. Wait for a reversal signal that suggests sellers are losing control, such as a hammer, engulfing candle, or doji.
Confirmation matters more than speed. Missing an early entry is often better than entering too soon and taking a loss on a false signal.
Frequently Asked Questions
What is an exponential moving average?
EMA is a technical indicator that averages price over a specific period while giving more weight to recent prices. This makes it react faster to price changes than a simple moving average.
How is EMA different from SMA?
SMA gives equal weight to all prices in the selected period. EMA gives more weight to recent prices and less weight to older prices. This makes the EMA more responsive to new price action.
What is the best EMA setting?
There is no universal best setting. Scalpers often use the 9 EMA, day traders may use the 21 EMA, swing traders commonly use the 50 EMA, and position traders often use the 200 EMA. The best setting depends on your timeframe and trading style.
Is EMA reliable?
EMA can be reliable in trending markets. It tends to be less effective in sideways or choppy markets where false signals are more common. Many traders improve reliability by combining EMA with volume and price action confirmation.
How do traders use EMA?
Traders use EMA to identify trend direction, find dynamic support and resistance levels, time entries on pullbacks, and spot possible reversals through crossovers. It tends to work best when used alongside other forms of confirmation.
Start trading with confidence using professional-grade tools and real-time market data. Join thousands of traders who've improved their results with the right platform.
Disclaimer: The content of the blog does not represent any position of Trade W, does not serve as any trading-related decision advice, and does not endorse any third-party.