

 Trade W

Why Understanding Inventory Methods Can Save Your Investment
An often-overlooked element that affects many investors is that the profit number found in a company's financials may not show the entire picture. Before either celebrating the amount earned or panicking about losing money, an investor needs to ask themselves: What method does this corporation use to value its inventory?
There are various ways to account for inventory; the method a company uses can significantly impact the profit reported. In some cases, millions of dollars can change just from the method that was used to account for inventory. The accounting method used is not illegal; it is disclosed on the footnotes of the financial statements, yet most casual investors tend to disregard this information and focus solely on the ending profit number.
FIFO stands for First In and First Out, a method used by many corporations in accounting for inventory, which assumes that the older inventory is sold first. It may sound simple; however, FIFO can create an inflated profit number during times of rising costs.
For example: If you had a coffee store and bought 100 bags of coffee beans for $10.00 each, and the following month the same bag of coffee beans cost $15.00, then when you sold one of those bags, you would record the cost of those bags as $10.00 for stock you purchased first but when you replace it at $15.00, you would not have that same profit margin on that bag. Therefore, even though you see an increase in profit when looking at the records, it actually is not accurate when you start to see a decrease in cash flow because you cannot restock at those costs.
FIFO, LIFO (Last In, Last Out), and Weighted Average are the three major inventory methods used by all companies. In each case, a company could report their profit differently based on how it accounts for inventory using only the same business operations under the same conditions. During times of inflation, such as recently, these methods would show various results or profits at different percentages.
A manufacturer that follows FIFO could report their profit margin at 20%, whereas a competitor following LIFO would show only a profit margin of 15%, even though both companies are performing at the same level during the same timeframe.
Another area of concern is "window dressing". Company management teams know analysts follow profits and investing. They know they can report adding to their profits by using FIFO in these inflationary periods: as profits rise through FIFO, not necessarily improve operations or market share. This adds to the perception of profit but is merely an accounting fantasy.
As an investor, this creates a trap. If you purchase stock, thinking you have found a good deal on profits alone, you will soon see that the company is experiencing lower actual economic profits than the financial statements disclose. You may also bypass the investment and overlook the true discounted value of a company using LIFO because the profit number on that company appears weak compared to another company using FIFO.
FIFO is more than accounting trivia; it is essential to anyone interested in the analysis of financial statements. The knowledge to connect profits to the method used to account for inventory will enable you to have X-ray vision of a company. You will be able to distinguish between operational gains and the accounting illusion of profit gain.
The risk is serious! Professional investors and analysts continually adjust earnings based on inventory methods when making investment decisions. If you do not, you are missing information and, in today’s markets, where every advantage is needed, this is a risk that you cannot afford.
FIFO Explained: Concept, Mechanics, and Accounting Logic
Let's strip away the frills and get to the guts of FIFO. FIFO assumes that the inventory purchased first will be sold first; therefore, when a bakery receives fresh bread every morning and places it behind yesterday's loaves for sale, customers will naturally buy the older loaves first because they are in front of the fresh loaves. This is FIFO at work by removing older inventory first.
For accounting purposes, FIFO matches the cost of the inventory that is being sold to the sales revenue generated during the time period being accounted for. When a bakery sells an item, it records the cost of that item (cost of goods sold, COGS) based on the price of the inventory purchased at the beginning of the accounting period, rather than the price of that inventory as it would be purchased today.
The interesting piece is that the ending inventory held on the balance sheet is valued at the most recent purchase prices of inventory, which is the market value of inventory at the end of the accounting period.
In contrast to FIFO's assumption that the oldest inventory will sell first, LIFO assumes that the newest inventory will sell first; therefore, COGS will show more recent, higher costs, while ending inventory will show older, lower costs. The weighted average method will take the average of all the purchase prices of a company.
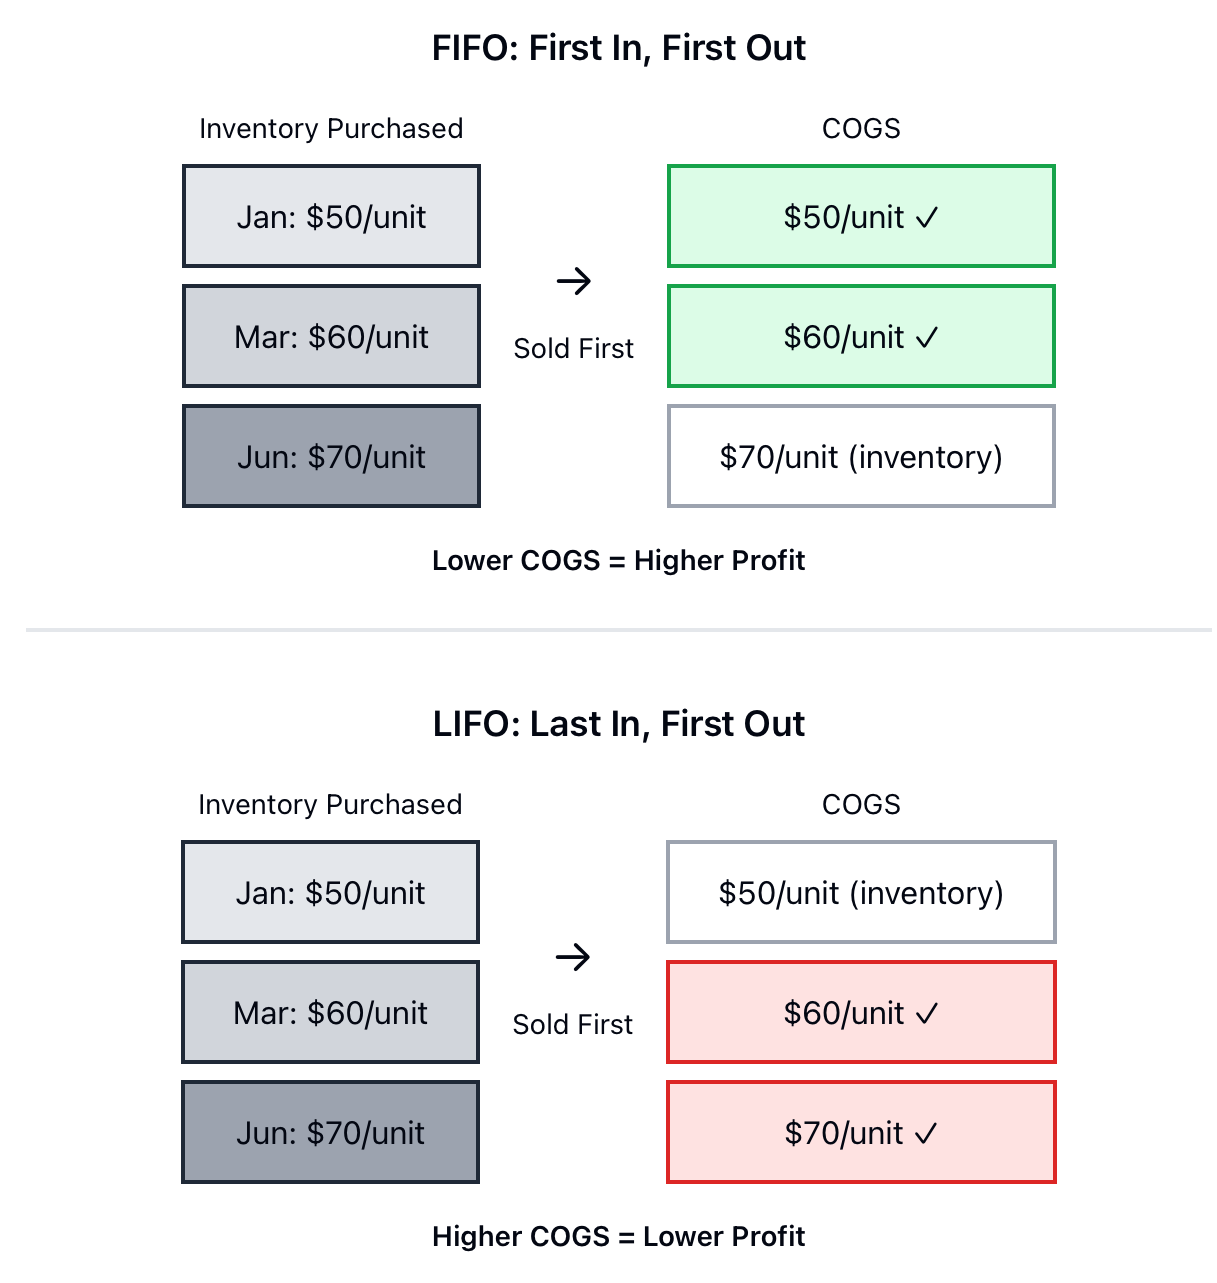
Let's put some numbers to this. Say you're a retailer who bought:
-
January: 100 units at $50 each
-
March: 100 units at $60 each
-
June: 100 units at $70 each
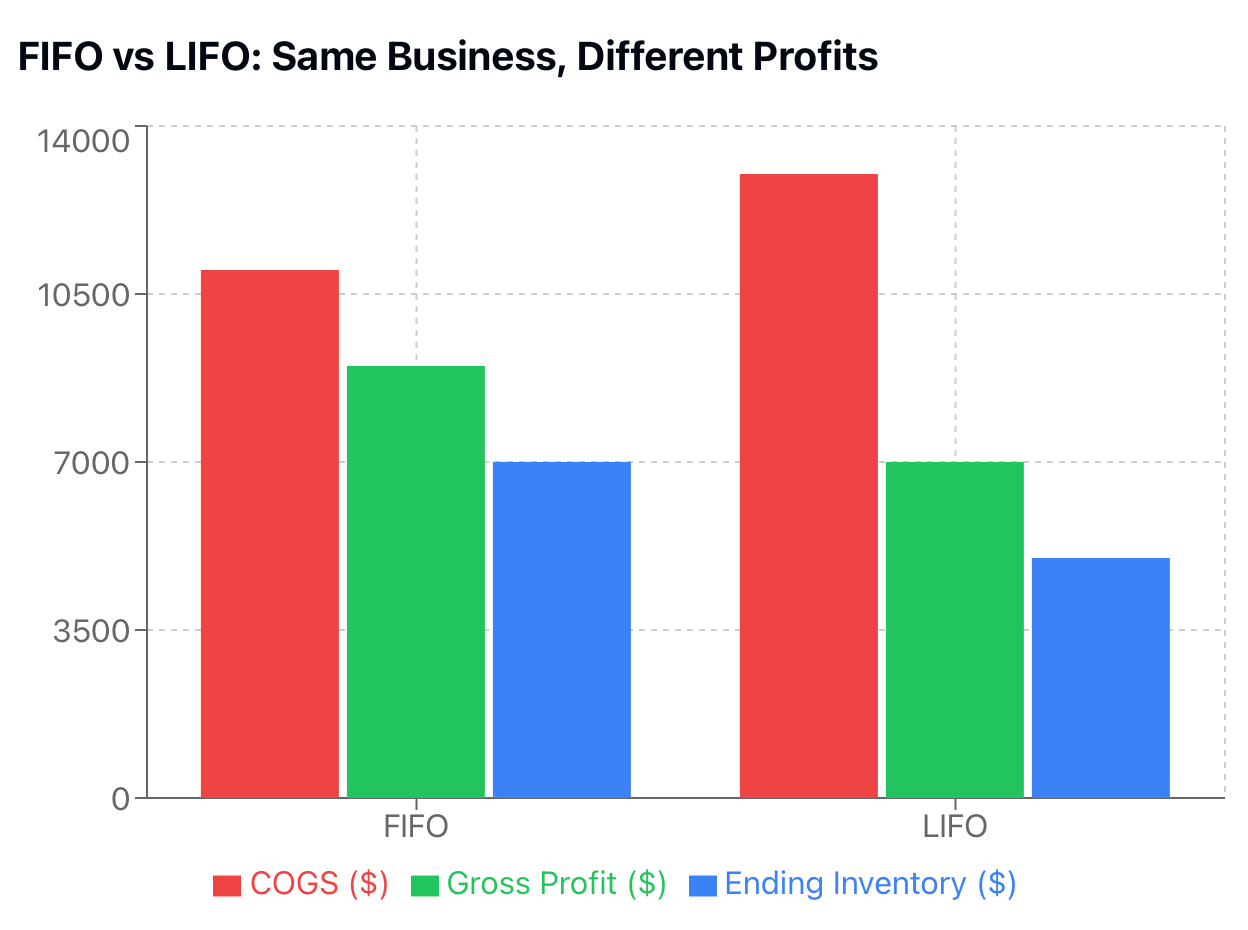
You sold 200 units during the year for $100 each. Under FIFO, your COGS would be (100 × $50) + (100 × $60) = $11,000.
Your ending inventory: 100 units at $70 = $7,000. Gross profit: $20,000 - $11,000 = $9,000.
Under LIFO, it flips. COGS becomes (100 × $70) + (100 × $60) = $13,000. Ending inventory: 100 units at $50 = $5,000. Gross profit: $20,000 - $13,000 = $7,000.
The two different methods by which a company calculates its profit are FIFO and LIFO. Although the same sales volume, the same cost and the same business overall are used for both, FIFO shows a $2,000 (two thousand dollars) higher profit than the LIFO method of accounting. They both "correct" the profit numbers they are showing, but each shows the profit of the business in a completely different manner.
The weighted average method takes an average of the prices paid for the items on a per-unit basis and applies that average price to all units. In this case, the weighted average would be and would therefore be $60. This method's conclusion would lie somewhere between the profit calculated by FIFO and the profit calculated by LIFO.
The reason FIFO works as an accounting method is that it utilises the matching principles in accounting to value the inventory of a business. It is believed that FIFO is a more accurate representation of the physical flow of inventory for most businesses. Most perishable goods will always be sold in the same order as they were originally purchased. The logical approach to a business with non-perishable products would be to sell any product that is getting close to being obsolete or damaged before the product becomes damaged or obsolete.
However, it is important to note that while an organisation may operate on the physical-first inventory principle, it does not mean that it should account for inventory costs using this same principle. A business may ship out the first product it receives and account for its costs using the LIFO (last in, first out) method. Hence, the specifications of FIFO and LIFO do not apply to individual items within the business; they apply to how costs are assigned to inventory.
The flexibility of the FIFO inventory cost assignment method makes it an advantageous tool for managing profit. When costs are highly variable due to changes in the marketplace, such as inflation, disruption in the supply chain, or rising commodity prices, FIFO systematically lowers the cost of goods sold by matching the older, cheaper cost of goods to the current sales price. On paper, the profit margin looks great, but the business is creating revenues from current sales and costs from yesterday.
Investors need to know the accounting method used by a company to determine the company's profit, so it is critical when looking at financials to be aware of the accounting method used, along with the changes in price over time that will affect how a company accounts for inventory.
How FIFO Affects Profit, Margins, and Taxes
Inventory accounting via FIFO (First In, First Out) has implications so wide-reaching that their impact on financial results can be experienced by nearly every measure used to evaluate the Company's fiscal performance by Investors; Reporting Profit is most closely associated with the use of FIFO.
A portion of the Profit "boost" resulting from FIFO Accounting during times of Inflation is not the result of increased Product Sales or Improved Efficiency, but merely an accounting method that resulted in the Cost of Goods Sold (COGS) being matched from the oldest inventory (when prices were lower) to the Company’s current Revenue. Therefore, the larger the difference in value between the Older Cost of Inventory and the current price of inventory purchased, the larger the "inflated" Profit.
FIFO’s effect is magnified for Manufacturers that purchase Raw Materials in an increasing Price Environment. For manufacturers, FIFO will continue to show Manufacturer’s Gross Margins as improved (inflated) based on FIFO’s effect, but the actual profitability is well below these inflated amounts.
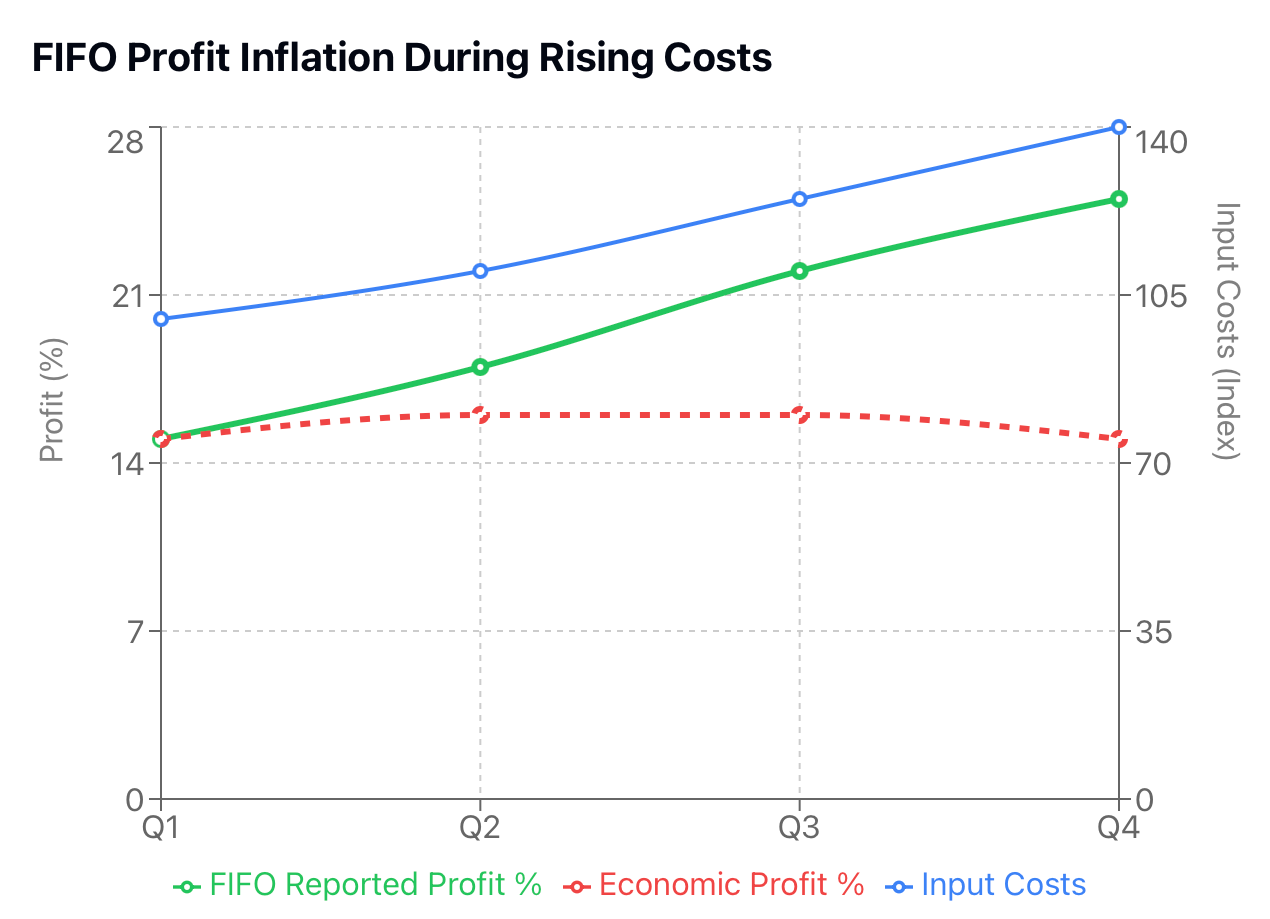
For Example, if a Manufacturer Purchases Steel during the calendar year, and over that period of time, Prices on Steel Increase by 30%, FIFO will show Gross Margins Inflated versus the Manufacturer’s Realities of Gross Margins. FIFO will also give an Imbalanced / Incorrect Support to Investors regarding the Company’s profitability at Replacement Cost.
As mentioned before, the increase in Profits as reported through FIFO results in an increase in Taxable Income. From a Competitive Perspective, FIFO increases the Federal Tax Liability associated with Rising Prices due to Inflation, while LIFO reduces the Federal Tax Liability due to the Higher Prices of the most recently Purchased Inventory, matching Company Revenues.
Consequently, the FIFO Method creates higher cash taxes related to these Inflated Profits – companies are required to Pay Actual Cash Taxes as a Result of these Inflated Profits based on FIFO Accounting. To understand this Concept further, one must analyse cash Flows associated with FIFO Accounting and not solely rely on Profits as reflected in Financial Statements.
It is possible to Isolate Cash Flow related to taxes paid on profits that had no economic substance for the company, due to a Situation where the company would need to replace the Inventory at Current Prices. Although this scenario may seem to be only a theoretical exercise, it illustrates the actual cash outflows related to business and the Government as a result of accounting procedures and not actual economic activities.
Gross margins and net margins can both become distorted. Because gross margin is derived from gross profit, the under-reporting of cost of goods sold (COGS) under the first-in, first-out (FIFO) method can lead to inflating gross margin when compared to the last-in, first-out (LIFO) method.
Net margin is also a function of gross margin, and therefore, it would also be inflated when calculated using FIFO. In either case, if an investor compares two companies that are otherwise similar, they may favour the company that uses FIFO since their financial statements indicate a higher gross margin; however, they are indeed looking at an apples-to-oranges comparison.
Some inventory turnover ratios (i.e., the COGS divided by average inventory) can also be distorted. The ending balance of inventory on the FIFO method will be higher due to the inclusion of newer inventories, and therefore, the COGS will be lower than what would be reported under LIFO, since COGS would include older inventories at lower costs. As a result, companies using FIFO will show a slower inventory turnover than those using LIFO and probably will be concerned about having excess or obsolete inventories when neither of those conditions would actually exist.
Another measure that is distorted is return on assets (ROA). An increase to both the numerator (net income) and denominator (total assets, which would include higher-priced inventory) will artificially inflate the ROA when calculated using FIFO. This may present some companies with an opportunity to present a higher ROA than their actual capital use efficiency.
Most importantly, FIFO can lead to significant disconnects between reported net income and cash from operations. Cash flow statements show actual inflows and outflows of cash, while net income may reflect inflated values through FIFO accounting; therefore, the cash needed to replenish additional inventories will be greater than what the reported net income shows. It is possible to be reported as being "profitable" while losing money on a cash basis.
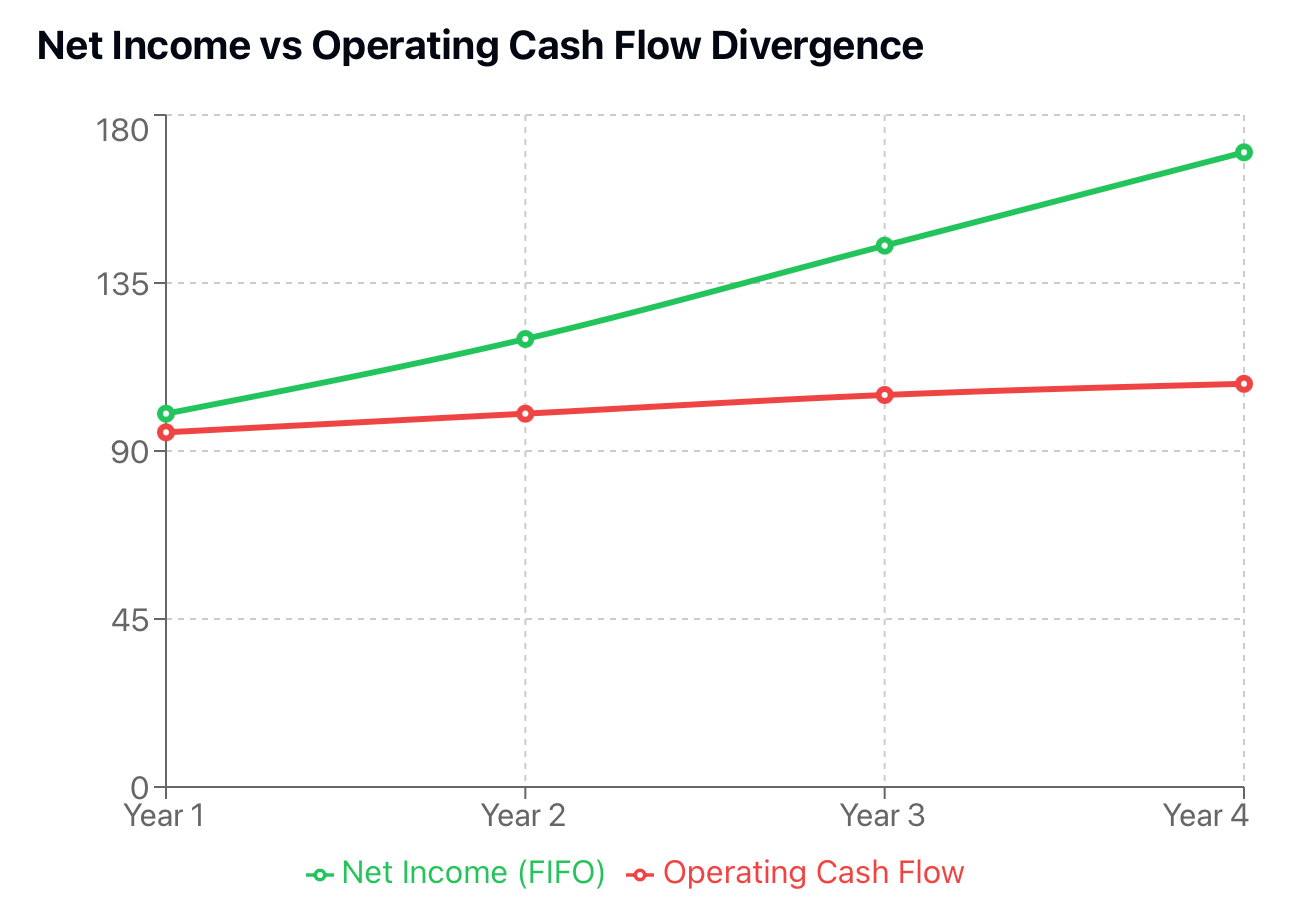
Smart investors will always evaluate quarterly and annual profit trends against the trends of cash generated from operations. If a company's profit and cash trends diverge, and there is a widening gap between profit and cash flow, this may be caused by FIFO-induced window dressing.
Taxes are an additional area of concern. Several companies have elected to use LIFO during inflationary periods to lower the tax liability during those inflationary periods; subsequently, the profit reported by those companies will generally be lower, but their cash outflow will be reduced.
In fact, the use of LIFO may be more economically advantageous for the company even though it results in less impressive results on the income statement. FIFO companies must incur the cost of having higher income statement profit numbers, but this will ultimately require them to incur cash to replace inventory due to FIFO accounting.
Red Flags: Detecting Profit Window Dressing with FIFO
While many investors know how FIFO works, spotting when companies manipulate FIFO to mislead investors is not always so easy. There are some very obvious warning signs that investors can look out for. The most obvious is that profit increases during times of increasing input costs. If you see strong earnings growth at the same time as increases in the news regarding inflation, supply chain cost pressures or commodity prices, it's time to get suspicious. Look at the company's footnote inventory and check the valuation method.
Another warning sign is when inventory growth is greater than sales growth. If a company's inventory grew 15% and revenue grew only 5%, there is definitely something wrong. The company is either building up too much inventory expecting to sell it in the future, or they have too much inventory with a higher cost that will eventually be included in the Cost of Goods Sold (COGS). Either way, either of these scenarios will create margin pressure in the future.
If a company's gross margins are unusually high or are improving, it should get the investor's attention. The investor should compare a company's margins to those of its competitors in the same industry and compare historical averages. If a company's margins are improving while its competitors using LIFO are experiencing a decline in margins, it is more likely that what the investor is seeing is an accounting issue than a continuing operational success for the company. The investor should also check to see if improving margins are occurring while input costs are increasing- a classic indication that FIFO is masking future problems.
An investor should also pay attention to the discussions of the company's executives during earnings calls and the candour shown in the MD&A section of the financial report. An investor should be concerned if the management discusses an increase in input costs as a significant factor affecting gross margins, and the gross margins remain high. FIFO may be causing the management to hide future problems. Significant changes will occur when the current COGS cease to exist in the future due to the increasing cost of inventory purchases.
Footnotes are a great source of information, as all companies must indicate in the financial statement notes what method has been used by the company to account for its inventory. Review not only the method being used but also how often it has been changed in recent history. Any variation from LIFO to FIFO in a rising economic climate is a big warning sign. While companies must disclose the changes in inventory accounting and their effects on the business, the real reason to make these changes is often to increase reported profits.
Quarterly statements can help indicate the impact FIFO has over time. As the time between receipts of inventory and the sale of that inventory continues to extend and costs continue to rise, a company may appear to have increasing profits in later quarters, as compared to earlier quarterly statements, even if the sales and profits have levelled or clearly decreased due to the rapidly increasing costs created by FIFO accounting.
A ratio comparing the amount of inventory to the amount of COGS will provide additional information about the company's profit potential. Divide the amount of inventory being carried by the amount of COGS calculated quarterly or annually, and if the inventory to COGS ratio is rising, that indicates to you that you're going to see an increase in the amount of inventory carried at a higher cost; when that inventory is sold at a time when prices are still stable, there will be a decrease in profit margins.
As a general approach, consider the reconciliation portion of the operating cash flow statement. The reconciliation component gives you information about the adjustments made to get from the net income to an operating cash flow. The larger the difference between the amount of net income being reported and the changes in the amount of inventory, the more significant the disconnect between net income and cash flow is.
Therefore, if the net income continues to increase and the operating cash flow remains relatively flat or decreasing, that might indicate that FIFO accounting is producing Non-Operating Profits.
Closely monitor retailers and manufacturers within capital-intensive industries. With their high level of inventory and the changing costs of the raw materials needed to produce that inventory, these companies have a greater risk of engaging in earnings manipulation using FIFO methodology.
Specifically, companies that produce high-dollar items with longer production times (e.g., automobile dealers or manufacturers of heavy-duty equipment) will see particularly significant effects from FIFO on their profitability.
Inventory is often measured in "days." To calculate the number of days the company has in inventory, simply divide the amount of inventory by the daily COGS. As the number of days increases, it can often suggest that the company's inventory turnover is slowing and/or that the company is carrying additional inventory. A combination of increasing days-to-inventory with FIFO accounting will typically result in the compression of profit margins.
One last “sophisticated” recommendation would be to determine the impact that FIFO has on earnings. You can begin this analysis by converting the company's reported earnings under FIFO to what the company's earnings would be under replacement costs, rather than FIFO historical costs.
The difference in those two amounts will give the analyst insight into the amount of profit that was actually created through the process of lowering the goal's total costs to the present-day replacement value of the product sold.
Investor's Practical Guide: Using FIFO Analysis in Financial Statements
It is time to take a systematic approach to FIFO-aware financial analysis.
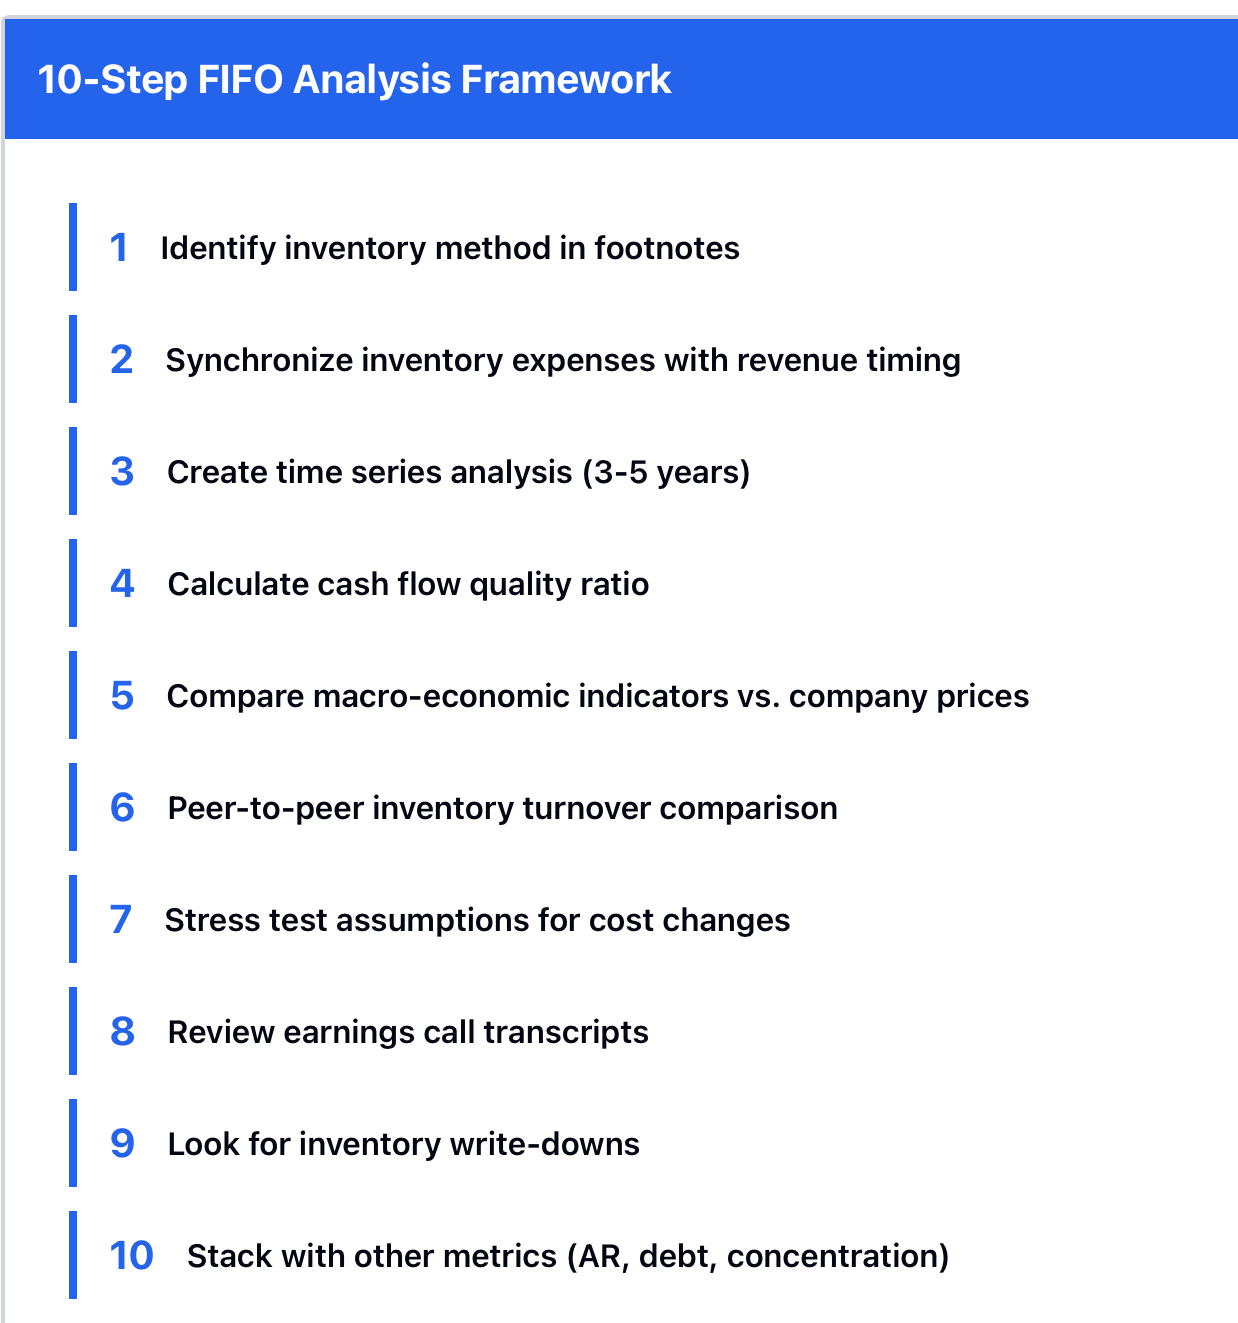
Step 1: Identify your inventory method: Before you make any other decisions based on a financial statement, look for the footnotes. Look in the first few notes under "Summary of Significant Accounting Policies" for the company's inventory accounting policy. Be sure to make a note of the company's inventory accounting method and any changes made to the inventory accounting method recently.
Step 2: Synchronise inventory expenses with revenue timing: Review the statement of income and the statement of financial position together. Determine when revenue was realised and assess inventory expenses for periods of revenue according to FIFO assumptions (first in, first out). If there is a considerable time lag between the date of the inventory purchase and the sale date, you need to modify your analysis to account for any price change that may have occurred in between these dates.
Step 3: Create a time series analysis: Take quarterly or yearly information for the past 3-5 years for gross margin, net margin, inventory levels, and COGS as a % of revenue (sales). Find out if there are patterns between inflation and commodity price cycles. For example, if your company uses FIFO, it will expand its gross margin while the costs are rising and compress its margin when the costs are steady or decreasing.
Step 4: Determine the quality of cash flow: Divide operating cash flow by Net Income. If the ratio of Operating Cash Flow/Net Income is less than 1.0 for an extended period of time, the earnings may be of poor quality. In addition, if the ratio is decreasing while management is reporting high profit margins, then FIFO-related inventory increases are likely taking up a large portion of the company's cash position. This is an early warning sign of potential problems.
Stage 5: Comparing Macro-Economic Indicators Against Company Price Indexes: Macro-Economic Indicators should include Price Indexes for Commodities (for example, metal products) and include Price Indexes for Manufactured Goods, or specific benchmarks by way of Company or Industry-specific Costs associated with the Raw Materials used by the Company. For example, Steel Prices increased 25% as compared to COGS increasing 10%. We can therefore conclude that FIFO was part of this shift of product, thus restricting the margin of soon-to-be-sold inventory that was purchased before this price increase.
Stage 6: Peer to Peer Comparison of Inventory Turnovers: First, determine the Ratio of Turnover (COGS ÷ Average Inventory) of your Inventory compared to the inventory of the Competition. Then observe the differences between FIFO Inventory versus LIFO Inventory Turnover Ratios that have been calculated. For example, if a company has a Turnover Ratio lower than its competition (LIFO), but the company (FIFO) is operated better (assuming they do not “count” FIFO specifically when calculating operating costs).
Stage 7: Stress Testing Assumptions: If Cost is stabilised/reduced due to Market Volatility, how would this affect your margins in the future? For example, if using FIFO, consumption will mean that the company has had to use older (higher cost) Inventory to create COGS. How much of that risk exposure does the company carry? This Assumption is essential to the Valuation, so do not be willing to pay a premium for the Earnings that are the result of FIFO.
Stage 8: Identifying Comments in Earnings Call Transcripts Regarding Inventory Management: Look for accurate references to how the Company purchases materials, how they manage the process of Inventory Management and what their stance is on Raw Material Costs, without specific clarification of the various Inflation Impacts that have occurred in the Inflationary environments in their suppliers’ Economies. If a Company has shown an inability to provide an adequate explanation of the pressures they face regarding their Costs and, in particular, assumes that the Inflationary Impact is insignificant or the effects of FIFO, they may not be controlling their Prices to the extent they should.
Step 9: Look for inventory write-downs on the footnotes and MD&A, looking for obsolescence charges for obsolete inventory or write-downs to market value. High frequency of write-downs combined with a reporting method such as FIFO indicates that inventory management is poor and being masked by the use of advantageous accounting methodologies.
Step 10: Stack it up with other metrics: FIFO should not be viewed in isolation, but evaluated in conjunction with the trends of accounts receivable (rising accounts receivable and rising inventory levels indicates deterioration in demand), customer concentration (a company’s reliance on only a few customers increases the risk associated with dependent relationships) and the amount of debt companies with high levels of leverage will be unable to sustain margins when the FIFO effects are reversed.
Create a straightforward spreadsheet to monitor performance data quarterly. Identify periods with expanding margins but diminishing liquidity, and periods where inventory levels increase faster than sales volume. These should be used as indicators for further analysis.
Keep in mind that FIFO is not a negative basis of accounting. FIFO accounting is often utilised legitimately by many businesses as it helps to support their sales volume, physical inventory movement, and other accepted industry practices; therefore, while you don't want to eliminate FIFO-based companies from your list, you do want to be able to ascertain the economic realities beneath the financial statements. With an understanding of the economic realities behind the financial statements, you can make superior investment decisions compared to those investors who only focus on the reported earnings.
Conclusion: Your FIFO Analysis Action Plan
Analysing FIFO enables you to become an active investigator rather than a passive consumer of financial statements about the actual business being analysed. The central insight here is simple, but powerful: Profits are always a construction of accounting principles, each of which can differ widely among companies that look absolutely alike from a business perspective. The FIFO method is one accounting principle and tends to create a profit statement that looks much more appealing than the underlying economic fundamentals; hence, during periods of inflation, the FIFO method produces a higher profit statement than the reality.
The use of FIFO doesn't mean companies using FIFO are poor investments. In fact, some businesses that use the FIFO method are likely to represent incredible investment opportunities because the market has yet to understand the consequences of using FIFO to create inflated profit statements, while the market has overlooked anticipated declines in gross margins and underappreciated cash flows being generated by those businesses. Being able to separate fact from illusion is vital.
As you analyse any company's results, place profit numbers in context, including how inventory was accounted for; compare earnings and cash flows; examine inventory levels against sales; and look for signs that material costs may be decreasing. Following these few steps should help you see the underlying information that is missing from profit headlines.
This analytical approach is universally applicable. Whether you're analysing a North American retailer, a European manufacturer, or an Asian distributor, these analytical approaches hold true. FIFO is recognised under both US Generally Accepted Accounting Standards and International Financial Reporting Standards, so these analytical approaches are applicable worldwide.
Different industries will have different levels of scrutiny based on the amount of capital invested in inventory. Capital-intensive manufacturers and retailers with large inventories will require a greater degree of scrutiny than service-related firms with minimal inventory. Adapt your analysis to fit the respective industry and business model.
The real benefit of mastering the FIFO approach is not merely to save yourself from investing in poor businesses but to identify good businesses that others have overlooked. For example, you may have seen a LIFO company's low earnings in times of inflation, while others would have missed the high cash flows generated by the business and lower future tax burden. Conversely, when some see FIFO profit growth, they look for early warning signs of deteriorating cash flows.
Developing this skill takes time and practice. Over time, using these analytical methods to analyse financial statements will improve your ability to accurately interpret what the numbers actually mean. You will be able to quickly recognise different patterns and identify warning signs much more quickly, thus providing the opportunity to investigate new opportunities more efficiently.
Ready to move beyond surface-level profit numbers and uncover real business performance? Explore Tradewill's advanced financial analysis platform, where we automatically flag inventory accounting distortions and help you compare companies on a level playing field, so you can invest with confidence based on economic reality, not accounting illusions.
Disclaimer: The content of the blog does not represent any position of Trade W, does not serve as any trading-related decision advice, and does not endorse any third-party.