

 Trade W
The high levels of volatility and leverage in the forex and CFD markets can be rewarding but are also well-known for being risky. While lucrative opportunities attract millions of traders across the globe, the reality is that the vast majority of retail traders lose money due to a lack of risk management strategies.
Therefore, it all comes down to a fundamental question: If a single currency pair exposes you to concentrated risk, how do you reduce that incurred risk while still retaining the possibility for profits?
The answer is currency pair correlations, a complex concept that is easy to use and can show you the "web of relationships" between different currency pairs. You can think of correlations as invisible connections in the forex environment between different currencies that create patterns that risk-savvy traders can use to their advantage to reduce risk.
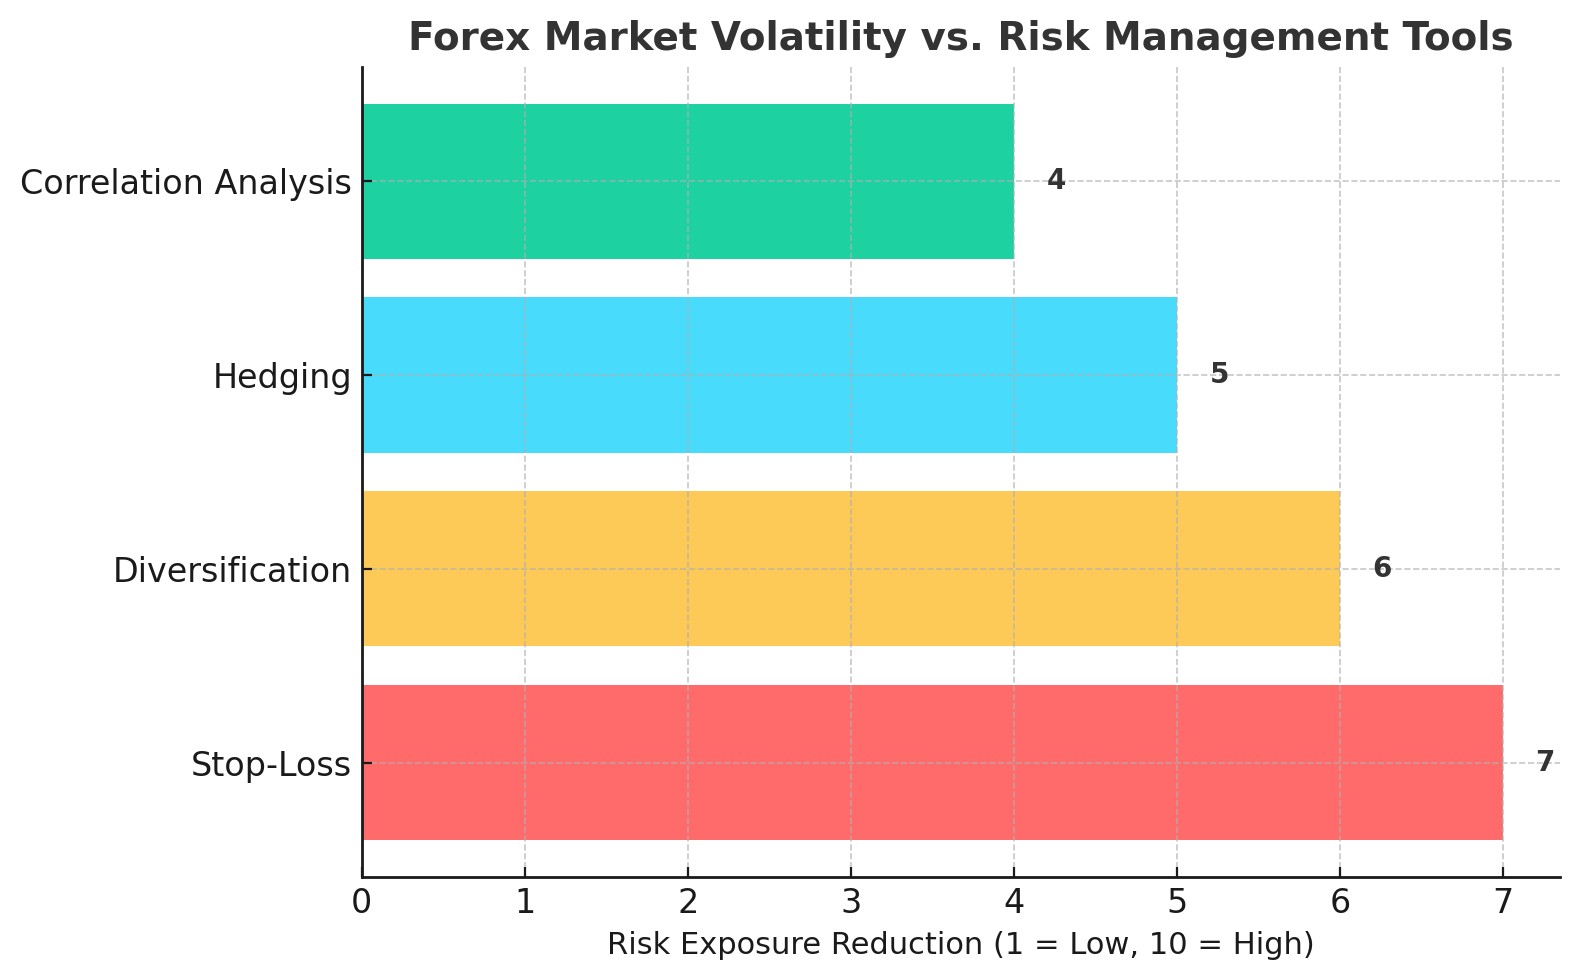
For example, during the 2008 financial crisis, professional traders who understood the relationships between the major currency pairs took losses that were substantially smaller than the loss of value on portfolios that lacked any understanding of those relationships.
This thorough reference will walk you through both professional-grade techniques and everyday situations. From novice to expert trader, you will learn how to use currency correlations to manage forex risk. We will examine calculation procedures, real-world hedging strategies, and the broader issues involving cross-asset correlations through the lens of constructing robust trading portfolios.
What is Currency Pair Correlation?
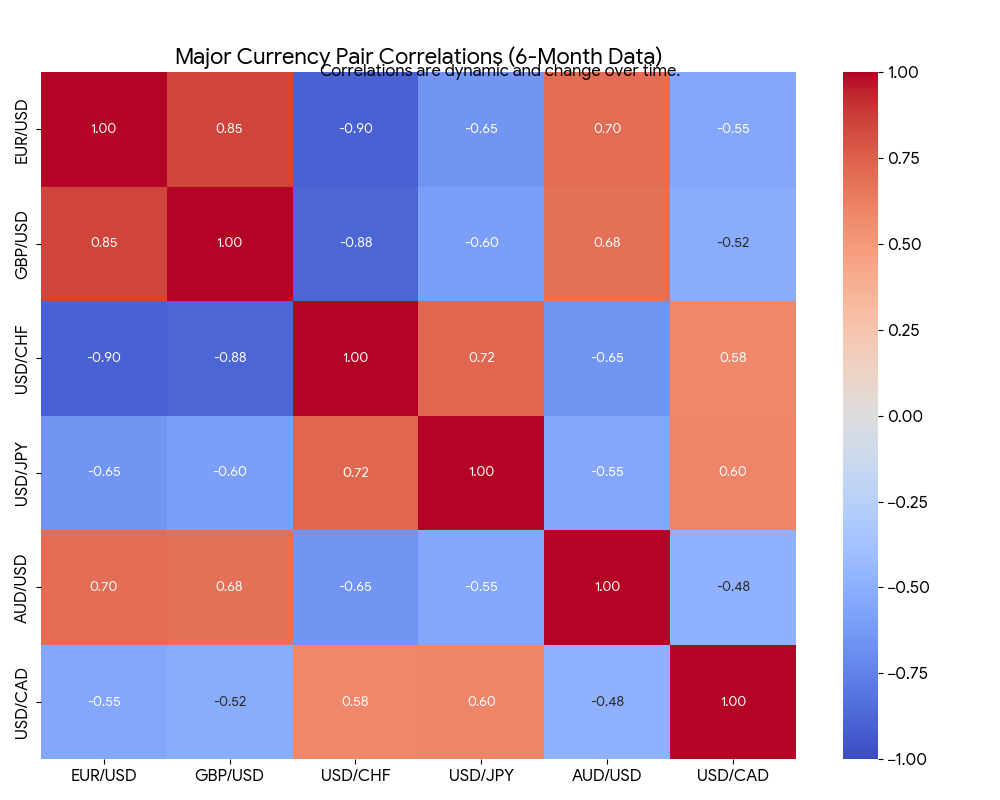
Currency pair correlation is the statistical relationship between the price movement of two individual currency pairs. Simply stated, it is a measure of how closely or loosely two currency pairs move as compared to each other during a time period. This relationship is expressed with a correlation coefficient that ranges from +1 to -1, and affords traders a numerical measure of how correlated two assets are.
The two main forms of correlation are positive and negative correlation. Positive correlation occurs when two currency pairs tend to move together in the same direction. For example, EUR/USD and GBP/USD exhibit a strong positive correlation because both the Euro and British Pound are affected by similar economic factors and both pairs will have the US Dollar as their quote currency. This means that when the USD weakens both EUR/USD and GBP/USD will probably rise together.
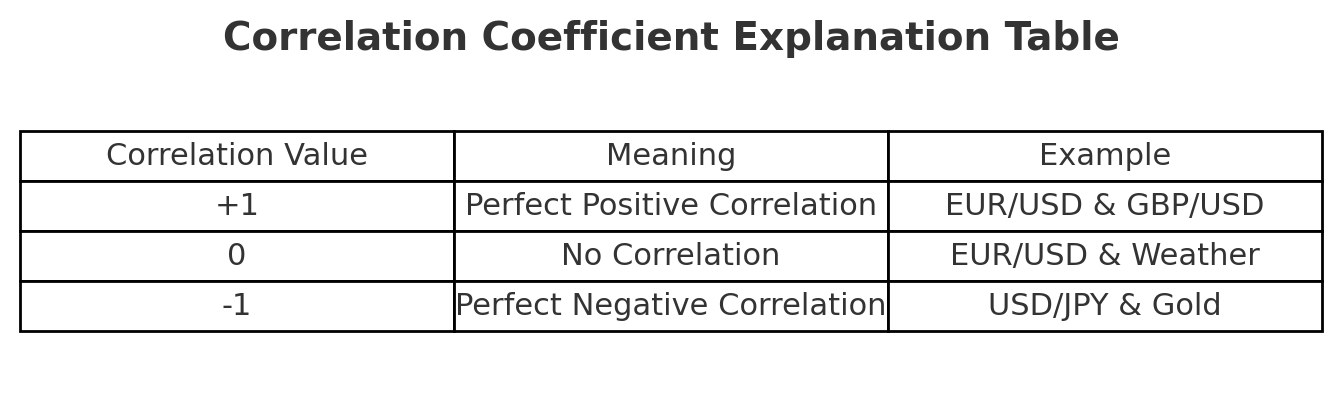
Negative correlation occurs when two currency pairs do the opposite of each other. A common example would be the inverse movements of USD/JPY and gold prices, or USD/CHF with EUR/USD. When the US Dollar moves higher with the Swiss Franc it typically weakens with the Euro which creates a negative correlation pattern.
To better understand this topic, think of practical examples. Positive correlation is like two best friends who always go out together, when one goes to go shopping the other goes with him. Their activities are positively correlated. Negative correlation is like two friends who one prefers to hang out during the day the other at night, when one is active the other is resting.
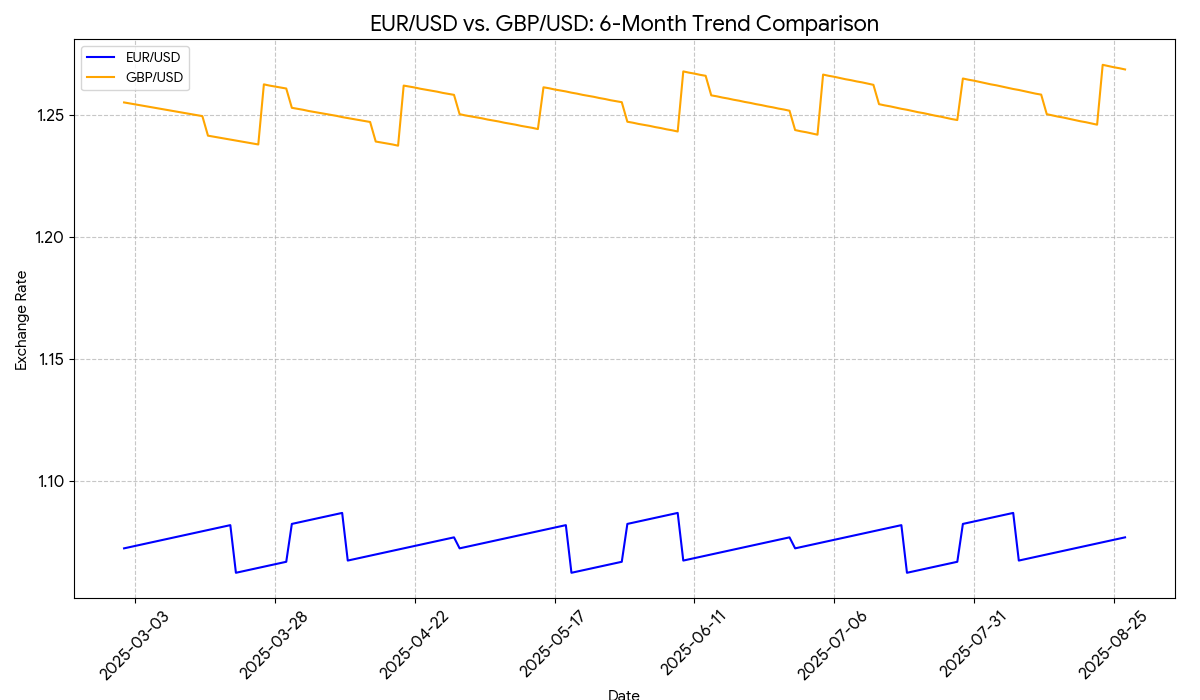
Correlations are a product of many things in the forex markets. Many currency pairs have the same base or quote currency - the US dollar, and therefore have an inherent mathematical relationship. Furthermore, countries have economic ties, there are shared events that affect each of those countries, and the monetary policies of two countries may lead to currency correlation. For example, we often see that during times of US dollar strength, both EUR/USD and GBP/USD can be seen drop in tandem, due to the USD being the quote currency in both pairs.
The correlation coefficient simply provides a precise measurement of these relationships. A correlation coefficient of +0.8 would describe a strong positive correlation, which would mean that the currency pairs move in the same direction approximately 80% of the time. A correlation coefficient of -0.8 would describe a strong negative correlation that illustrates the relation between currency pairs moving in opposite directions 80% of the time. A correlation coefficient near zero would indicate a weak or no correlation.
It is important to note that correlations are not fixed, and they can change based on market situations, economic and governmental policies, and possibly global situations. That is, what shows strong positive correlation in a stable market situation may in fact show weak or even negative correlation in crisis situations.
Why Correlation is Important in Risk Management
By understanding correlation, risk management can be effective because it can expose hidden risk in what appears to be a diversified portfolio. Traders frequently make the error of believing that they are diversifying risk when in fact they are becoming more exposed to the same underlying factors.
For example, consider a trader who buys long in both EUR/USD and GBP/USD. This trader assumes they are diversifying risk. However, the correlation coefficient between these pairs is often +0.7 or above, meaning they trade in the same direction 70% of the time. The trader has in fact doubled their exposure to US Dollar weakness and European economy strength. If out of a sudden change in Federal Reserve policy, the Dollar gets stronger, these two positions will move against the trader at the same time, causing a double loss.
The fix is strategically trading both positively and negatively correlated pairs. Think of it like buying both mathematics and literature prep books when you don't know what the exam subject is you're hedging on being wrong on which subject has been emphasized. In forex terms, holding on to a long position in EUR/USD in addition to taking a short position in USD/CHF (which typically has negative correlation with EUR/USD) creates a hedge against pure US Dollar directional.
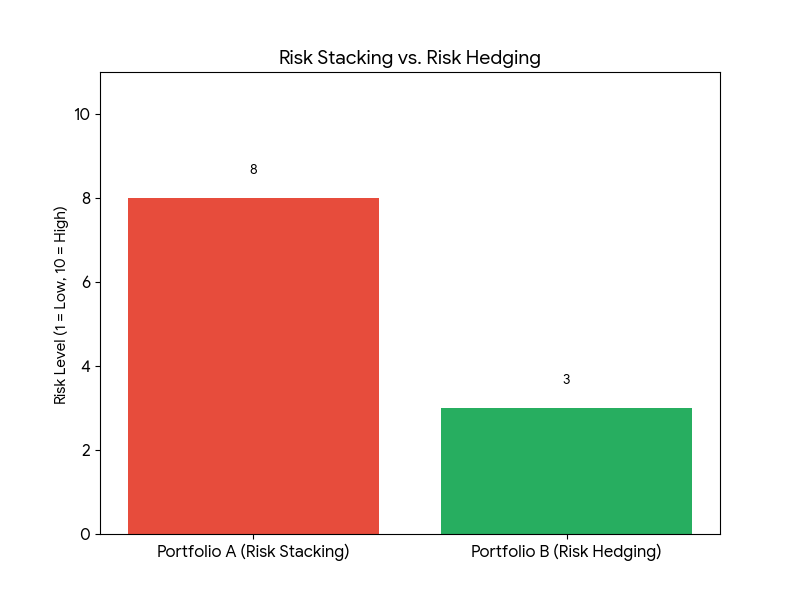
This hedging logic works because when the US Dollar strengthens, EUR/USD generally decreases (creating a loss on the long side) while USD/CHF generally increases (creating a small profit on the short side). Any losses in one position are offset somewhat by gains in the other. This provides an overall reduction in portfolio volatility and is one option for capital protection during adverse market behavior.
There are numerous examples of sophisticated fund managers using these same strategies in periods of uncertainty. During the extreme market volatility of the pandemic in 2020, many informed investors hedged their currency exposures by exploiting the strong negative correlation between gold and the US Dollar Index. As uncertainty in the marketplace drove people away from risk assets into safe havens, the price of gold skyrocketed while the Dollar Index fell off, providing portfolio protection for informed investors that understood that correlation.
The primary understanding is that correlation analysis takes trading from largely an exercise in chance to risk management in a systematic way. Rather than hoping that multiple positions will all work favorably, traders will understand by knowing correlation, even if the first few positions move against them, there is a high correlation that some of their other positions will generate offsetting gains.
Macroeconomic Drivers of Correlation
Currency pair correlations do not exist in a bubble. Rather, they exist as a part of a number of fundamental economic relationships, and out of shared exposure to the same macroeconomic factors. By understanding the underlying drivers of correlation, traders will be better informed regarding when correlations will likely strengthen, weaken or even reverse.
Economic Integration and Trade Relationships are the fundamental drivers of many currency correlations. The positive correlation between EUR/USD and GBP/USD is strong due to the clear economic entanglement between the Eurozone and the UK.
Even post-Brexit both currencies are still influenced similarly by trade relationships, comparable economic structures, and some similar exposures to the global economy. It should be noted that, as risk appetite increases among investors globally, they will likely take risk on both European currencies compared to the USD keeping the positive correlation intact.
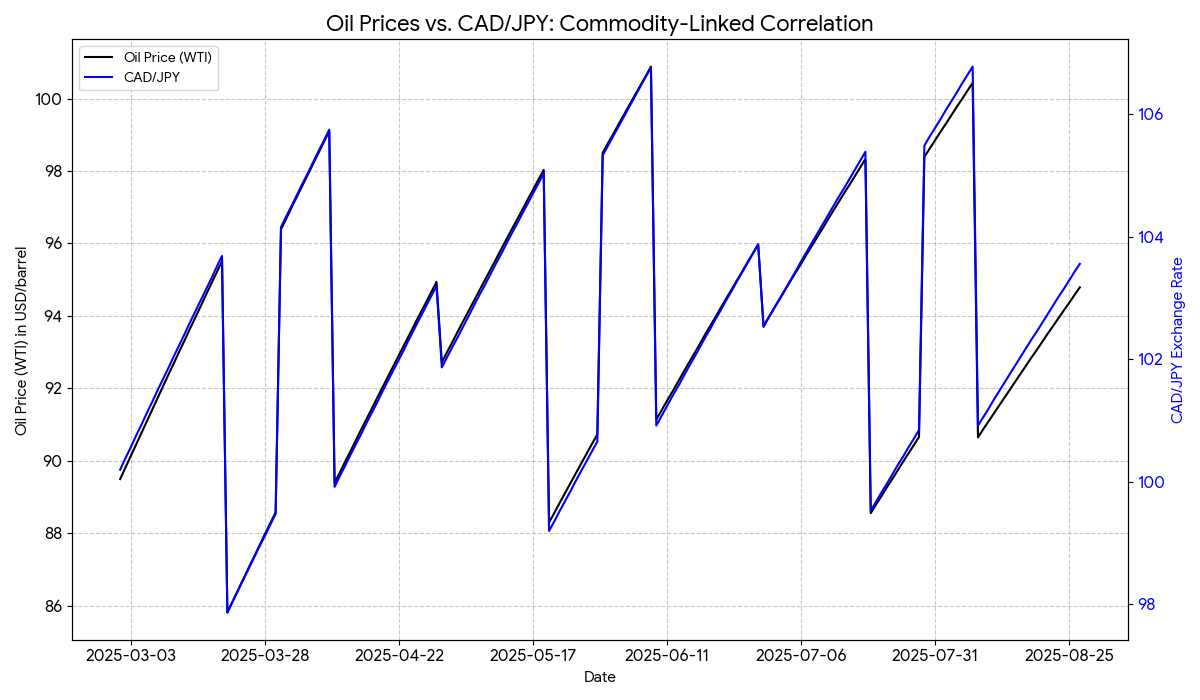
Commodity Currency Relationships are one of the most methodical and logical correlations within the forex markets. The Canadian Dollar´s relationship with oil prices captures the essence of this concept perfectly.
Canada is a major oil exporting country, when oil prices increase, the Canadian economy benefits, and consequently which strengthens the CAD. By way of this positive correlation between oil prices and CAD strength, an inverse (negative) correlation will be produced between oil prices and USD/CAD (since CAD strength will strengthen CAD, thus driving USD/CAD lower).
The Australian dollar shows strong relationships with iron ore and gold pricing. Australia is one of the prime commodity exporters, so strong commodity bull markets usually lead to Australian dollar being strong against the US dollar while weak commodity bears see the Australian dollar fairly weak.
Interest rate differentials and the policies of central banks can also inform correlation structures. When the Federal Reserve is raising rates relative to other central banks, or while other central banks are still dovish, currency pairs that are US Dollar based tend to act in the same manner. In effect, the raising rates from the 2015-2018 Fed tightening cycle, created a strong response for many USD pairs, as the thought of dollar strength reinforced that market theme.
The correlation structure between currency pairs which are in a similar environment for monetary policy has the outlook to become correlated as central bank policies synchronize. For instance, during the European debt crisis, the safe-haven flows of the Swiss Franc and Japanese Yen strengthened their correlations as both offered shelter away from Euro denominated assets, solidifying the strong role of the War.
Risk Sentiment and Safe-Haven Flows, create a temporary but strong correlation structure. In periods of market stress, currencies which are generally considered safe-haven" assets such as JPY, CHF, and USD will often shows strength together, despite their very different economic fundamentals. In risk-on periods, market participants will favour the higher yield commodity currencies (CAD, AUD, NZD), which will often move similarly.
A prime example occurred in 2014 when crude oil prices collapsed, dipping from over $100 to under $30 per barrel. The Canadian Dollar dropped sharply against almost all major currencies, resulting in a very strong negative correlation between oil prices and USD/CAD. Traders who recognized this relationship could hedge their exposure to oil price changes with currency positions and vice versa.
These macroeconomic drivers help explain why correlations have situational logic instead of being random statistics. Understanding these underlying factors will enable traders to visualize and understand in advance when correlations may strengthen during varying market conditions or fail if the fundamental relationships shift.
How to Perform Currency Pair Correlation Calculations and Assessments
Calculating currency pair correlations involves statistic evaluation, but today they are very easy to interpret for all traders thanks to modern trading platforms. The Pearson correlation coefficient, which quantifies the linear relationship between two variables over a considered period, is the most often used method.
Platform Tools and Resources offer the easiest method for the correlation analysis. Trading platforms like MetaTrader 4 and 5 have correlation indicators available that will show in real-time the correlation coefficients between any two currency pairs. TradingView will display a more detailed correlation matrix of relationships across multiple pairs at once that repeatedly updates for presenting the market condition at the time.
If you prefer manual calculations, both Excel and Google Sheets have a built-in formula for calculating correlations. You can simply download to .csv files the historical price data for two currency pairs, and then use the CORREL formula to calculate the correlation coefficient. This method gives you more control when specifying what time periods and data you want to include when calculating the correlation.
Timeframe Considerations are critical when discussing correlation analysis, specifically that correlations on shorter timeframes (daily or weekly) will naturally be very volatile and may not accurately represent a fundamental relationship. Think about when comparing the frequency of study hours and corresponding grades for a student. If you only collected the data on a daily basis, you may see weak correlations due to random fluctuations in studying or grades, however if you tracked the student for a full semester you would be able to see the relationship more clearly.
As a professional trader, it is customary to look at multiple timeframes. For instance, by evaluating the correlations for one-month, six-month, and one-year periods, one can extrapolate both the current dynamics affecting the market short-term and the longer-term, more stable and possible fundamental driven correlation patterns that emerge. It is important to remember that with different timeframes, both the strength and even the direction of the correlations can change.
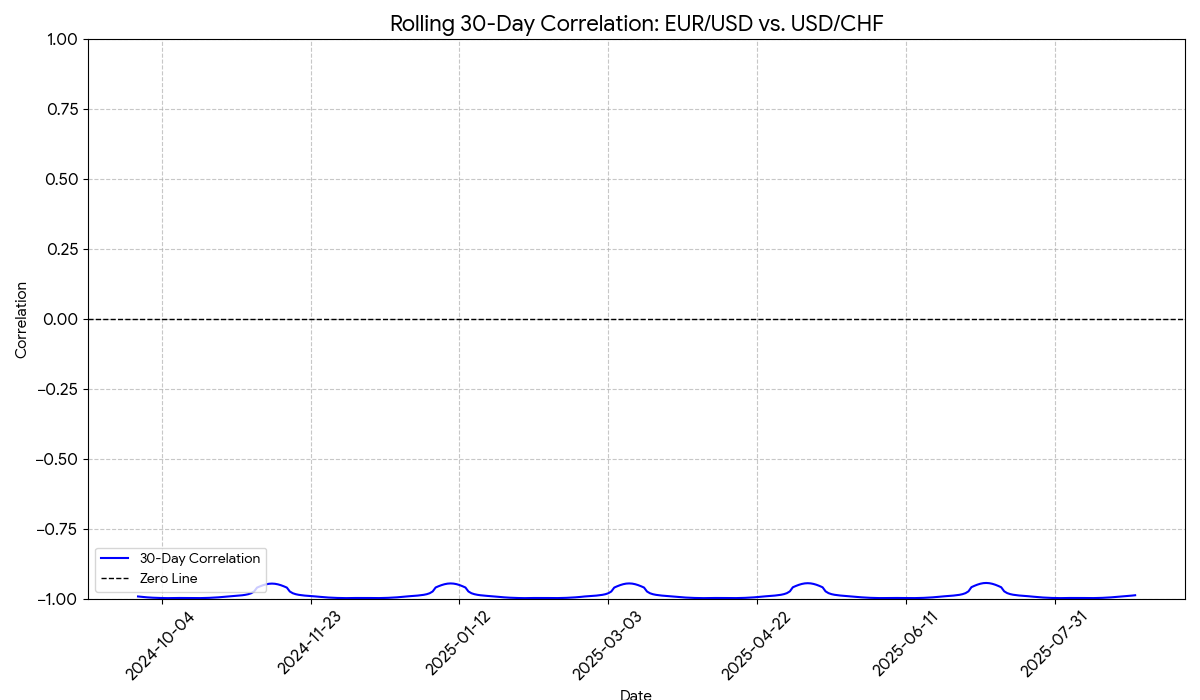
When using the prior example, consider EUR/USD and USD/CHF. Over a one-year period you may have a very strong negative correlation (correlation of -0.85), over a one month negative correlation (-0.65), but weaker correlations on daily timeframes (-0.25). This gives traders the information about the fundamental negative relationship, while also suggesting that any temporary divergences may be the result of the noise of the market.
As a practical calculation example, begin by identifying the correlation between EUR/USD and USD/CHF over six months. To do this, you would need to collect daily closing prices for the two pairs for about 130 trading days. From there, obtain the daily percentage change for each pair. You can then use the correlation formula to complete your analysis. Most traders will find this calculation more easily completed using the tools available on their platform, however, if you've gone through the calculations yourself, you have a better chance of relating your results back to the mathematics applied.
Rolling Correlations provide dynamic analysis using defined moving time periods. For example, if you monitor a 60-day rolling correlation, this correlation potential will be updated daily. As a result, you can see how the relationship between the pairs has evolved over time. This analysis can provide good insights that show when normally associated or correlated pairs begin to diverge. Diverging pairs are worthy of monitoring and may signal a change in market behaviour or an opportunity to consider the market in a different light.
Correlations among major currency pairs will vary, but there are clear areas of persistence. For example, EUR/USD and GBP/USD or EUR/USD and USD/CHF will generally maintain a positive correlation between +0.6 and +0.9, whereas EUR/USD and USD/CHF will maintain a negative correlation (-0.7 to -0.9) during the majority of time. However, correlations can disintegrate very quickly during major events or shifts in market behaviour, making ongoing monitoring critical.
Professional correlation monitoring means putting all analysis into a contextual space, which examines multiple relationships at one time. For example, the idea related to both the correlative and degenerate pattern might identify new hedging opportunities or signal the need to readjust primarily based on existing hedges.
Utilizing Correlation for Hedging
Implementing hedging effectively with currency pair correlations involves understanding two different types of hedging: positive correlation hedging (avoid concentrated positions) and negative correlation hedging (reducing risk), or (given oppositional positions).
Positive Correlation Hedging centers around preventing overexposure to similar market movements. If two currency pairs introduce strong positive correlation, it is not a matter of diversification, but rather accentuated risk exposure by holding large positions in both. The alternative solution is to reduce position sizes proportionally or select pairs with relatively weaker correlations in order to facilitate true and proper diversification.
Let us consider a trader that is bullish on European currencies. The trader is hoping to get exposure to both EUR/USD and GBP/USD. There is typically a +0.8 coefficient that exists between the two currency pairs. The trader may consider to reduce the position size of EUR/USD by 40% and the position size of GBP/USD by another 40% as opposed to simply risking only one pair value. In this case it could be seen that the trader would maintain their factor exposure to European currencies while removing the double-risk when both of these pairs adversely influence the overall cashflow.
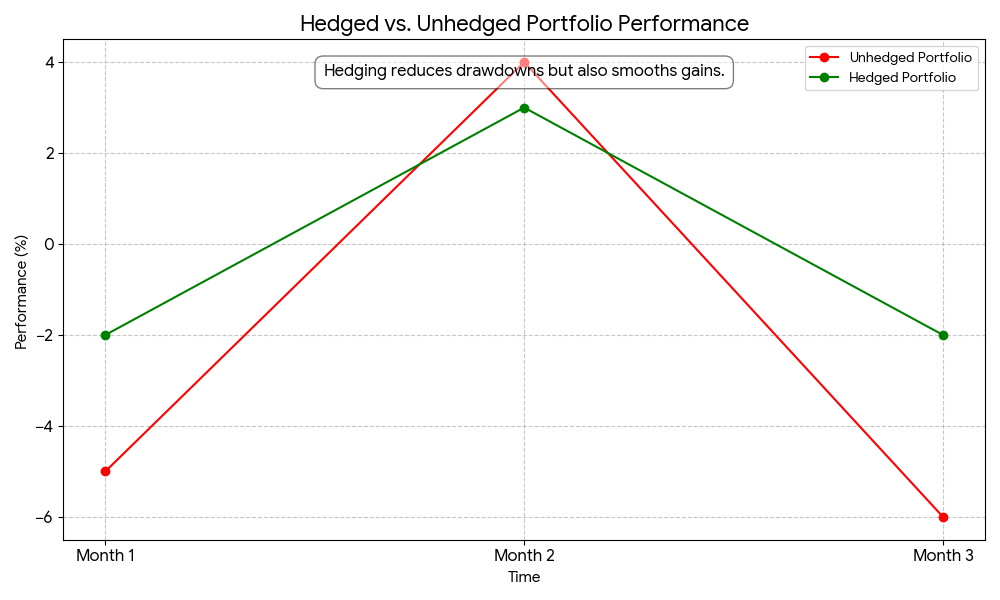
Negative Correlation Hedging uses opposing positions in pairs of negatively correlated currency pairs to stabilize your portfolio. This is a little like buying insurance, you are accepting the cost (lost upside potential) for protection against an unfavorable move.
Professional Example: A trader believes the Euro will strengthen but wants protection against a strengthening US Dollar. They might:
- Buy EUR/USD (Primary position based on belief the Euro will strengthen)
- Sell USD/CHF (Hedge position, as USD/CHF moves negatively correlated to EUR/USD)
If the Euro strengthens as expected, then EUR/USD increases and USD/CHF decreases creating profits on both positions. If instead the US Dollar unexpectedly strengthens, then EUR/USD decreases and USD/CHF increases. The hedge position will help minimize some of the losses taken on the primary position.
Practical Workflow for Correlation Hedging:
- Identify Correlations: Depending on the trading platform, use correlation tools to find strongly correlated currency pairs (coefficients of +0.7 or above, and -0.7 or below)
- Determine the Direction: Determine which direction you expect the primary currency to move
- Calculate Position Sizes: For negative correlation hedges, commonly used ratios are 50-80% of primary position size
- Monitor and Adjust: As correlations will change, you will need to re-adjust your hedge when necessary.
The same can be true in the forex market. If you hold a bullish position on commodity currencies but are not certain whether oil or gold is going to be the driver, instead of being sizeable in either CAD/JPY or AUD/JPY, you would go smaller on both positions realising one was oil related and the other was gold related.
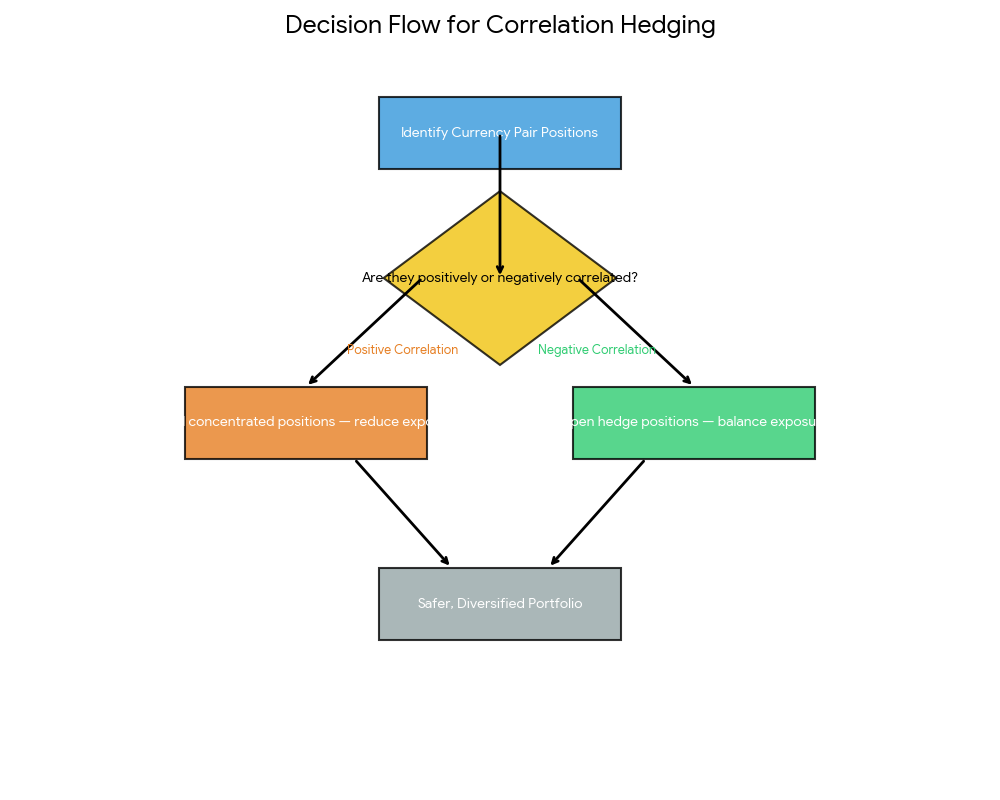
Risk Management Issues: Hedging effectively requires an understanding of both size and service. An hedged position will be significantly smaller or smaller profit to what you would have made if you didn't hedge because you still benefited from the position taking the favourable outcome but the hedged position has provided you with a critical backstop should the market become hostile. Remember this is about preserving capital not maximising profit.
Although you have only heard of these strategies at a retail level, from experience, fund managers regularly use them in times of uncertainty. Meaning fund managers are quite happy to take a reduced return for a more stable predictable return from the portfolio.
During the Brexit referendum in 2016, many professional traders hedged GBP positions with EUR positions because they recognised that political uncertainty would affect European currencies differently but to some extent it was still uncertainty.
Cross-Asset Correlations & Portfolio Construction
In sophisticated risk management, traders are not only considering the risk associated with Forex pairs but also the risk associated with correlations between individual currencies and then across different asset classes.
And so, understanding these cross-asset correlations, and how they interact, allows traders to build more meaningful and diversified portfolios that can withstand unknown and unpredictable market conditions, or, using good risk management techniques, to at least make better informed decisions around new market risks.
Gold and the US Dollar relationships provide one of the most consistent and tradeable cross-asset correlations. Gold generally will negatively correlate, and, at times, strongly negatively correlate, to the US Dollar Index and USD-based currency pairs, such as USD/JPY.
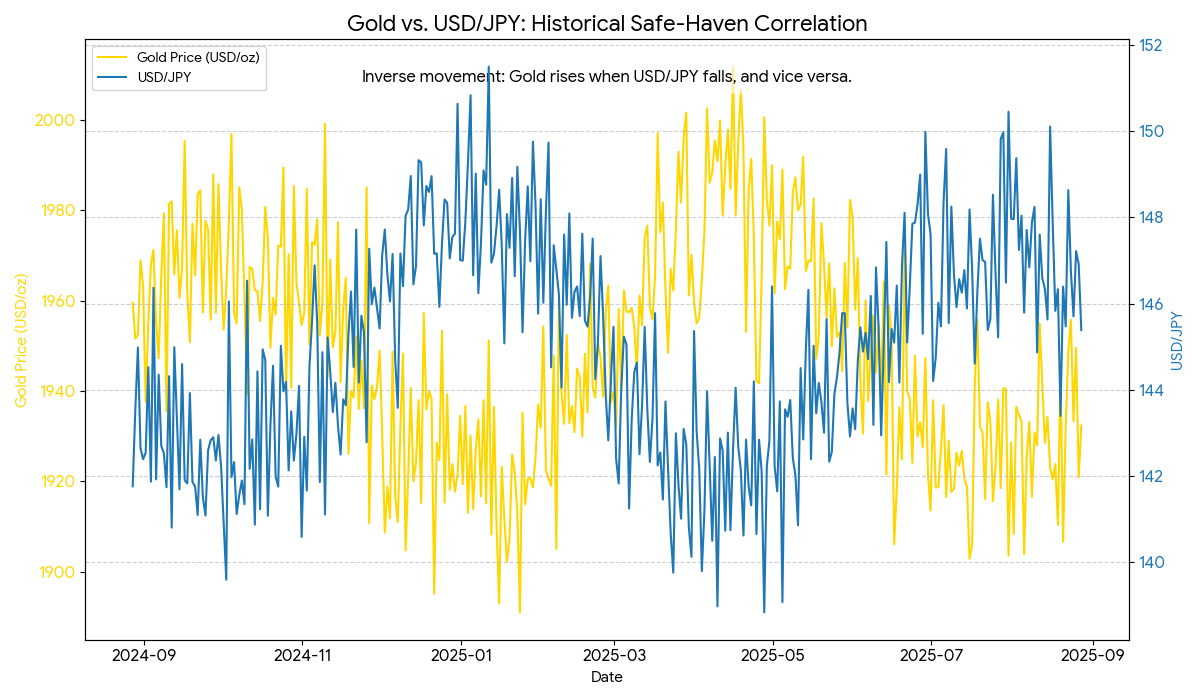
This correlation exists because gold is always priced in a US Dollar globally, therefore any strength in the US Dollar, all else being equal, will mechanically negatively impact gold prices. In addition, both assets have fundamentally different roles when the market faces some level of stress; gold's role is as a hedge against inflation, a quality of money, and a store of value, while the US Dollar can serve as a safe haven as a source of liquidity or as a result of a weakened stimulus.
At the onset of the pandemic in 2020, the negative correlation between USD, and gold became extreme as further monetary stimulation became unprecedented, leading gold prices to bitter record highs, and fluctuations in safe haven demand, liquidity, and risks developed to create a unique interaction between the price of gold and the strength of the US Dollar.
Traders aware of the negative correlation between the two asset classes could easily hedge exposure to the equity market and substitute that risk position by simply buying gold, and shorting USD/JPY, making a double safe-haven play.
Oil and Cad Patterns illustrate how commodity correlations create opportunities to trade through different asset classes. Canada's status as a significant oil exporter establishes a fundamental correlation between crude prices, and thus CAD, and CAD strength. When the price of oil is rising, the Canadian economy outlook increases which subsequently strengthens CAD against other currencies, especially the US dollar.
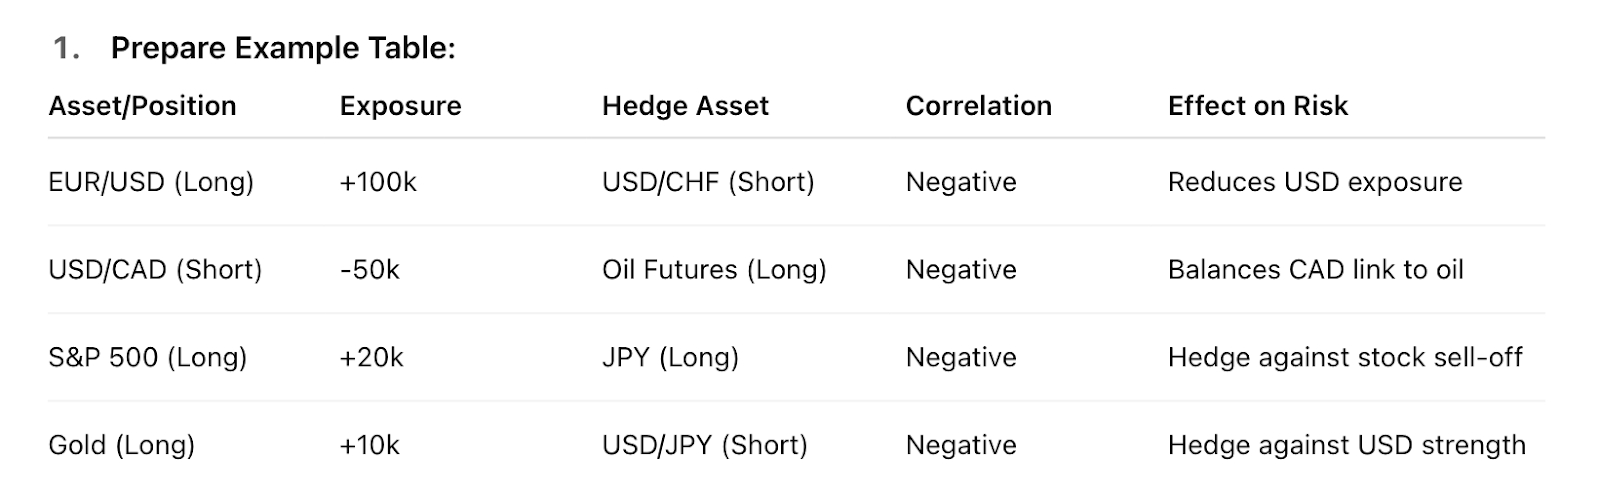
The correlation enables a sophisticated hedging strategy. A trader who is worried about the volatility of the price of oil could hedge by taking an opposite position on futures oil contracts ( long or short) while simultaneously hedging the USD CAD exchange with USD/CAD (long or short). Similarly, if someone is bullish on oil but wants a liquidity play in the forex market can then express that idea with a CAD strength positions and not a commodity position.
Equity Markets and Safe-Haven Currencies create unique correlation patterns when equities are in risk-off mode. When equities decline, investors typically run toward the equities markets and the general safe-haven currencies JPY, and sometimes CHF, with USD trailing behind. The relationships are similar to the S&P 500 and USD/JPY, where during periods of equity market stress, USD/JPY declines, and USD increases as the JPY strengthens amidst safe-haven demand.
Cross-Asset Hedging Strategies for different market conditions:
Equity Market Weakness: Go long JPY pairs (with positional short EUR/JPY, and GBP/JPY), to hedge equity portfolio losses. It is typical that the safe-haven status of the Japanese Yen can provide protection when risk assets are declining.
During Oil Price Volatility: Use CAD currency pairs to hedge against energy sector exposure. Typically when oil prices rise, CAD strengthens; when oil prices fall, CAD weakens. This creates a natural hedge relationship vis-a-vis the energy sector.
During Inflation Concerns: When gold is strong in price, USD tends to be weak; and emerging markets currencies tend to be strong. A portfolio that is hedged against potential inflation would have long positions in gold; short positions in USD; and targeted exposures to select emerging markets currencies.
Portfolio Construction Example: A portfolio that is constituted in a balanced multi-asset risk managed manner might look like the following:
- 40% traditional forex positions which are founded on fundamental analysis
- 30% hedged positions that are based on correlation (negative correlation pairs)
- 20% cross asset hedging positions (gold, oil, equity correlations)
- 10% uncorrelated assets for true diversification
The market environment in 2020 was a perfect example of the correlation effectiveness across assets. As equity markets in March 2020 fell off a cliff, gold was surging in price; USD rallied and then weakened in the subsequent months; while even safe-haven currencies -JPY and CHF- provided portfolio protection. Traders who understood and appreciated these relationships in advance were able to position and benefit or at least survive the volatility.
Monitoring Cross-Asset Relationships takes considerable time and attention, as it entails tracking many data sources and understanding which correlations are strong and which have a weaker relationship during different market regimes. Economic calendars for individual economies, central bank assessments, actions and communication, and geopolitical events all have a significant impact on how strongly these cross-asset relationships present themselves.
Risks & considerations
Although the correlations that exist between currency pairs are valuable tools for risk management, the use of such correlations has inherent limitations that help define their usefulness to traders.
The biggest risk that is inherent to correlation-based strategies is correlation instability. Correlations fluctuate over time, as a result of changes in economic conditions, policy shifts, and transitions in market structure. What was once a reliable hedge for months could suddenly stop being so if things change in the market. Imagine two best friends who have suddenly had a horrible fight and ceased spending time together. Their previously predictable relationship is suddenly gone.
Correlation failure is the SNB's unexpected removal of the EUR/CHF peg in 2015. For many years, the EUR/CHF had operated with an artificial correlation floor at 1.20, and the SNB was there to make sure any instances of CHF strength were suppressed. If you were a trader who was using this relationship for hedging purposes, you would have been blindsided when EUR/CHF abandoned the peg overnight and the CHF surged over 20% in a matter of minutes, ruining previously established correlations and strategies that relied on them.
Event-Driven Correlation Breakdown is the phenomenon when unexpected news or policy events are released that disrupt normal market relationships. For instance, central bankers occasionally surprise the market, geopolitical events can unfold, and many economic data releases can sometimes be a shock.
All of these situations could cause pairs that had previously exhibited normal correlations to develop correlated and even opposed movements to their previously observed relationships.
Brexit offers another example of correlation breakdown. Historically, there was a strong positive correlation between EUR/USD and GBP/USD, but with Brexit negotiations presenting times when GBP-specific news would cause the two to move independently or even in opposite directions when opportunities existed, based on their close European economic ties.
False Security and Over-Hedging are behavioral risks when traders put too much confidence in correlation based protection. Hedging soundly reduces risk, yet can also lead to limited profit potential on presumably favorable moves. Some traders over-hedge, effectively creating neutral prices without profit opportunities and still have to deal with transaction costs and spreads.
Complexities of Position Management, lead into correlation-based strategies. When managing multiple correlated positions you need to actively monitor and re-adjust, and be aware of how one position affect risk across the whole portfolio. New investors simply underestimate these fundamental management complexities.
Practical Risk Mitigation Strategies:
- Routine Correlation Monitoring: Update correlation calculations either weekly or monthly, noting significant changes which might indicate possible relationship breakdown
- Diverse Hedging Methods: Don't use just one correlation relationship in a hedging context, use several hedging mechanisms and methods across multiple timeframes and asset classes
- Position Sizing Discipline: Never risk more than you can afford to lose, even with hedged positions
- Exit Strategies; Have pre-determined reasons for when to exit and give up the correlations-based hedges, when the relationship breaks down
Historical Contextual Usage of Correlation Failures
Big market events are often associated with correlation failures and things that usually don't correlate can correlate as event-driven phenomenon pushes correlations to +1 (everything falls together) or correlations completely fail and markets become disconnected from even fundamental relationships.
Just because you have an understanding of these risks does not diminish the value of correlation based hedging, but puts emphasis on the fact that you should view it as one tool (among many) in your planning and overall risk management strategy.
Professional traders shift there look toward correlations as more of a probability of relationship, never guaranteed, and have a back up plan for when your relationship changes.
The main point is that correlation hedging can help traders trade more safely and more professionally when the markets are normal, but it cannot hedge against everything! Much like any insurance policy, correlation hedging offers value most of the time, however, it never fully insures you against anything extreme.
Conclusion: Currency correlations - The key to professional traders!
In the forex risk management toolbox, currency pair correlations represent one of the most powerful, yet least used (and understood) tools. Throughout this comprehensive guide, we have learned that deep understanding of currency relationships enables traders to identify a "structured" and professional approach to trading by bringing true risk management frameworks into the execution of trades that would otherwise be discretionary speculation.
Moving from understanding the basics of correlation -> acquiring the calculations for finding the correlation -> implementing the correlational risk/hedging strategies in the context of the market -> and continuing to monitor and adjust expectations for currency correlations to changing market conditions - is a clear learning path to take.
This process enables traders to avoid focusing on luck versus skill when approaching trading and managing trades.
Keep an eye on our blog for additional actionable trading strategies, risk management strategies, professional insights, and critical knowledge that can help you rob the complexity of forex and CFD trading of its intimidation factor and help you be a more successful trader. The journey towards developing professional trading competence is not just where you understand an individual technique, it is where you can apply all those techniques in an integrated and adaptive trading approach.
The bottom line is this - professional fund managers and institutional traders usually reference correlation analysis to trade more consistently and more professionally, not to necessarily make profits.
Check out tradewill.com for more info!
Disclaimer: The content of the blog does not represent any position of Trade W, does not serve as any trading-related decision advice, and does not endorse any third-party.