

 Trade W
Introduction
All traders aspire to find that one perfect entry point just before the market pivots. In this context, a Demand Zone will help you identify that level. A Demand Zone is an area of your chart where buying power appears to become active when the price goes down. It is often a key area where prices would gravitate towards and at these levels they reverse back up.
Think of it like when you go shopping at your favorite store during a clearance sale. When the price of things is low enough, there is little hesitation for shoppers to come and buy. The act of buying effectively puts a halt to the price moving lower and actually forces it back upwards. The financial markets are similar.
When professional traders discuss levels of demand, they often are describing an area of support. An example of this could be when EUR/USD is trading towards a key support/intervention level such as 1.0500. Institutional investors see value at this juncture and begin purchasing a significant amount of the currency pair. This identifiable buying action from professional investors creates a Demand Zone that can halt any downside movement.
Even at the most basic level of understanding Demand Zones will offer a significant advantage in the market. Instead of just wondering what was happening or where the market would turn, you will learn to identify where institutional money began buying, and thus identify a predictive area of reversal with higher probabilities to exponentially improve your trading strategy. Demand Zones are able to be accurately identified in the charts because of the ability for traders to see the footprint or recognizable buying activity left behind by the "big money".
It is more than just information based on theory or ideas. Learning Demand Zones is about being able to indicate where the highest possibility of pausing demand buying will occur and then being able to realistically take advantage of it for your own trading strategies.
Throughout this guide, you'll discover how to identify these zones, why they form, and most importantly, how to trade them effectively in forex, stocks, and CFD markets.
What Exactly Is a Demand Zone?
downtrend where buying demand has increased significantly. This is not just a line you see on your price chart, but represents the actions of real market participants putting their money where they feel value exists.
The underlying logic is simple. When price eventually reaches a level market participants think is undervalued, buyers enter the market with conviction. Just the existence of demand from buyers creates a price floor where price does not continue to decline and reverses.
Look at it in a professional manner. Gold (XAU/USD) has bounced around the $1,800 price point, regardless of what market cycle or time of year, the same behavior occurred. Each time the price was near the $1,800 area, buyers would enter the market and push the price higher. This was reproduced numerous times resulting in this zone being treated as a demand zone.
For beginners, think of a pair of shoes that cost $100 but got marked down to $70. When the price of the shoes was marked down to $70 people started buying them almost immediately. This was the heightened demand looking to purchase at an undervalued price point, and it prevented further declines in the price. This is the definition of how a demand zone would exist.
The true legitimacy of any Demand Zone comes from the actual buying power that has taken place. This can be demonstrated by looking for strong bullish candles, volume spikes, or price rejection where price works show buyers defended this level). It is based on evidence, not simply guesswork.
The Economic Logic Behind Demand Zones
Demand zones aren't magic; they're founded on basic economic principles that govern all markets. Understanding the "why" behind them will make you a better trader. The theory stems from simple supply and demand theory.
When demand is higher than the supply of an asset at a price point, the price will naturally rise. When sellers run out of sellers and buyers see opportunity, the balance shifts. A Demand Zone is created when the market is temporarily undervaluing an asset. Smart traders and institutions recognize the mispricing, and then enter and cause a zone and create the fuel to short the price. For a macro example, in a Federal Reserve rate cut cycle, demand for USD typically decreases when rates decline - as the currency is unattractive at lower rates.
At the same time, a EUR Demand Zone might form as demand increases because the investors see relative value, buying opportunity and swap paraphrase of the trade would occur. The shift in dynamics has the market reverting. For a more everyday example, if my local grocery store puts milk on sale because it's about to expire, I'll likely go buy more milk than normal.
The increased demand keeps the price stable, and may ultimately even lead to a shortage. Markets are similarly reacting to asset prices that appear at a sale price.
The psychology behind Demand Zones reflects collective market perception. When enough participants agree that price has fallen too far, their combined buying creates the zone. This isn't random. It's the market's way of finding equilibrium and fair value.
Demand Zone vs Supply Zone
To understand the market structure, you need to look at the structure from both sides of the equation, where Demand Zones and Supply Zones are the opposite of each other and serve different purposes in price action. The Supply Zone is the area where selling pressure is building up during the period of rising prices.
The Supply Zone is an area where the sellers overtake the buyers leading to a bullish candle which could turn into a bearish candle down the road. Demand Zones are an attempt to catch a falling knife, while Supply Zones are an attempt to stop a rising knife.
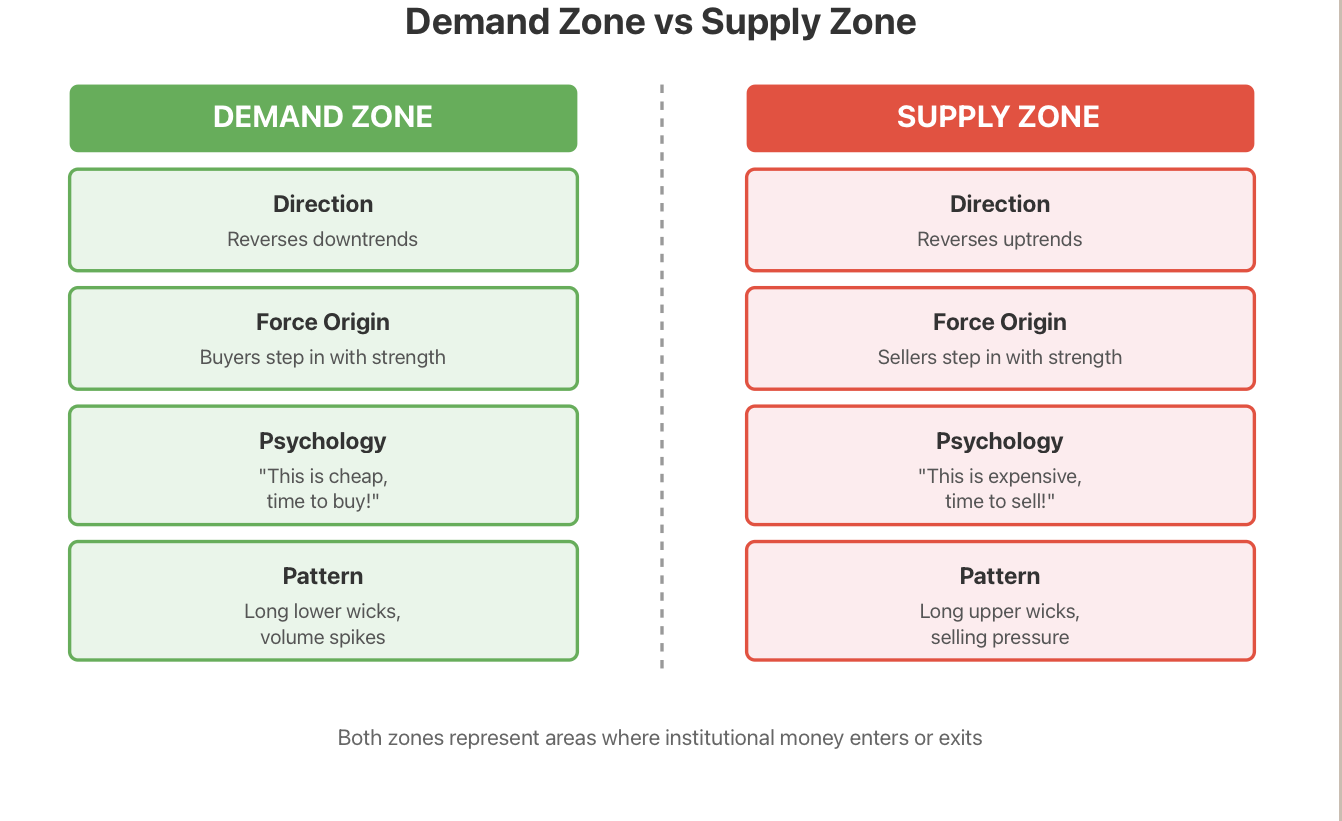
Here is the comparison:
Direction: Demand Zones reverse areas of downtrends, while Supply Zones are areas of reversal in uptrends.
Force Origin: Demand Zones show buyers stepping in with strength just as that supply had to enter the market. Supply Zones show sellers stepping in with strength and took over the Impulse when supply appeared weak.
Market Psychology: Traders at Demand Zones think, "This is cheap, time to buy!" and at Supply Zones think, "This is expensive, time to sell!"
Patterns Compare: Demand Zones have long lower wicks with spikes in volume where buyers pushed back against the sellers. Supply Zones have long upper wicks where sellers rejected prices that the buyers were willing to move higher.
Consider EUR/USD as a sample. The pair will potentially show a Demand Zone at 1.0500 where buyers continue to defend, while at a higher price level of 1.0800 there will be a Supply Zone where sellers continue to push price back down. The price will oscillate in price between these areas of value.
Identifying both zones gives you the full perspective of market structure. You will see where both buyers and sellers are battling for control of price action and you'll be able to time your entries and exits in a more precise manner.
How to Identify Demand Zones
Identifying authentic Demand Zones requires combining multiple indicators. Simply trusting your gut will create false entries and lead to losses. Here is how the professionals do it.
Start with price action. Look for signs of small reversal zones near or at the back of large bearish (downward) candles. This is indicative of selling pressure exhausted and buyers are coming into the market. You will notice clusters of long lower wicks where buyers repeatedly defend the level.
Now that you are tracking price action, you will need some confirmation from other technical signals. Use RSI (Relative Strength Index) to see if the price is oversold below 30, which is typically an indicator of Demand Zones. Volume spikes at potential demand zones are another confirmation. This is a sign of institutional interest with real buyers coming into the market.
Candlestick patterns also provide additional confirmation. Look for Pin Bars which show rejection of lower prices, Bullish Engulfing where buyers are overwhelming sellers, or Hammer candles to indicate possible Demand Zone.
For example, after the key economic data was released, GBP/USD drastically moved lower with volume increasing as the price dropped. As price reached a key level, I observed multiple long lower wicks forming. The RSI measured into the 30 range as oversold. Plus there was a Bullish Engulfing / Bullish Pin pattern. All of the signals combined gave high potential for a Demand Zone.
You shouldn't rush the identification process. Always wait for many confirmations before marking a zone on your chart. The strongest Demand Zones show evidence across price action, volume and technical indicators.
Remember that not every bounce constitutes a Demand Zone. You must see real buying interest with follow through, rather than a fleeting stoppage of the decline.
Smart Money and Institutional Demand Zones
The underlying factor behind strong Demand Zones is the involvement of institutions. When large banks, hedge funds, and professional traders accumulate positions over time, this forms the Demand Zone you see on your charts.
Now you understand that institutional participation matters. They cannot buy everything they want in one trade without shifting the market against themselves. Instead, they have to accumulate, or build, positions over time within a defined price range. This creates the Demand Zone on your charts.
The institution's trading cycle is one of Accumulation, Markup, Distribution, and Pullback. The Demand Zones typically form during the Accumulation period. This is when the smart money is accumulating positions and retail traders are panicking and selling.
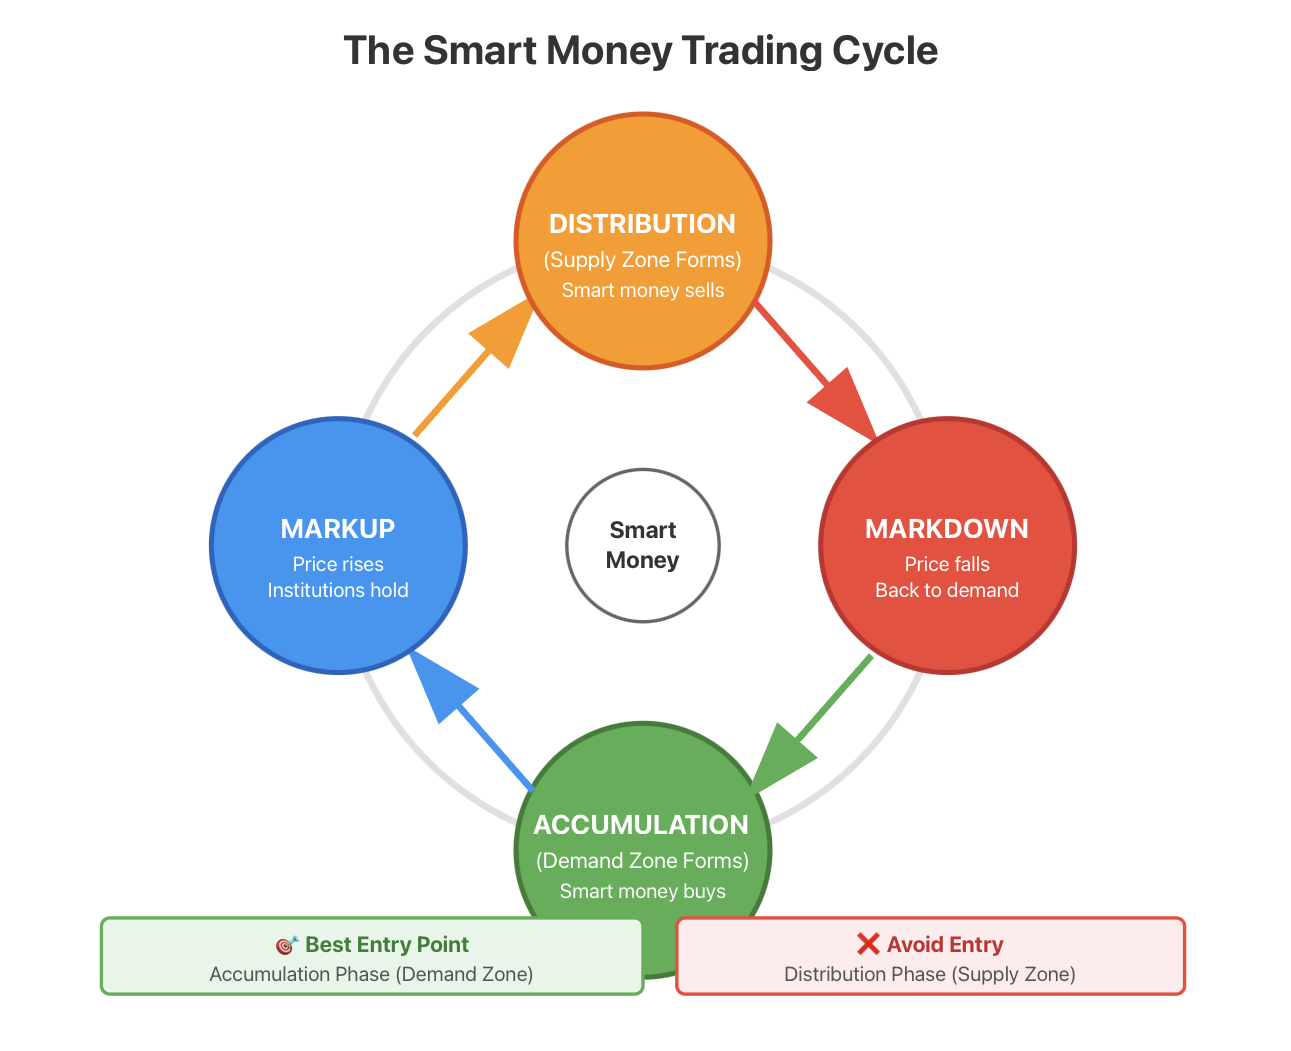
During the Markup, institutions will keep their positions while the price goes up. During Distribution, institutions will begin to offload their positions to late buyers who are chasing the move. Towards the end of the cycle, Pullback prices will often come back into the initial Demand Zone where institutions may add to their positions.
Gold is a perfect example of this. When gold crashes from its highs it is common to see institutional traders accumulating gold in the $1.800 zone. They are placing multiple buy orders in this zone creating a strong support level. Once gold returns to the level, it is common to see the price bounce off of this level as the institutions defend their positions.
When you have this cycle understood, it significantly alters your perception of Demand Zones. Rather than evaluating lines on a chart, you're evaluating where big money is coming from, and therefore trading in the same direction as them.
The strongest Demand Zones will also typically align with institutional order blocks, which are areas in price action where large orders were filled, which creates a footprint through price action tendencies and volume signatures.
Trading Strategies with Demand Zones
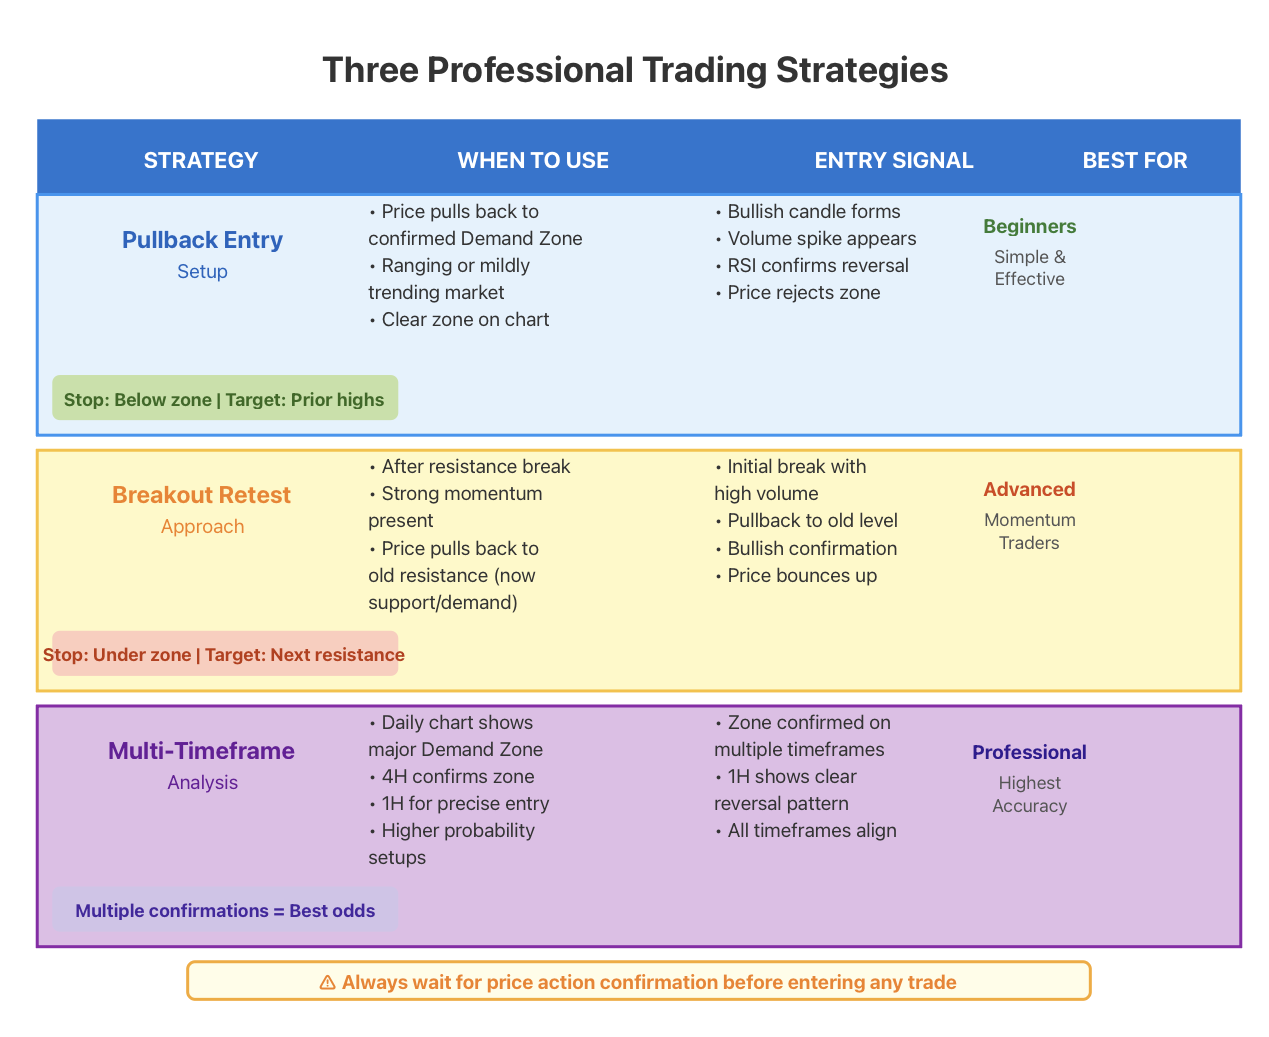
Determining Demand Zones is only the first step. You also need validated trading setups to trade those zones for a profit. Here are three ways that professional traders utilize on a daily basis.
Pullback Entry Setup
This is the simplest way to enter. You wait for price to pull back down to a Demand Zone, which has already been confirmed on the time frame you are trading. You don't just enter the Demand Zone blindly. Look for confirmation of reversal of price through bullish candles, volume spikes, or indicator signals. Once you see price rejecting in the Development Zone and beginning to move higher, then enter your long position.
Place your stop loss slightly below the Demand Zone itself. This helps protect you if the Demand Zone fails and thus price breaks through. Aim for prior highs, or the next Supply Zone, in order to take your profits. This works best in a ranging, or mildly trending market.
Breakout Retest Approach
This advanced strategy takes advantage of momentum once price breaks above the resistance. After price makes a new high, it will usually pullback to retest the old resistance, which is now a Demand Zone. This pullback is a lower risk entry point.
First, wait for the price to break a significant high with high volume. Once the price has moved back to the old resistance level (now as support), look for bullish confirmation. As the price rebounds off this demand zone, enter the trade. Your stop loss would go under the zone with a target to the next resistance level and further.
Multi Timeframe Analysis
Advanced traders will also confirm the Demand Zone in multiple time frames for probability setups. It's a good rule of thumb to start looking for your Demand Zones on the daily chart. Then look for additional confirmation using the 4 hour chart. Finally, once the demand zone is confirmed on the 4 hour, switch to the 1 hour to time your entry.
For example, if EUR/USD shows a strong Demand Zone on the 4 hour chart at 1.0500, you could then switch to the 1 hour time frame and wait for price to enter the demand zone. Once price approaches the 1.0500 area and has a clearly defined reversal pattern on the 1 hour chart, you can enter your order with confidence knowing your trade idea is supported across multiple time frames as outlined above.
Keep in mind a Demand Zone isn't a buy signal on its own. It is a potential buying zone, and it should conform to your overall strategy; risk management; and technical confirmations. Always wait for price action to show its hand before investing capital.
Common Mistakes When Trading Demand Zones
Even seasoned traders can encounter pitfalls while working with Demand Zones. Avoiding the following mistakes can help to mitigate substantial losses and frustration.
Mistake 1: Considering Every Bounce a Demand Zone
A bounce does not signify the presence of a Demand Zone. It is important to observe multiple confirmations, including volume, price action patterns, and ideally multiple touches to the zone. One fortunate bounce could simply be the result of random market noise, and not institutional buying.
Mistake 2: Buying Blindly in Strong Downtrends
Demand Zones in extreme downtrends are similar to just standing there in front of a moving freight train. A Demand Zone may slow the downtrend for a short time but the intense selling pressure will overwhelmingly remain intact. Always be cognizant of the larger trend. Counter trend trades require greater caution and tighter risk management.
Mistake 3: Ignoring Volume and Direction of Trend
Volume is significant in telling you if there is real money supporting the Demand Zone to buy. If there is no volume supporting the Demand Zone, it is weak and much more likely to break. Likewise, going against the overall direction of the trade outcome greatly reduces the probability of success.
Before considering any trade based on Demand Zones, make certain to mentally run through the following checklist:
✅ Is the Demand Zone in line with the larger trend or at least has potential for reversal?
✅ Is there volume backing the buy?
✅ Do price patterns back up the zone (wicks, engulfing candles, etc.)?
✅ Have you seen multiple touches or strong institutional footprints?
Here's an example. BTC/USD appears to be creating a Demand Zone, but volume is dropping, and the larger trend is still very bearish. A trader sees this and ignores these early warnings and decides to buy the zone. The price stalls for a short time, then crashes right through, and stops him out of the trade.
A Demand Zone is not a reinvention of invincible support. It is a fluid area that requires ongoing verification. Market circumstances change, institutions adjust their positioning, and what worked yesterday may work tomorrow. Be adaptable, and always reinterpret your zones as new information comes in.
Real World Examples of Demand Zones
The theory becomes powerful when you see it in real markets. Let's look at 3 historical examples of Demand Zone efficacy.
Case 1: S&P 500 Covid 19 Pandemic Crash in 2020
When Covid 19 caused panics around the world in March of 2020, the market crashed from numbers above 3300 down to levels around 2200. When the market began to approach 2200, we could see huge institutional responses with ballistics buying. The price touched multiple long lower wicks up to the area of the Demand Zone, we could also see big spikes in volume as the index formed a clear Demand Zone.
This area held firm long enough and prompted one of the strongest bull markets the market has ever seen. Traders who understood this institutional accumulation zone and entered a long position on the retest made amazing returns on their investment as the market began to recover.
Case 2: EUR/USD After an ECB meeting
After a dovish announcement from the ECB, the EUR/USD declined sharply from 1.0850 to 1.0500, all in a matter of days. Upon testing the 1.0500 level, the EUR/USD pair developed a strong Demand Zone represented by long lower wicks that clustered together with a volume increase. RSI readings were even showing extreme oversold levels.
Price settled in the Demand Zone briefly, then proceeded to turn sharply higher. Over two weeks the market recovered to 1.0750 offering traders a fantastic 250 pip move from the Demand Zone entry.
Case 3: Gold's Repeating Demand Zone at $1,800
Over multiple years, gold has recognized a larger Demand Zone in and around the $1,800 level three times. Regardless of market conditions, corrections or crises, price continues to develop to the $1,800 zone and bounce. Each touch justified the demand zone's identification as institutional buyers defended the area, creating a high probability trade for traders that recognized the reoccurring signals. Even when gold was finally able to trade slightly below the pattern, price quickly recovered, reflecting the strength of the accumulation positions in that area.
These actual examples illustrate that Demand Zones aren't just theory, but valid market behaviors resulting from institutional action and player psychology. Look at previous charts in the markets you trade and I bet you could find countless examples that could have turned into profitable trades.
In conclusion, Demand Zones change the dynamics of decision making. You will improve your timing on reversals, your entry points for improved risk reward ratios and you will also reduce losing trades by avoiding poor setups.
Demand Zones represent the areas where light institutional money enters a market. By correctly identifying and trading these areas you become smart money rather than fighting against it. You will not be guessing where price will reverse, you will be reading the work of the big players left behind.
Get started with applying these concepts today using Tradewill's sophisticated charting and real time data. Start with learning to identify Demand Zones on historical charts, before moving to live analysis as your confidence increases.
Ready to test your Demand Zone strategy? Open a demo account on Tradewill now and start spotting institutional buying opportunities with zero risk. Master the zones, master the markets.
Disclaimer: The content of the blog does not represent any position of Trade W, does not serve as any trading-related decision advice, and does not endorse any third-party.