

 Trade W

Introduction: What Is Divergence and Why It Matters in Forex Trading.
Divergence occurs when the price of a currency pair moves in one direction, while technical indicators such as RSI or MACD are in the opposite direction. This mismatch is a clue that the current trend is likely losing momentum or might be reversing. It's similar to a car's speedometer showing high speed while the engine sounds like it's under stress. When that occurs, something seems amiss, and that's your indicator to focus on the divergence.
Let's check an illustrative professional example. Let's assume that EUR/USD experiences a new high, moving higher than a previous high. You would expect that the RSI would also be at a new high as well, correct? Instead, the RSI is forming a lower high. This divergence is a clue that while the price is higher, the momentum is losing strength. A pullback or reversal may be on the horizon.
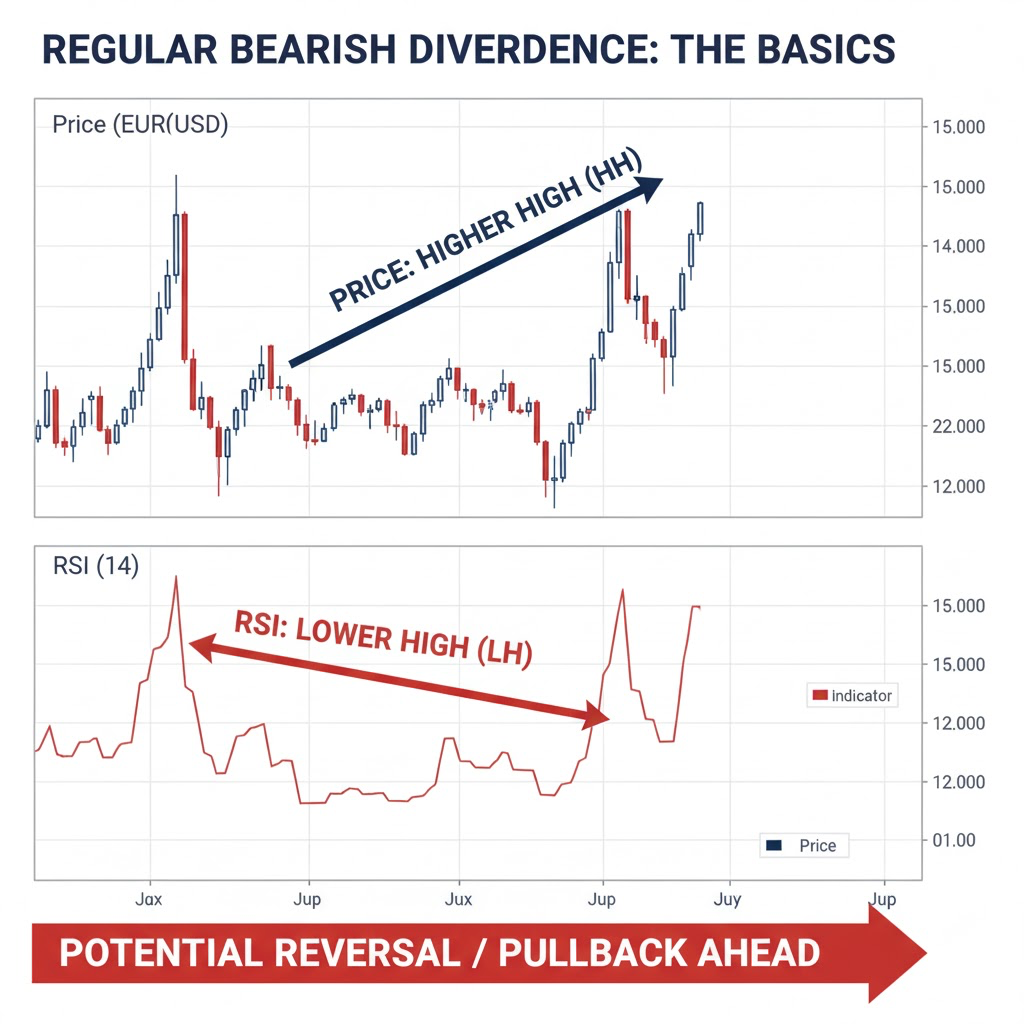
This is why divergence is so helpful, it is valid across all different markets. If you're trading forex pairs like GBP/USD, cryptocurrencies like Bitcoin, stock indices, or commodities like Gold - divergence can uncover potential turning points before they happen.
However, it is important to stress this point and make sure you understand it at the very beginning. Divergence is not a tip or a signal to buy or sell right away. It should be more like a light on your dashboard, indicating you need to do some more research and get some confirmation before you act or whatever. The smart traders combine divergence with price action, volume analysis, support, and resistance, etc.
The best thing about divergence is it allows you to think beyond the edge of the cup, while other traders are looking down and chasing prices higher or lower, you are now reading the underlying forces of the market that really change prices. This edge can often be the difference between catching a trend reversal early or getting stuck on the wrong side of the market.
Types of Divergence Explained: Regular, Hidden & Multi-Timeframe Signals
Recognizing the different types of divergence is akin to learning to read the different types of weather. Each type of divergence will tell you something different about what is likely to happen next in the market.
Regular Divergence
Regular divergence is your classical reversal sign. Regular divergence occurs when the price of an asset makes a new high but the indicator, for example, MACD, does not. Or vice-versa, the price declines to make a new low, but the indicator does not get the message as well.
Imagine running faster and faster but your heart rate is steady or even going down. Something is strange, or unusual and it tells you something is not right. In trading terms, this occurs in practical terms when the EUR/USD runs to a new high, but the MACD histogram has lower highs. What this is telling you is that momentum is running out to the upside, and a reversal is in the works or at least a significant pullback is coming.
This is true for regular divergence and as you could have guessed by now the reverse is essentially also switched. When the price drops to a new low but the RSI builds a higher low. That downward pressure is losing its grip and either buyers or bulls are getting ready to take control. As a practical example. Regular divergence is essentially a signal that the trend is tired or exhausted and is very vulnerable to reversal.
Hidden Divergence
Hidden divergence is both more challenging to understand but highly useful. It's the opposite instance which actually signifies continuation and not reversal. In this case, the price does not make a new extreme, however your indicator does.
Think about if your exam scores drop slightly, but you've actually put more time into studying that week's test. The studying effort has not manifested itself in the results yet, but the potential to earn a better score is building. In trading, if GBP/USD retraces back within the overall uptrend and has not made a new low, but your RSI makes a lower low, that is a hidden divergence that tells you the trend was strong and the trend is likely to continue. In other words, it is simply a pullback and a rest period prior to the trend continuing.
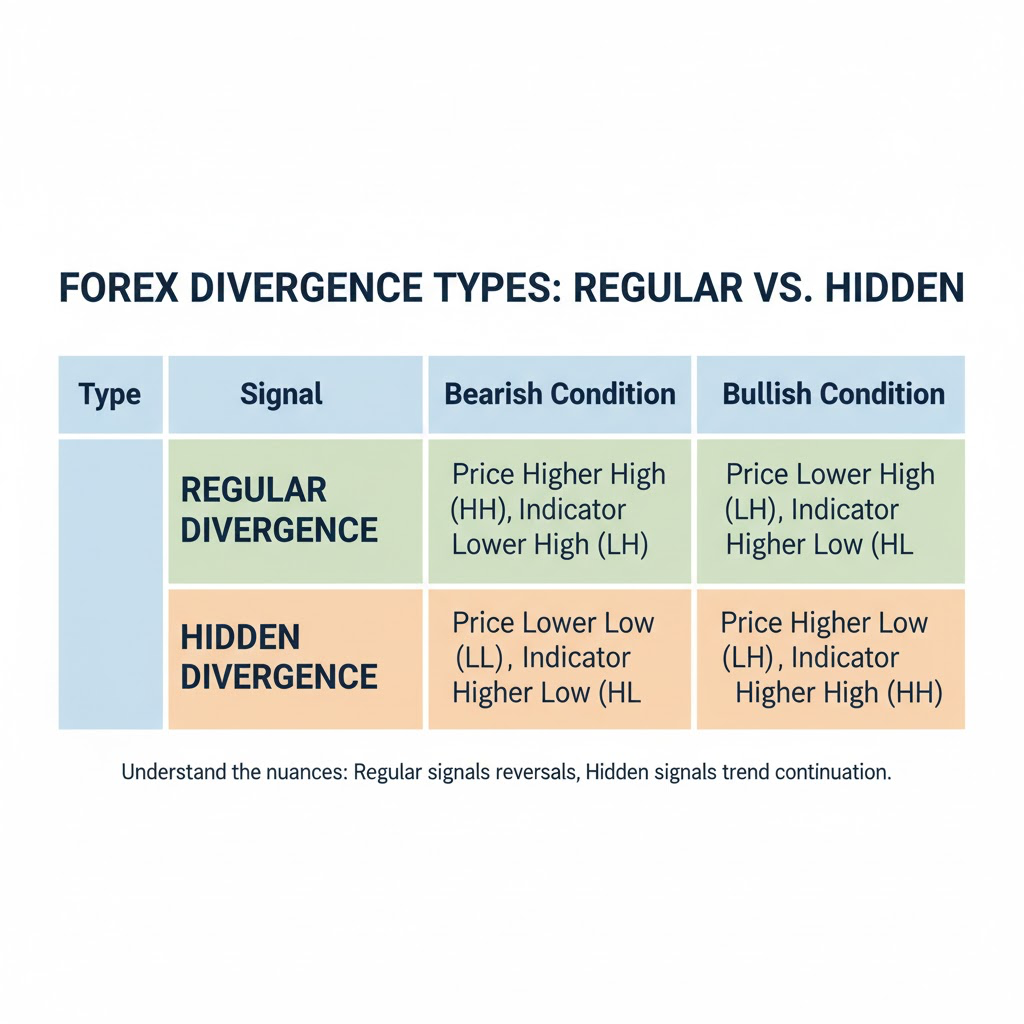
Hidden divergence is your best friend when you wish to add to that winning trade or enter a trend which has taken a temporary pause. The surface correction is merely that, and the primary directional force in the market has not changed.
Multi-Timeframe Divergence
Now, things get really exciting. When you see divergence on multiple timeframes at one time, you know your signal is much more reliable. If divergence is present in both the daily and 4-hour chart in EUR/USD, the signal is much stronger than if you just identified divergence in a single timeframe.
Like everything else in trading, think of it like having multiple witnesses to back up the story. In this example, the daily chart shows regular divergence and suggests a trend reversal, so when you drop down to to the hourly chart, divergence is shown again on that timeframe as well. That gives you confluence to act on the signal with much higher conviction.
Statistically, data shows that divergence setups on multi-time-frames have much greater win rates than single timeframe signals. The reason is this: you are capturing agreement with multiple timeframes which appeals to multiple trader perspectives, or time frames, which might include a day-trader and a position holder.
The key to using divergence types effectively is knowing what you are looking for. You are looking for reversal opportunities, always focusing on regular divergence. You are looking to ride trends longer, hidden divergence is your signal. And when you want the maximum confirmation before you risk serious capital, you rely on the extra confirmation of looking for multi-timeframe divergence.
Key Technical Indicators for Spotting Divergence
When it comes to spotting divergence, not all indicators are equal, so let's list some of the most trustworthy tools utilized by trading professionals every day.
RSI (Relative Strength Index)
Without a doubt, the most preferred indicator by traders for hunting down divergence (and for a good reason) is the RSI. It measures if a currency pair is overbought or oversold, giving you a very simple reference point to measure divergence.
Think of a thermometer telling you that your body is overheated, but in reality, you feel good, full of energy, and normal. This is a misrepresentation of reality. The same can be said in trading. When EUR/USD is trending higher but the RSI shows a lower high, this is divergence. The momentum is weakening, but the price continues higher.
RSI is very good because it is bounded between 0 and 100, making it easy to assess peaks and valleys. When price makes a higher high at around 1.1200 but the RSI peaks lower than the previous high, this is a perfect example of bearish divergence. Often, this is followed by real selling pressure, giving you the opportunity to take some profits on longs or establish shorts.
MACD (Moving Average Convergence Divergence)
The MACD, or moving average convergence divergence, works differently by taking the relationship between two moving averages. This indicator is beautiful at identifying changes in both momentum and trend strength.
It is like when you are wearing a step counter and your pace is slowing even though your speed may be consistent. The price is still showing an attitude moving higher, however the MACD histogram bars are gradually downsizing, lending the same story, that enthusiasm is fading for that move.
When BTC/USD is in a rally on the daily chart, however the MACD histogram peaks are progressively getting smaller, you are watching momentum die in real time. Price may even still push slightly higher, but that divergence more often than not lends evidence that a massive reversal is coming. The MACD is particularly useful for this measure, because it represents both trend and momentum in a single indicator.
Other Useful Indicators
Stochastic oscillator and CCI (Commodity Channel Index) also work well for divergence. Stochastic is great for shorter timeframes, while CCI excels at identifying extreme conditions where divergence signals carry extra weight.
The Power of Combination
Here's the insider tip: never rely on a sole indicator . The combination of RSI divergence and the MACD confirming that divergence at the same time multiplies the strength of your signal . If overlaid with an analysis of volume, you have a stronger case still.
For example, if you see RSI divergence on the 4-hour chart of the BTC/USD, and volume is lowering with rising price, then you have multiple confirmations suggesting the momentum is slowing. If you combine that with MACD divergence then you likely have a very high probability trade.
Smart traders also use trends and support and resistance. If you find divergence right at the top end of a key level of resistance, then you have additional confirmation. The same could be said for divergence along with a trendline break or candlestick reversal patterns.
The objective is not to make your analysis overly complex with too many indicators, it is to use 2 or 3 indicators together that compliment each other. A combination of RSI plus MACD plus Volume gives you momentum, trend, and participation all in one screen. This layered approach can dramatically reduce false signals as seen with using a single indicator.
Remember that indicators are tools, not crystal balls. They function best when you know what each indicator is measuring and how they can confirm information with each other. It is better to have a deep understanding of a few indicators instead of a light understanding of 20.
Practical Divergence Trading Strategies That Work
Now let's get into actual trading strategies you can use starting today. Theory means nothing without practical application.
Reversal Trading Strategy
At this point, regular divergence is quite fruitful. Think about it: you want to catch a trend reversal early enough so as not to get run over by the trend that is already in place.
The first step is to find a clear trend. An example could be the EUR/USD, which has had a few weeks of being in an uptrend. You finally see the pair achieving a new high at 1.1250. Upon market inspection, however, your RSI shows that the previous peak has formed a lower high. This is divergence, but remember: you don't trade just yet.
Then, you wait for confirmation. It could be a bearish candlestick pattern, maybe a break below key support, or perhaps a break of a trendline. Think of watching that basketball game, and you see the excitement is fading. You aren't going to bet against the leader team until they actually start missing shots.
So you wait and it finally happens, and then you short with stop loss placed just above the most recent high, then you take profit at the next key support with an overall minimum risk-reward over 1:2.
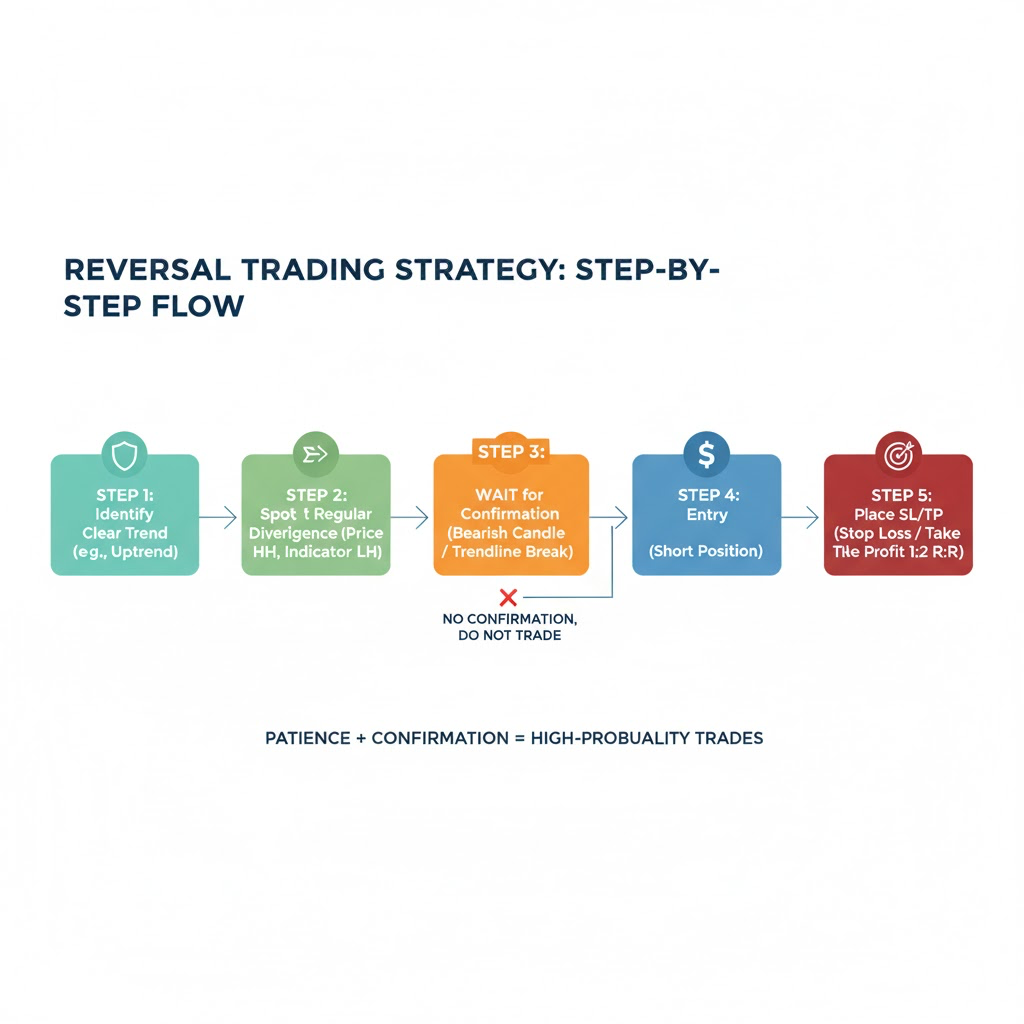
The beginner mistake here (and I've made it) is getting in early. Just because you see divergence does not mean that the trend is going to reverse immediately. The market can stay irrational much longer than you can stay solvent. So, you want to be patient and wait for confirmation.
Trend Continuation Strategy
Hidden divergence is your tool for holding positions longer and scaling into winners. This strategy assumes you are either in the trend or looking to enter, after a healthy pullback, in the context of a strong trend.
Imagine GBP/USD is in a nice uptrend but has a pullback from 1.2800 to 1.2650. During that pullback, you notice that as the price action has not made a new low, your RSI has. That is hidden bullish divergence telling you that there is still momentum in this trend.
Once you see price action confirming the end of the pullback, (maybe a bullish engulfing candle or a break above short-term resistance), that is your entry signal. Your stop loss will be below the pullback low, and your profit target is set for the next swing high or higher.
This strategy is similar to continuing to run when you can still feel that you have energy in the tank. You are using the rest to charge up for the next push, not because you are exhausted from running. It is simply confirmation that the engine is still running strong in the trend.
Multi-Timeframe Strategy
This is a professional method which merges different time frames for optimal efficiency. You utilize the longer time frame to determine the trend and to identify divergence. Then you look at the shorter time frame more closely to fine-tune your entry.
Let’s start on the daily chart. You spot regular divergence on the EUR/USD. This tells you that there is a potential reversal. So now you have the overview. Zoom into the 4-hour or 1-hour chart. Search for some divergence or confirmation signals on the lower time frames that match the daily analysis.
When the longer and shorter time frame line up together, you have a high probability entry. Your timing is distinctly improved because you are entering trades with the longer time frame direction (or reversal), but are using smaller time frames to reduce your overall risk.
Risk Management Is Non-Negotiable
A proper risk management system needs to be adopted alongside any strategy or you are gambling. Each of these levels works as follows:
Position sizing - Never risk more than 1-2% of your account on any one trade; that's for starters. For instance, if your stop loss is 50 pips away for a $10,000 account, you need to find a position size, in lots, on this particular trade so that if you get stopped out, you only lose a maximum of $100-200 dollars.
Stop Losses into all trades - this is crucial. There are no exceptions to this. Your stop loss should be at logical levels; for example, after the most recent swing high/low, and not just some random distance. You want your stop loss to allow for the trade to have room to breathe, while still continuing to protect you from a large loss.
Take Profit Levels - this should at least double your risk. For the above example of risking 50 pips, you will use at least 100 pip take profit levels. Followed is a simple risk vs reward. With a 1:2, if you lost even 40% of the time, you would still be a profitable trader.
Trading Psychology
The most challenging aspect is not the identification of divergence but waiting for the correct setup without feeling pressured to take every divergence signal. FOMO (fear of missing out) takes out more accounts than a terrible strategy. When you see divergence forming, you might want to act immediately, but you must deny the temptation to jump in early without confirmation.
Here’s the checklist you want to have in place before acting:
-
Divergence indicator
-
A good contextual trend understanding
-
Confirmation signal
-
Risk-reward aspect
-
Multiple timeframe agreement (only if you’re using a multi-timeframe approach).
Then, only when all boxes are checked do you act. Good discipline in trading consistently is the difference between a winner and a gambler.
Cross-Market Application
These strategies are applicable beyond forex. You can find divergence in Bitcoin, Ethereum, stock indices, gold, and oil, all of which work on the same principles, regardless of asset. A daily MACD divergence in BTC/USD is following the exact same playbook as a daily divergence in EUR/USD. This makes divergence strategies very useful in today's multi-market environment.
Success with these strategies requires practice above all else. Start small, document every trade you take, and analyze what worked and what didn't. Eventually you'll get a sense of what a good divergence setup is versus low quality signals that you should just ignore.
Common Divergence Trading Mistakes and How to Avoid Them
Even experts in trading can fall into these traps. Let's ensure you do not.
Mistake 1: You are only focused on Indicators, not doing any price action analysis
This is the major killer of divergence trades. You see that RSI is making lower highs, while price has made higher highs and you immediately short the market with a divergence trade. What you failed to do is consider that price is breaking through resistance levels, making bullish candles and not showing any signs of weakness at all.
Indicators are lagging the price. They are created using price, not the other way around. If you have apparently conflicting evidence with price action and an indicator, lean towards price action.
The fix: Deep breath. Then the next time you have a divergence, prior to taking action, zoom out and look at the price action structure. Are the highs at major support or resistance? Are there confirming candlestick patterns that signal weakness? Did it break the trend line? All of these price action components should confirm when taking the signal as valuable for your capital allocation.
Think about it like betting on a sporting event simply based on stats, without ever watching the game or following who is injured. What you might see in the numbers may suggest 1 thing, without looking at the guy who dominates possession and scoring chances in sport. You did not take those perceived realities into account and missed value.
Mistake 2: Ignoring Trend Direction, Trading Against It
Resisting the trend is sheer financial madness, even with divergence backing you up. Sure, divergence can signal a potential reversal, but "potential" doesn't mean "definite." Trends can diverge and reverse hours, days or even months later. If the EUR/USD is on a serious multi-month up trend and you identify some divergence on a 4-hour chart, you would be asking for trouble to short that pair. The larger trend is likely to run you over before any meaningful reversal begins. The solution: Always start with identifying the leading trend first. Use a higher timeframe like a daily or weekly chart.
Only trade divergence setups that align with the major trend, ie. hidden divergence for trend continuation, or after you see clear signs of trend exhaustion on multiple timeframes. A professional example: you notice RSI divergence on BTC/USD on a 1-hour chart during a significant bull run. You short BTC, only for it to officially rally another 20% after you placed your trade before hitting your stop. The divergence was valid, but the massive momentum of the trend made it worthless. Do not be that trader.
Mistake 3: Relying on a Single Indicator for Divergence
One indicator giving you a signal is interesting. Two indicators confirming one another are interesting. Once you have three, all confirming independently of each other (including price action and volume) and now you're in the zone to trade.
After considerable testing, even diverging on a single indicator creates a ton of false signals. For example, did you know RSI might show divergence while MACD and momentum show strength? Which one are you going to believe? Guessing without additional confirmation.
The solution to this conundrum is to make a checklist and stick to it:
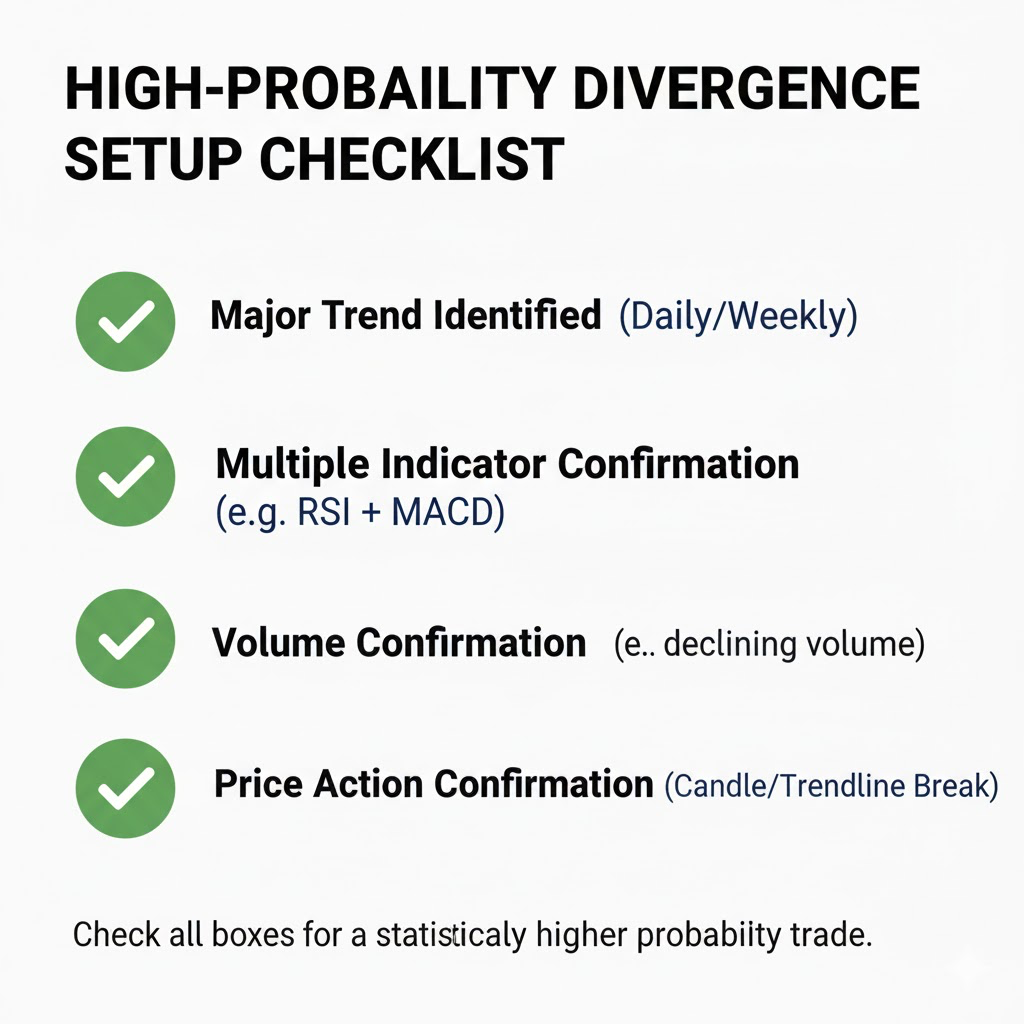
Not until you check more than one (preferably all five) on your checklist should you consider taking a trade. This way you'd be able to separate the noise from opportunities and get focused on high probability set ups.
The Reality Check
Divergence is a helpful tool, but it cannot be relied on as an independent system. It shines when coupled with decent trend analysis, price action analysis, volume analysis, and risk management. Divergence signals on their own are no better than a coin flip.
Traders who are successful with divergence are using it as one tool among many. They do not get excited when they see divergence. They wait until their conditions are true, and then they act.
Don't be an example; take other people's mistakes, and use them to learn what not to do. Think of divergence as a warning system that tells you to analyze, and not an automatic signal to get into a trade. That alone will save you from countless losing trades.
Real-World Divergence Examples Across Forex and Crypto Markets
Let's look at real historical examples where divergence presented a definitive trading opportunity. These are not hypothetical examples, and neither do they represent perfection. These are actual setups that traders were able to apply for profitable trade decisions.
Case 1: EUR/USD Daily Divergence in May 2023
In early May in 2023 the EUR/USD was making its way higher, registering new highs around 1.1050. For the casual observer that is strength. However, as I mentioned earlier, the daily RSI was painting a different picture. While the price action pushed to fresh highs, the RSI was making distinctly lower highs and forming a textbook divergence that was bearish in nature.
What made this next setup all the stronger is that the divergence was happening as it approached an area of pertinent resistance that had previously rejected the price multiple times. Additionally, we could see that volume was declining as the price was rising, which means there were fewer market participants who were responsible for the price rally. Consequently, we had a perfect trifecta of divergence, resistance, and declining volume which provided a really strong signal for reversal.
If traders were astute enough to recognize this, they could enter short once a bearish engulfing candle confirmed the reversal. Over the next two weeks, the EUR/USD would go to register around 200 pips of profit once it began to pull back to the 1.0850 mark.
The lesson: Significant divergence at important levels, confirmed by volume and price, gives reliable signals. This was not about a guess, it was about reading clear warning signs that the market was sending.
Case 2: GBP/USD Hidden Divergence in July 2023
The GBP/USD was in a strong uptrend for all of June and early July 2023. By mid-July, the price had pulled back from 1.3150 down to about 1.2950 which looked like potential trouble for bulls. Many traders were getting jittery that the uptrend was coming to an end.
But hidden divergence said otherwise. During this pullback the 4-hour RSI made a clear lower low while the price was making a higher low. This was a clear indication that while the market was taking a breather, the prevailing underlying market strength was still intact. The pullback was just a healthy pull back within the prevailing trend.
Traders who recognized this hidden divergence would have had the assurance to trade long around 1.2950-1.3000, riding the continuation back up over the next several days to back past 1.3200. Approximately 200-250 pips had been generated.
What motivated the success of this approach? The overall trend on the daily chart was bullish. The pullback encountered support at a previous horizontal level of consolidation. The hidden divergence confirmed that the trend strength had not dissipated. All of these conditions created a high probability trend continuation trade.
The lesson learned is, do not fear pullbacks in strong trends, and use hidden divergence to assist you in determining when these pullbacks are buyable dips, not trend reversals.
Case 3: BTC/USD RSI Divergence June 2023
Bitcoin was on a meteoric rally in the first half of 2023, rising from around $20,000 and pushing well past $30,000. By mid-June, with BTC/USD nearly at $31,000, it was making new local highs. As momentum traders got increasingly more bullish, the expectation of sustained momentum continued.
However, the daily RSI chart told a different story. As prices continued to make new highs, the RSI was making lower highs. This bearish divergence surfaced after an enormous rally around a key (psychological) price level of around $31,000. Additionally, and as a clear sign of exhaustion, the volume was showing a lack of participation as price rose.
Moreover, the weekly timeframe was also demonstrating early signs of divergence, producing multi-timeframe confirmations. Traders who spotted the setup and waited for a bearish reversal candle could have entered short, or at the very least, tightened stops on long positions.
Bitcoin eventually corrected from $31,000 down to about $25,000 in the following weeks, a considerable pullback of 20%. This divergence signal gave traders an early warning to protect their price profit, or even to position for the correction.
The takeaway: Even in extremely strong bull markets be leery of momentum divergence, especially at significant psychological levels. Multi-timeframe divergence significantly increases the reliability of the signal.
Commonalities in Divergence Trading Success
These real world examples of divergence exhibit a number of commonalities.
- The divergence was at significant support or resistance, not random spots in the middle of nowhere. Context matters a great deal. Divergence occurring ahead of key support or resistance tends to have a lot more merit than those occurring in no man's land.
- Volume confirmed the divergence. Divergences indicated reversals, so volume would usually decline as the trend exhausted themselves. Whereas on a continuation, volume would often pick up during the resolution of the pullback.
- Multiple timeframes agreed. The most credible signals had daily divergence confirmed with 4 hour signals, or even weekly divergence confirmed with daily signals.
The confirmation would be provided by price action, prior to any entry. None of these trades would have worked out if you simply entered on the first inkling that we had divergence. The patient traders in the examples waited for candlestick confirmation and/or trendline breaks and or level breaks prior to entering their capital.
The takeaway: Divergence can be helpful. Just trade divergence in the proper context of trend and support and resistance and volume and price action confirmation. It is not magic. It is systematic analysis of the way that market forces are changing under the surface price change.
Conclusion & Call-to-Action: Master Divergence to be Smarter in Your Trading
Divergence is one of those rare tools that actually gives you an edge in any market. The majority of traders are reacting to whatever price just did, and divergence can show you the lag of what price might do next. That's powerful and easy to understand in the trading context.
In this guide we have discussed the essential ingredients for trading divergence successfully. You understand what divergence is and why you care to find it. You understand the difference between regular divergence for reversals and "hidden" divergence for trend continuation. You also know which indicators work best and how to layer indicators together to give even stronger signals.
Most significantly, you have discovered usable tactics as well as practical scenarios that demonstrate how divergence offers legitimate trading opportunities. Once again, don't overlook the importance of this one truth - EUR/USD reversals, Bitcoin corrections, GBP/USD trend continuation - divergence patterns repeat in every market and in every time frame.
But here's what separates the divergence traders that are successful from those that are unsuccessful - they do not trade divergence in isolation. They use trend analysis to confirm they are not fighting the market. They use price action confirmation to confidently avoid getting in too early. They use volume analysis to examine whether the divergence signal has real conviction behind it. They use multi-time frame analysis to maximize the probability of success.
Then, risk management is equally important as well. The best divergence signal in the world means nothing if you risk too much capital or place stops in nonsensical places. Every trade needs a clearly defined risk, a good risk reward ratio, and a position size that keeps you in the game when one or multiple trades do not work.
Remember the common mistakes we discussed. Don't trade divergence blindly while ignoring what price action is telling you. Don't fight strong trends just because you see some divergence on a lower timeframe. And never rely on a single indicator when multiple confirmations are available.
The next step is practice. Reading about divergence is beneficial but actually being able to identify and trade these setups allows you to build real ability. Start by going through historical charts while marking the price points where you see divergence. Then, check what the price cleaned up after the divergence occurred; was there a meaningful price reaction? Look to see if certain contexts produced the best price action or if some were false signals.
Are you ready to take your divergent knowledge to the next level? Open a Tradewill demo account today and practice your trading potential in the live market without risking a single dollar. Learn your market timing and develop the comfort to trade divergence like a true trader before putting real money into your trading.
Disclaimer: The content of the blog does not represent any position of Trade W, does not serve as any trading-related decision advice, and does not endorse any third-party.