

 Trade W
What is a Double Bottom in Forex? A Beginner's Entry Point into Technical Analysis
A double bottom is among the most dependable reversal patterns in technical analysis. This particular chart pattern indicates when a currency pair has most likely reached its lowest point and is about to begin to move up again. Essentially, the market is saying, "I have tested this price twice and it has held- let's go up."
This pattern shows up on your trading chart as a shape that resembles a letter "W". There are two distinct low price levels, "bottoms" that are relatively at the same price level. In between two bottoms, you will see a little recovery, which creates the middle peak of the W. What gives this pattern such value is that it signifies the end of the market's move down, the start of the market's move up.
For foreign exchange (forex) traders, determining double bottoms could be the difference between saying goodbye to a great opportunity and spotting a market that is potentially reversing trend. A double bottom would essentially be like you have a crystal ball that helps you determine where the price might move to at some point in the future, although in trading, nothing is certain, nor will there ever be guarantees.
In this guide, we are going to walk you through everything you need to know about double bottoms, so you will learn what to look for, what causes them, based on real forex market examples, and how to trade with them safely. By the end, you are going to have another useful trading tool to use the next time you are trading.
What is a Double Bottom? Definition, Key Characteristics, and Its Importance in Forex
So, what does double bottom actually mean? Think of a basketball (or any type of ball) bouncing on a flat, concrete surface. When the basketball hits the ground, it bounces back up. Eventually, it will come down again and hit the same flat surface, but then it will launch back up.
The flat concrete surface is strong enough to withstand many impacts as long as it doesn't crack and break apart (or break down). A double bottom is doing exactly that on a forex chart.
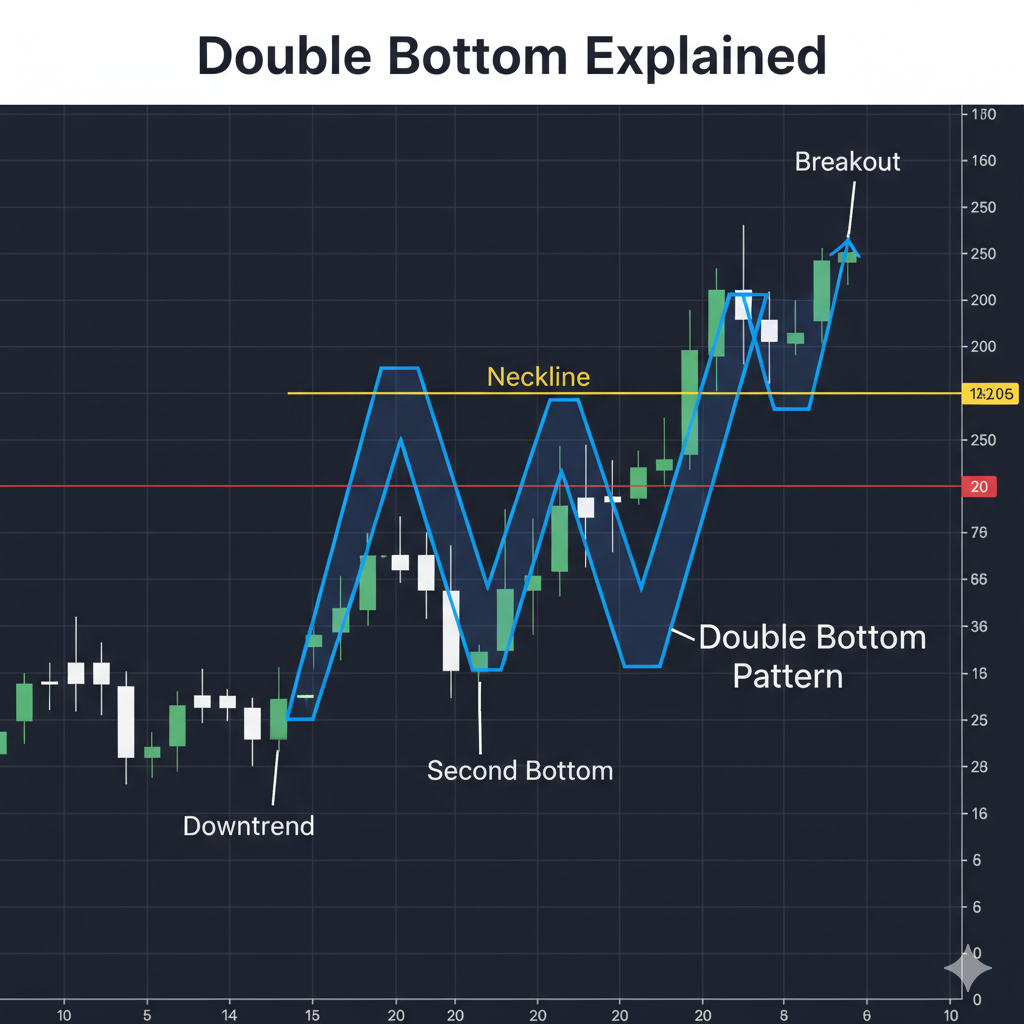
A double bottom is a price pattern that occurs after a currency pair has experienced a decline for an extended period. Here is what you will see:
- The Setup: We see a clear downtrend, where prices have been consistently going lower over time; this is our first part of the pattern or the "setup."
- First Bottom: Prices fall to a low point, then bounce back higher. This is our first bottom of the trough. It is as if the market is checking out how low prices can go.
- The Rebound: After prices fall to that first low, they bounce back, but not all the way back, just on the rebound from that first low. It is more like a pause or a reprieve in the selling.
- Second Bottom: This is where it gets interesting! Prices fall again, but this time, prices do not break to new lows. Prices slip again, down to around the exact level as the first bottom. This is our second "trough."
- The Breakout: The pattern will not be confirmed until prices break out above the highest point in between the two bottoms. This point is considered the "neckline" of the pattern and is confirmation that the downtrend phase has completed.
What is the difference between double bottoms and single bottoms? A single bottom points to one low, capitulate, the price bounces up, but might not signal a strong reversal. While a single bottom can signal some reversal, the degree of reliability is not as strong as a double bottom, simply because the market only tested that level once, but received confidence that the price would be lower. A double bottom is evidence that the intra-order flow pushed potential prices lower two times, all of which failed.
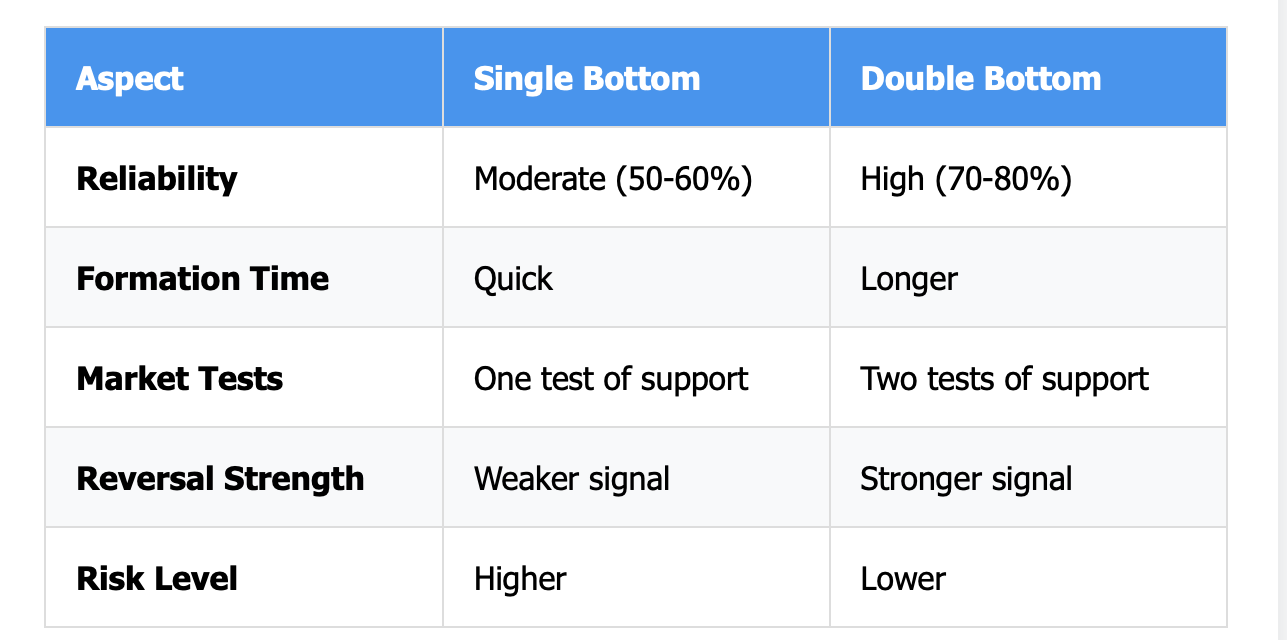
The formation of a double-bottom pattern sets up a sizable part of market psychology. The first bottom reflects sellers driving prices lower with vigour. The bounce back up says buyers, to some extent, are coming into the market on the way back (up). Then, as the price falls back to an appropriate level again and holds, it shows the price area has developed into a 'power zone.' That also means price action buyers are willing to buy at this level, and sellers have lost their juice and are exhausted to push the price lower.
The understanding of this buyer and seller tug-of-war is a setup for the price changing direction. When the neckline breaks, buyers jump in and buy typically. By doing this, they recognise a pattern and then enter 'fuel' for the new trend.
Recognising a Double Bottom in Forex Charts: Process for Identification Step-By-Step
It takes time and practice to learn how to identify double bottoms, but once you know what to look for, they will jump out. Similar to the experience of you learning how to recognise your friend's voice in a group of people, at first you are lost, but eventually you learn to listen in a specific manner to immediately recognise that voice in a crowd. Below is your process for identification broken down into steps:
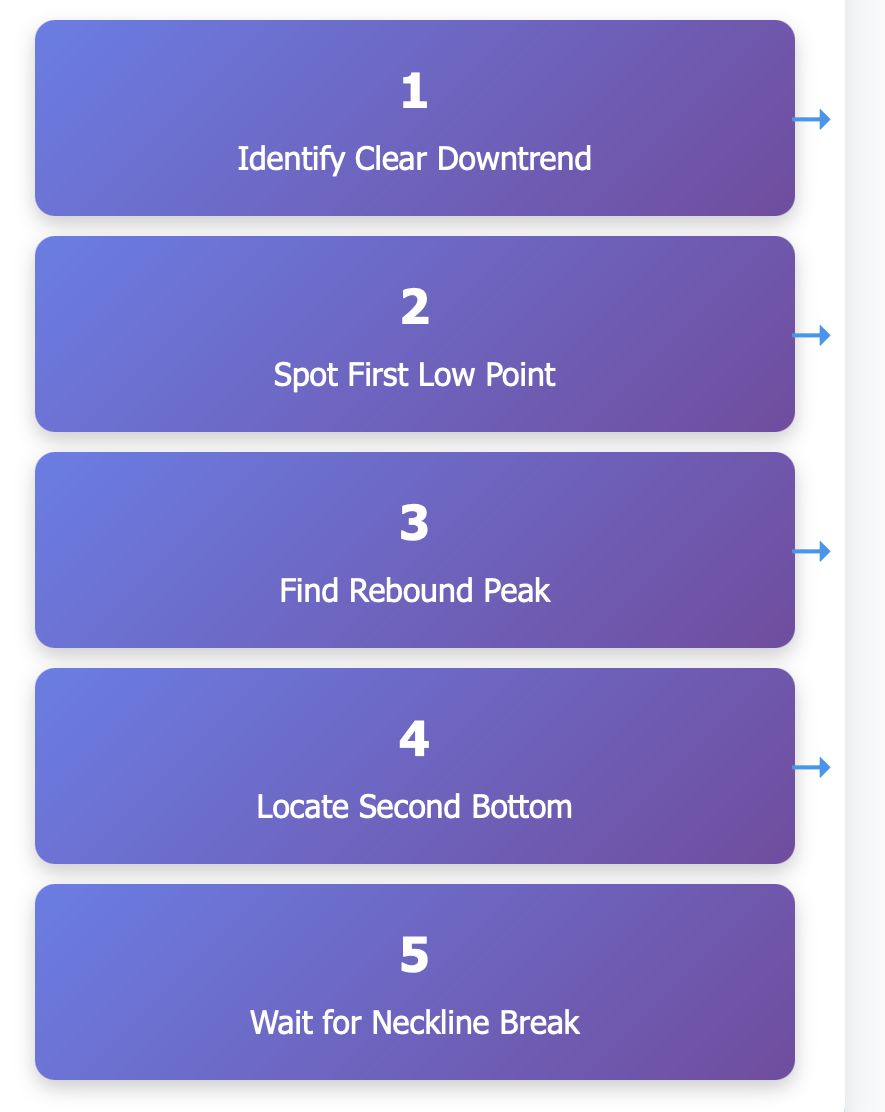
Step 1: Clear Downtrend Prior to Double Bottom Developing: Prior to seeing a double bottom develop, you want to clearly see a currency pair that has been in a downtrend. It does not have to be 1 month or longer; a currency pair may have been in a downtrend for a few days or weeks and be declining. You want to see lower highs and lower lows on your chart. Without a clear downtrend, you do not have the necessary conditions for double bottom development.
Step 2: Recognise the First Low Point: By looking at price action, you'll know when the price is at a good low point, and then you're looking for a bounce from that low point. The first lower point should be low enough, and not just a quick low point in the low-fresh action; it's possible they creep lower each time. To confirm the first bottom, you will need to see the price bounce from that first bottom. Most likely, the price would move 3-5% from the first low and more for some of the Major currency pairs.
Step 3: Identify the Rebound Peak: After the first bottom, the price will bounce back upward at least to some degree. Identify the highest point of the bounce, and this point will be your possible "neckline". It does not have to be a large bounce necessarily, but there should be evidence that buying power had the upper hand over selling power - even if only momentarily.
Step 4: Find the Second Bottom: This is where the fun begins. Prices should fall back down to basically the same level as the first bottom. The two bottoms do not need to be exactly at the same price—it's okay if there's a little wiggle on the second bottom—but it should be close enough to where you can draw a horizontal line between the two bottoms.
Step 5: Wait for Neckline Confirmation: This is where patience truly pays off. The double bottom pattern isn't complete until prices rally back up above the neckline (that peak between the two bottoms). Many traders make the mistake of being premature and entering too early, only to have the double bottom fail on them.
Timeframe Recognition
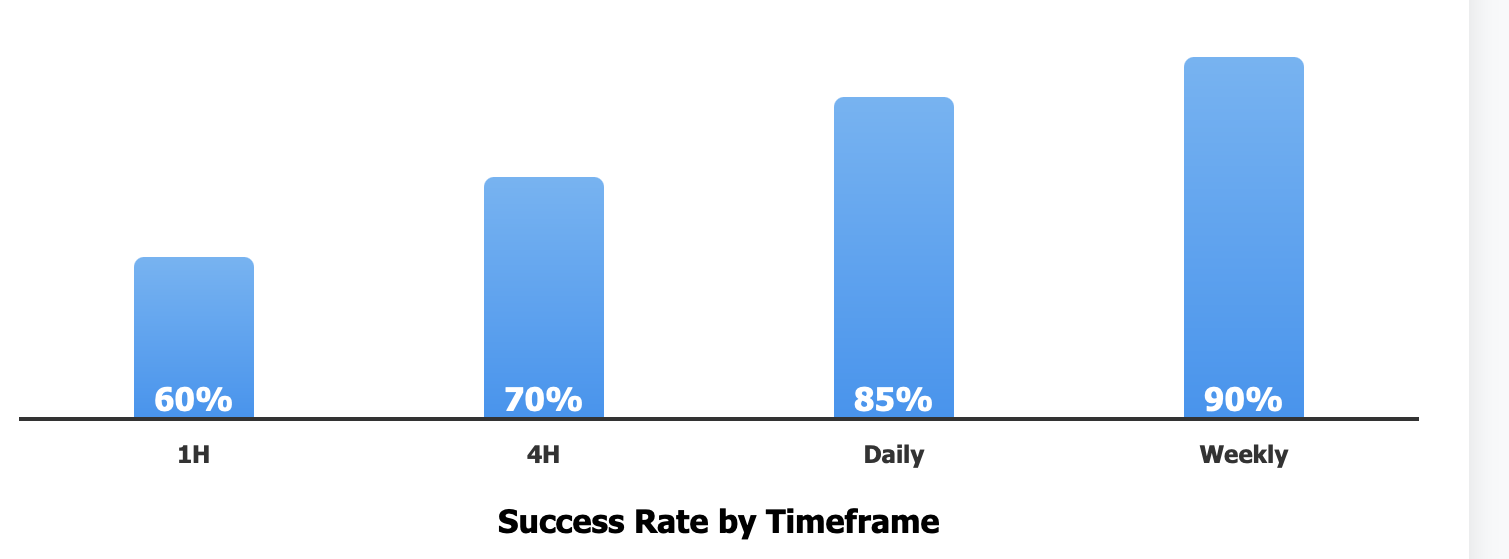
Double bottoms are authentic on every timeframe; however, they operate differently from timeframe to timeframe. For instance, on short timeframes, like a 1-hour or 4-hour timeframes, the patterns will develop faster but may not be as physically dependable due to market noise. A daily timeframe and weekly timeframe will create a stronger and generally more reliable double bottom, but at the cost of development time.
Using Confirming Tools
Smart traders do not rely solely on the pattern. More often than not, when the neckline is broken, the volume increases because more traders are involved in the breakout. Based on the trading activity on the chart, the MACD may show bullish divergence, meaning it is making higher lows while the price is making lows that are approximately similar. The RSI may show oversold at the bottom, but the RSI may build strength again once the price breaks the neckline.
Not every dip will form a double bottom. Some dips will form a triple bottom, and others may fail and break down the prior low. Some dips may simply move sideways. This is why it is helpful to wait for confirmation. Confirmation helps eliminate false signals; otherwise, a lot of cash will be lost in the trading account.
Double Bottom Trading Strategies: Entry, Stop-Loss, and Profit Targets
The fun part is now in play - executing the double bottom setup. You might look at executing the double bottom setup like a video game where you have learned the pattern of the boss. You have seen the attacks twice already, so now you know when to strike, as you are finally getting a position, andd there is an opening.
Entry Strategies: Time to Pull the Trigger
The most common method would be to simply buy on confirmation when the price breaks above the neckline. This gives you confirmation that the price pattern is working; only now, you need to pay the price for that confirmation, and in this case, it can be a slightly higher price.
Alternatively, you could put a buy order slightly above the neckline level and wait for the market to fill the order.
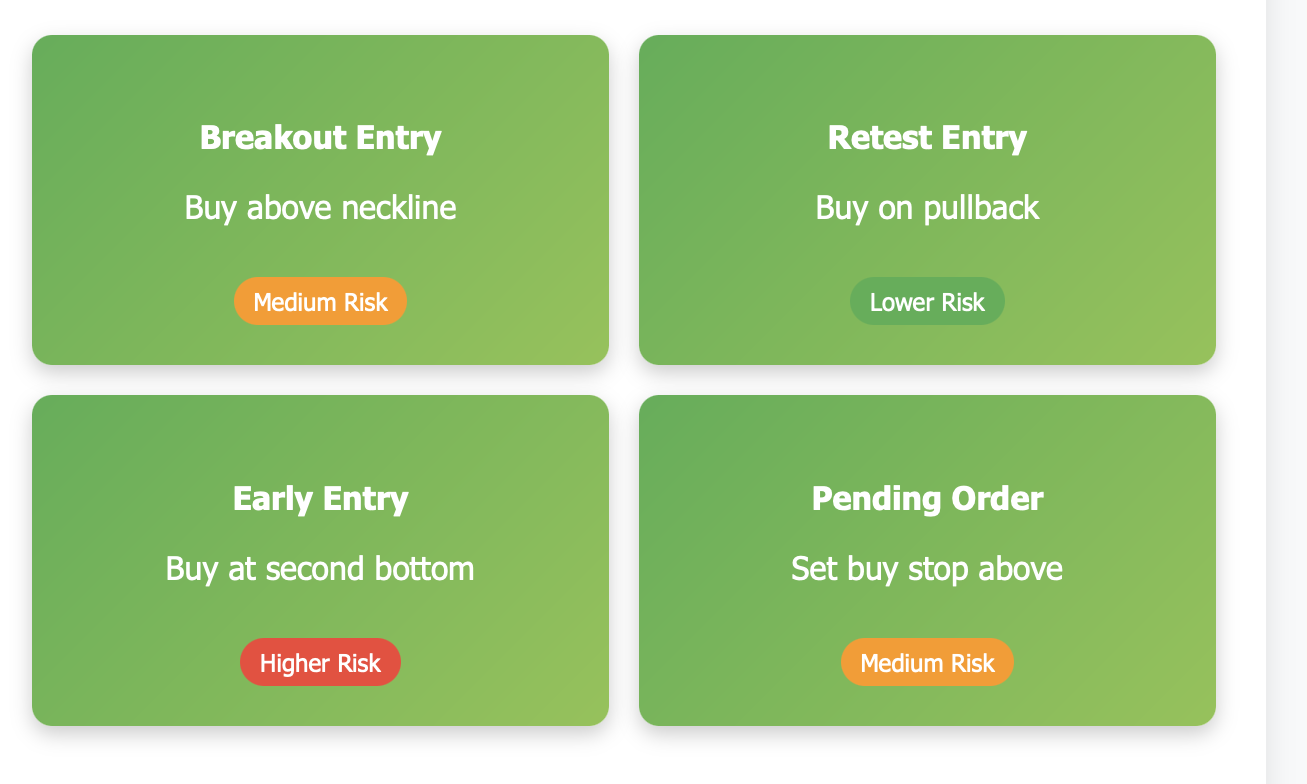
A more aggressive option is to buy on the retest. Many times, after the price has broken above the neckline, the price will retest and pull back to the neckline. The retest gives you an opportunity to buy at a better price; however, if it is a breakdown, then your pattern has failed.
Some traders may trade early by buying when the price starts to bounce from the second bottom. This option gets you in at a nice price level, but you have not yet confirmed the pattern, so it is a little riskier. Only experienced traders should try to do this.
Placement of Stop-Loss: Protecting Your Capital
You want your stop-loss to sit just below the lower of the two bottoms. This makes sense because if prices go below this level, the pattern is clearly in failure. You don't want to place your stop just at the bottom; you want to give yourself a little room for normal market noise to fluctuate. 10-20 pips below the bottoms works great for the major currency pairs.
When trading with chart patterns, you should never trade without a stop-loss. The best chart patterns fail, too, and you need to be protected when they do.
Profit Targets - When to Take Your Profit
The typical profit target for a double bottom is the height of the pattern. You will measure the distance from the neckline downward to the bottom, and then project that same distance back upward from the neckline. If the neckline is at 1.2000 and the bottoms are at 1.1900, then our target is now 1.2100. (This is a 100 pip height of the pattern measured from the neckline of 1.2000).
Of course, this target is not an absolute. This target is linked to the idea that the energy produced by forming a price pattern many times is then released in the opposite direction. Markets move in waves, and the measurement simplifies this concept into one cut-and-dry idea.
Advanced Risk Management Tips
Avoid risking more than 1-2% of your trading account on a single double bottom trade. Regardless of how confident you are that a trade will be successful, the forex market does not always move as you want. You may choose to take a portion of your profits at the measured target, and allow the rest of the position to run with a trailing stop. Many times, a double bottom trade could lead to much larger moves than the target.
Be aware of what is coming up around your target level. If you discover a strong level of resistance at or near your profit target, you may consider exiting early, instead of letting a winning trade flip into a losing trade. Pay attention to the volume while the trade develops. Strong volume that is increasing, up to your profit target, is a positive element, and diminishing volume indicates that the move is running out of steam.
As an example of a 'real-world' scenario, EUR/USD has formed a double bottom pattern at 1.0500, the neckline being at 1.0600. You would enter on a break above 1.0600 and consider the stop at 1.0480 (20 pips below the bottom) and then look to take profit space above 1.0700; this would typically give a risk-to-reward of about 1:0.83. That may not be ideal for your risk parameters, so typically you would want to wait or see if the price will retrace to give you a better entry price.
Avoiding double bottom mistakes: pro tips for Forex beginners and traders
I'd like to get real here for a moment. Even seasoned traders make mistakes when facing double bottoms; therefore, it is common to struggle within a real pattern this early into your experience and practice. Consider the mistakes you're making when seeing double bottoms as, in a sense, akin to touching a hot stove; once you have figured out the "pain points," you will be less likely to trust those points again without proof otherwise.
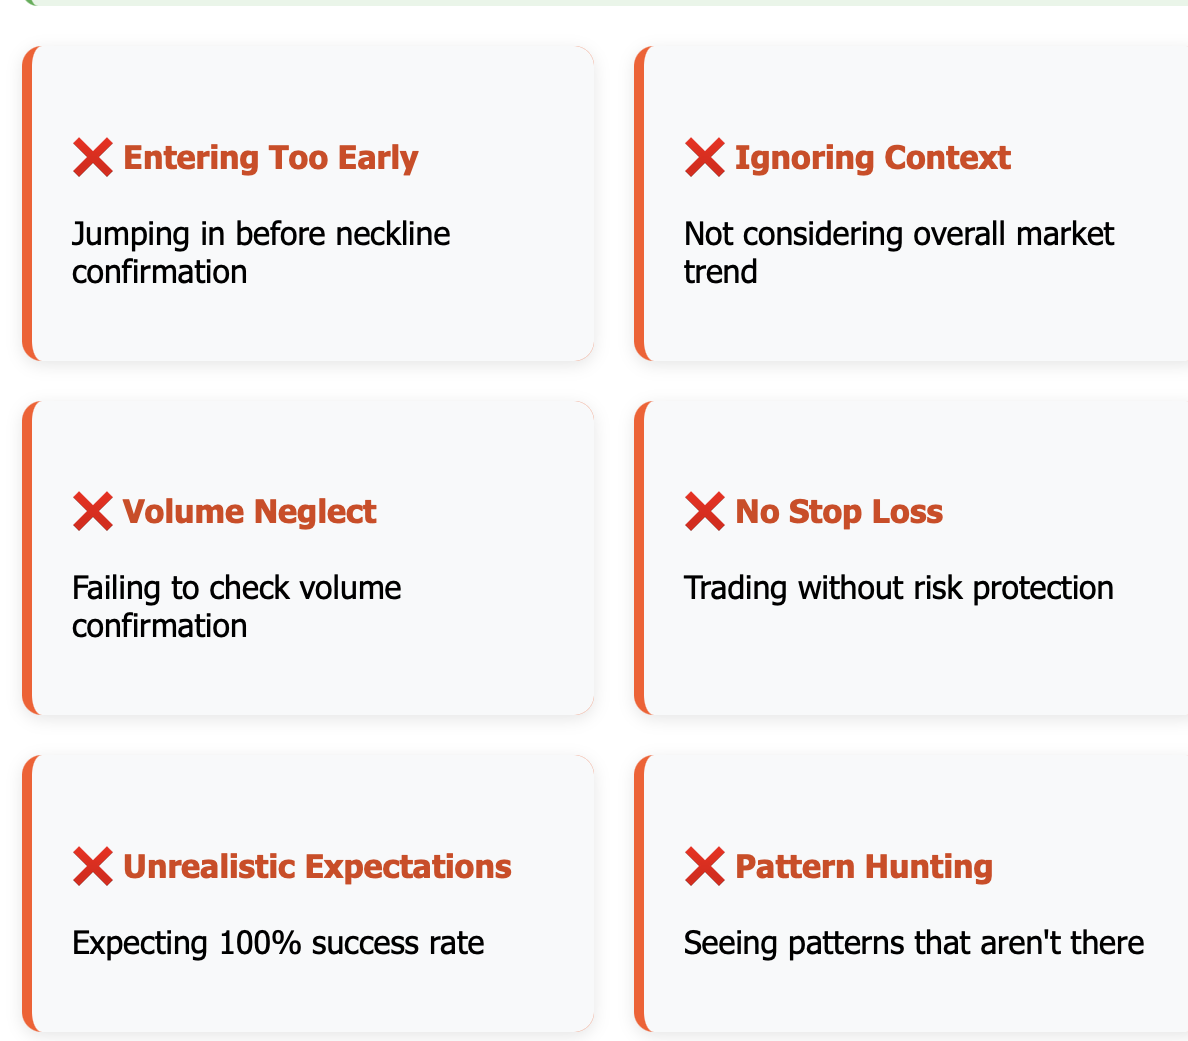
Entering Too Soon: The most common mistake? Entering too soon, before the pattern unfolds. This is equivalent to thinking you could do well on your final exam because you failed both midterms - you need more evidence that the situation is improving. Many traders will see two similar lows and think, "double bottom," yet without breaking the neckline, the conditions haven't changed - only wishful thinking.
You must wait for a confirmation: Yes, you could be late to the lowest part of the move, but often you will miss many losing trades. It is better to be late to the trade and be correct in your analysis than early in the trade and wrong in your analysis.
Neglecting the context: Double bottoms do not exist without the context surrounding them. When the overall market trend is strongly bearish or major news is coming out, the most perfectly constructed double bottom may fail. Always think about what else is going on in the market.
Review the longer time periods. A double bottom on a 1-hour chart means absolutely nothing when the daily chart is still indicating the currencies are in a strong downtrend.
Volume Neglect
Volume will give you some information about the conviction behind price movements. A double bottom with low volume is nothing more than a whisper among a racket; it may be relevant, but you might overlook it. When volume is strong on the neckline breakout, you can have much more confidence that the market is truly changing directions.
Unreasonable Expectations
Double bottoms do not hold. They fail at times, just like any other pattern will. Professionals understand that even their best setups work only 60%-70% of the time, at best. Don't risk your entire account on any one pattern, no matter how perfect it looks.
Additionally, not every double bottom is strong enough to signal a significant trend change. Oftentimes, they signal a small bounce, and the downtrend continues. Manage your expectations and your risk.
Set Stop-Losses
Let me repeat myself: always use stop-losses. Always position-size correctly. Always have an exit strategy before you enter the trade. Perfection of the pattern does not matter if you do not manage risk. One bad trade can erase weeks or months of profit.
Looking for Something That's Not There
When you are just learning about double bottoms, you may see double bottoms in everything you look at. Not every two-low formation is a double bottom; some may simply be normal price action. The formation will be obvious, together, clear, and will be observed after a notable downward trend.
Failed Breakout
At times, the price will break the neckline and then sharply drop back down. This is considered a failed breakout, and a reason why some traders wait for a retest of the breakout prior to viewing entry. When you find yourself in a failed breakout, just cut losses and leave!
The only way to mitigate errors is by practice and being patient. First, look at a historical chart for double bottoms, and you know the outcome of how they played out. Then, get a demo account and practice double bottoms with fake money to refine your skill. You can also keep a journal to log the reasons why the setup worked or did not work.
Remember, achieving the skill of trading double bottom patterns isn't about being right every single time; it’s about being right enough of the time, and managing your risk effectively to make money over time!
Become a Master of the Double Bottom Pattern - Start Practising on Tradewill Today!
I think you now have a good basis for an understanding of the double bottom pattern and for trading double bottom patterns. So to recap the mechanics: first, identify the pattern, then once prices break above the neckline, you can take it as a confirmation, then manage your risk with a stop loss and take profit price level.
Double bottoms are one of the definitive patterns to learn in technical analysis. You will see this pattern in all timeframes and with all currency pairs. Once again, this is a common pattern for a reason. It is just one pattern, and it is just one variable; the key to successful trading is how to combine patterns and indicators along with sound risk management, consider the context, and learn as you grow.
It is important to practice in order to learn double bottoms. The best way to practice is to go back in time in previous charts and explore double bottom patterns that were complete, and then see how they actually played out. You'll discover some patterns that worked out positively, and some that did not, and think about why. The ability to see patterns and what they are actually doing is a good skill not only for double bottoms but for your technical analysis as a whole.
Are you ready to practice? You can practice looking for double bottoms and trading them, using a demo account with Tradewill, with absolutely no risk to your own money. You will be exposed to actual market data, and you will have professional charting and experience in a risk-free environment using those skills.
When you are finally comfortably spotting double bottoms and are somewhat confident about the trading plan you have developed, then it can be appropriate to plan your entry into a live account. But again, don't rush into this process! Professional traders often spend unquantifiable time developing their methods for trading even a single pattern.
It is important to understand that you are not successful in trading simply because you have mastered a single trading pattern or trading strategy. Success in trading relies on building a solid understanding of market behaviour, risk management and trading psychology.
The double bottom is a great pattern to start your journey, but you should continue your professional development by learning about other technical analysis tools, fundamental analysis, and overall market awareness.
Start your journey today with a demo account at Tradewill, where you will practice spotting double bottoms, using your trading plan, and developing the necessary skills for success in the forex market. Your success in trading will hinge on what you have learned so far, but also your future practice commitments.
Disclaimer: The content of the blog does not represent any position of Trade W, does not serve as any trading-related decision advice, and does not endorse any third-party.