

 Trade W
What Is a Double Top Pattern? (A Beginner-Friendly Introduction)
The Double Top is one of the most reliable trend reversal signals in forex trading. One way to understand the Double Top is to think of price trying to break through a ceiling two times but failing to do so both times. The result is two peaks or tops that are roughly at the same level with a valley in between.
Double Top signals about a trend change occur after buyers begin to lose momentum after pushing price up to a resistance level two times. The first peak indicates initial strength in the price, but sellers begin to put in sell orders into the market. Then price rallies again and attempts to push through the same resistance level, but the sellers are now fully aware of the repeated attempt. The second rejection at this resistance is the first signal that the upward price trend may be over.
Think of it like shooting a baseball into the hoop two times. If the baseball hits the rim and bounces off twice, you definitely know you can not get through that defense, and it might be time to try another strategy. This is just the way it works with price action in a Double Top.
For instance, if the price in EUR/USD rose to 1.2000 two times and could not break the resistance level, where price fails to stay through, then the likelihood of a possible Double Top has occurred. Again, this particular case is labeled a 'potential' Double Top because not every Double Top creates a reversal, which is why you always want to wait for confirmation and consider the language of price before trading.
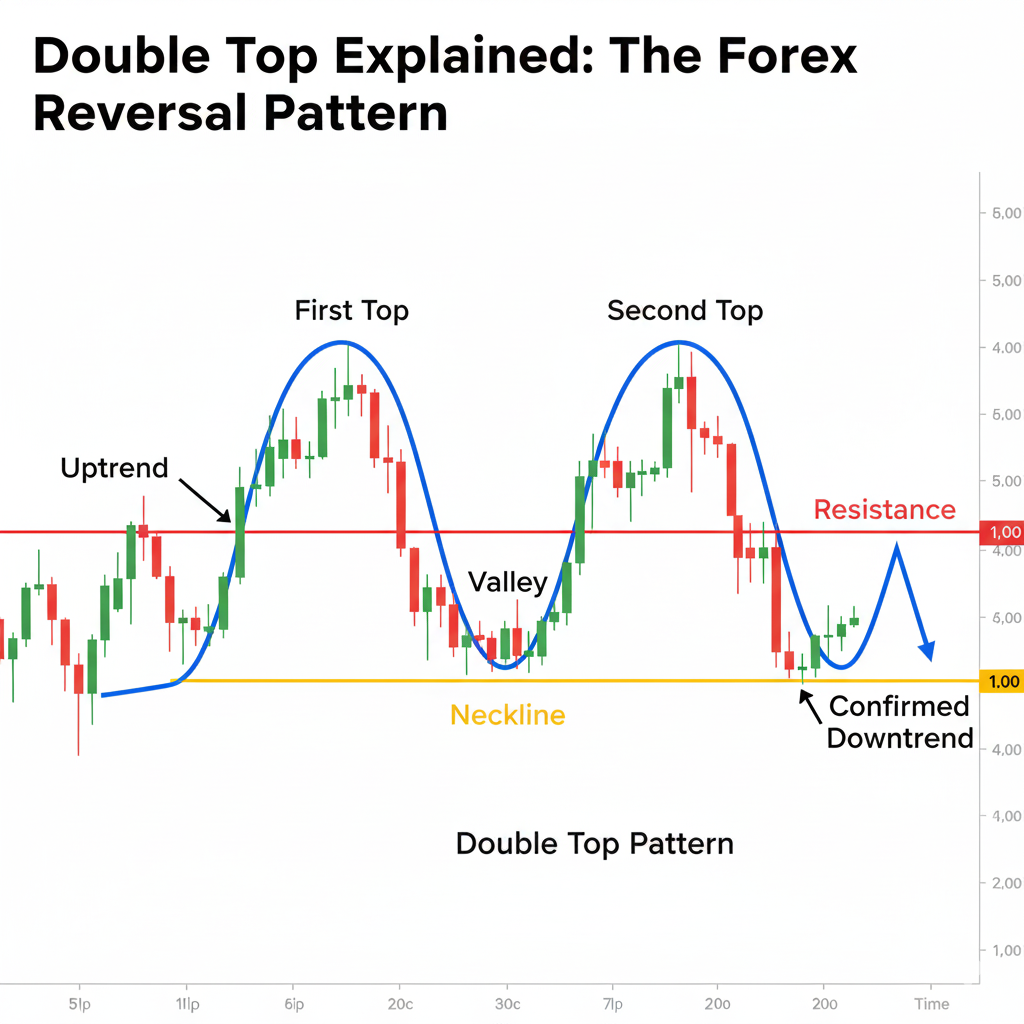
The same pattern can be seen on all timeframes, whether on a 5-minute chart or a monthly chart. The longer the timeframe, the more meaningful the reversal signal. A daily or weekly Double Top will have much more significance than one occurring on a shorter timeframe.
Remember, Double Tops are not crystal balls; they are signals to help you read market sentiment. When buyers fail two times at the same price level, it demonstrates weakness. Smart traders look for these signals but are not reliant solely on them.
How does a Double Top form? (Step-by-Step Analysis)
Understanding the development of a Double Top allows you to recognize them early in the process and helps you avoid false signals. A Double Top goes through a specific evolution over a period of weeks or months.
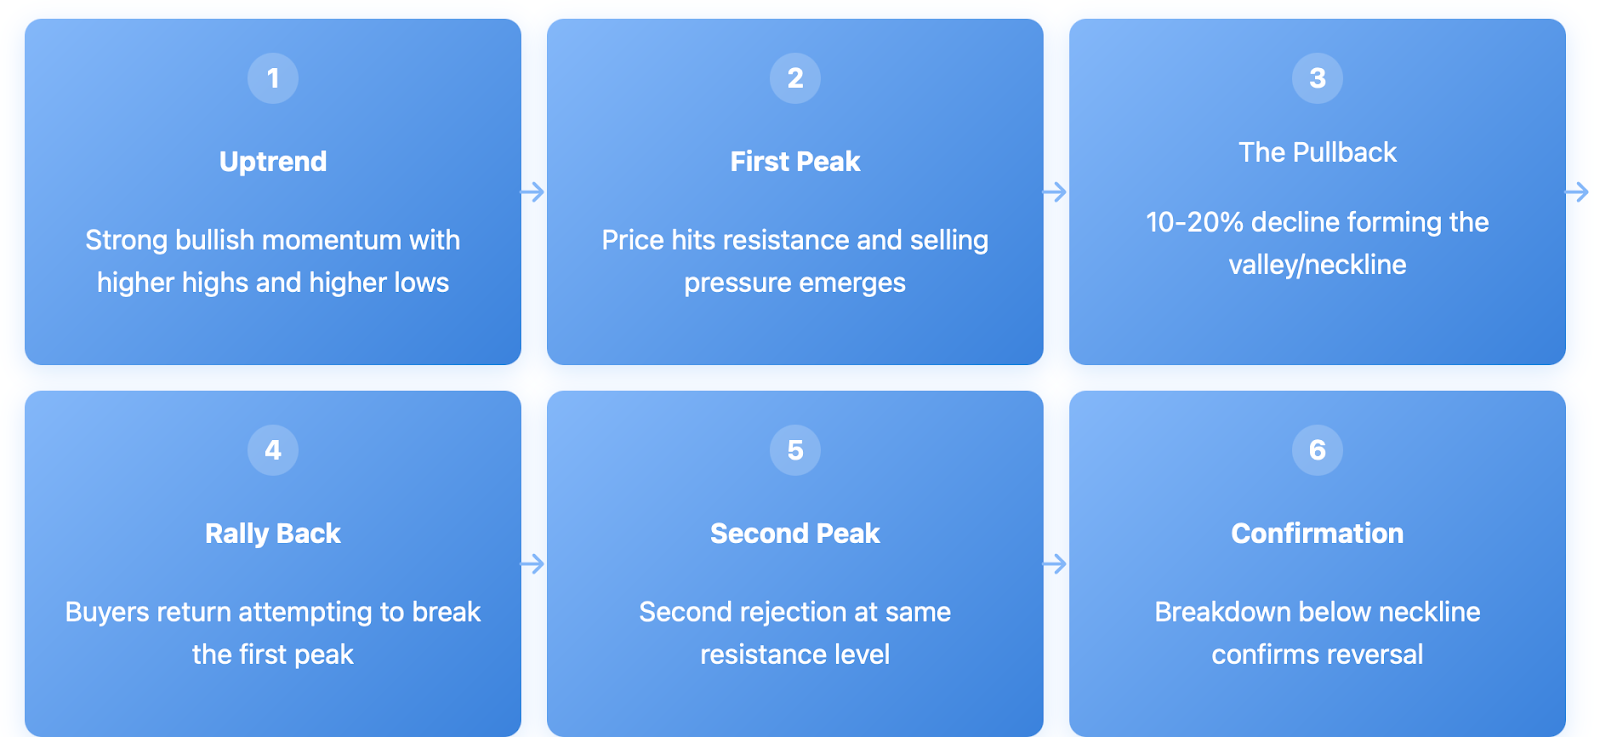
Step 1: The Uptrend All of this starts with a bullish uptrend. Price is making higher highs and higher lows indicating there is buying interest. The bulls have control and are driving price higher.
Step 2: The First Peak Price reaches a key resistance level and selling pressure begins to enter the market. This could be a psychological level, like 1.3000 in GBP/USD, or a technical level from previous price action. Buyers are unable to push above this level steadily, and the price begins to decline.
Stage 3: The Pullback (The Valley) The price pulls back from the first peak which we refer to the valley, or neckline. The pullback should be large ranging from 10% to 20% of the prior move. A small pullback will cause a number of false Double Tops.
Stage 4: The Rally Back Buyers come back into the market and push price higher. The idea here is to break the first peak and continue the uptrend. This rally shows that there is still some interest in the buyers.
Stage 5: The Second Peak Price retraces back to the same resistance zone as the first rejection - or just before it. The highs do not have to be the same but should be with 1% to 3% of the first high. A sell at either of the highs is an important rejection as well. The second rejection at resistance is the most important rejection.
Stage 6: The Confirmation The pattern is not complete until price breaks the valley created in between the two highs. A breakdown through the valley confirms that the sellers suspect to have taken control of price and the uptrend is likely over.
You may consider it like trying to scale a wall twice. You try to scale the wall once and fail. You wait for a minute and try again. You fall short again at the wall, and when you think all hope is lost and you walk away, that is your confirmation that the wall is too high.
Timing between the first and second peak also can be important. If they are too close in time (within a few hours), then the timing may not matter much. If there is too much time (like several months) between the two peaks, then other market factors may have changed substantially.
Gold (XAU/USD) is often a textbook example of a Double Top. Being a somewhat 'bursty' asset that has decent respect for psychological levels, it creates a situation where the patterns are easier to detect and trade.
Double Top vs Other Patterns (Clear Examples for Traders)
New traders typically mix Double Tops with other patterns, so let's take some time to go through the key differences between the patterns to be able to identify them correctly.
Comparison Between a Double Top and a Single Top: A Single Top has one peak, and then the price starts to decline. It is almost like a single failure and a decision to quit. It could be a sign of a reversal of direction, but is extremely less reliable than a double top. The second peak (that failed) in the double top is a more unequivocal sign that the buyer attempt is exhausted.
Yes, Single Tops happen on occasion, but they simply happen a lot and don't have a reliable significance by themselves. You will need some other confirmation by indicator, by volume, by candlestick patterns, etc.
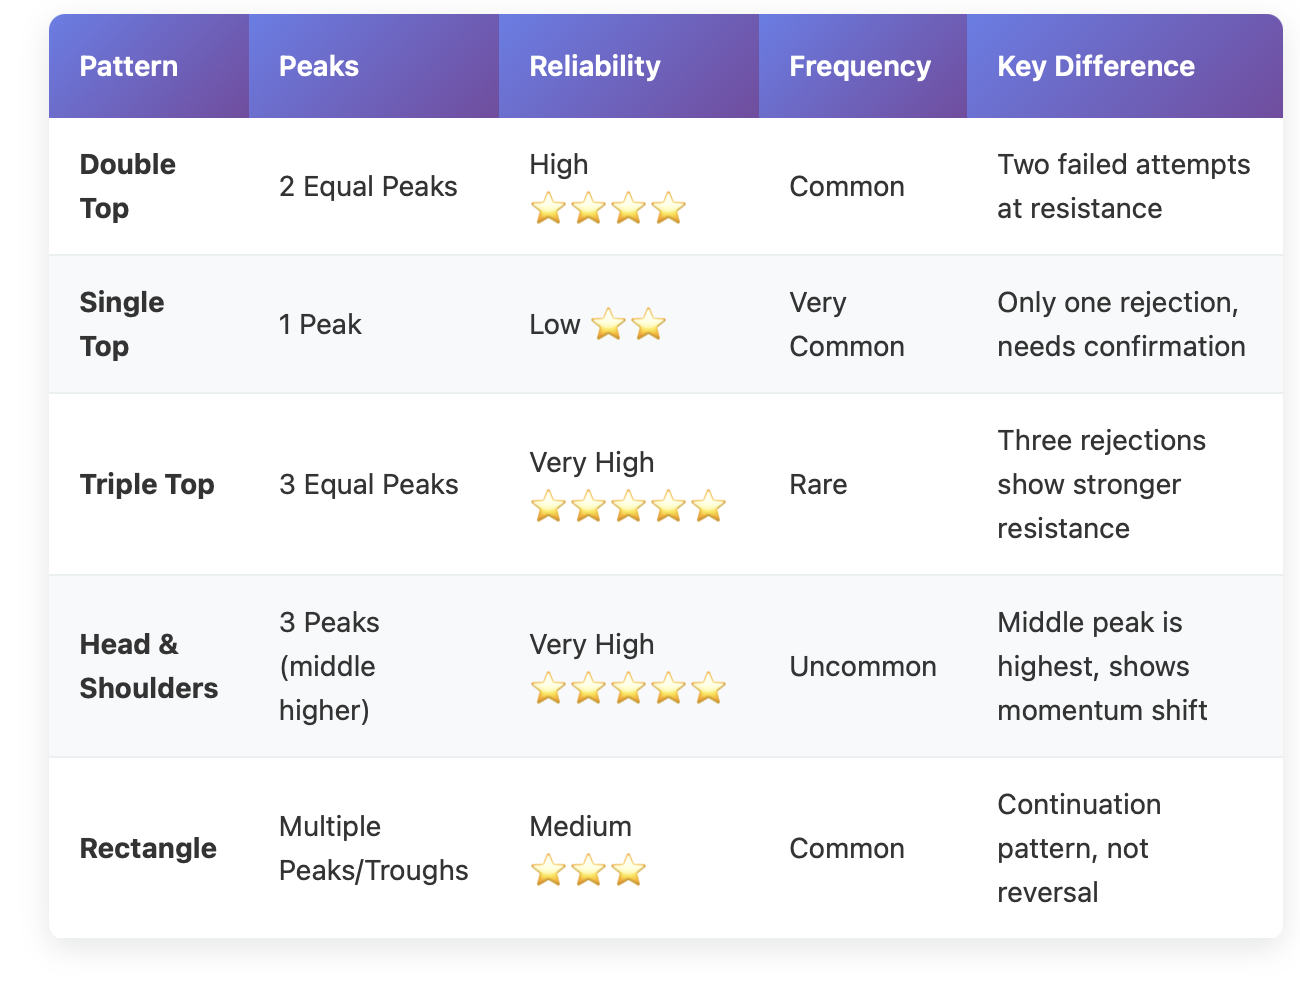
Double Top or Triple Top: The Triple Top goes a step further, instead of 2 peaks, 3 peaks at roughly the same price level. Just one step further than trying to break through only twice, 3 total failed attempts. Generally, they are a better signal of a reversal of trend than Double Tops, and are way less common than Double Tops as well. The third peak shows more conviction of buyers attempting to get through a particular price, then more conviction by the sellers rejecting them a third time. Often, after a triple top forms the downtrend will be that much stronger/actionable to short it down.
Double Top and Double Bottom Opposites of Each Other: Double Tops indicate bearish reversals at the end of an uptrend, while Double Bottoms indicate bullish reversals at the end of a downtrend.
The Double Bottom is two attempts by sellers to push the price lower from a support level, and fail, then buyers take over. The psychology is the same and just flipped upside down.
Double Tops and Head and Shoulders: Head and Shoulders do have three peaks, but the middle peak or “head” is higher than the first and last peaks, which are the “shoulders.” A Double Top features only two peaks that are roughly the same height.
Head and Shoulders are usually a little stronger than Double Tops as they indicate a more significant shift in momentum to the sell. The lower right shoulder is showing a decline in buying pressure.
Double Tops vs Rectangles: Rectangles indicate the price is bouncing between support and resistance multiple times, whereas the Double Top only consists of two peaks. Rectangles may consist of multiple peaks, however they are also a continuation pattern, rather than a reversal pattern like the Double Top.
The primary difference is that Double Tops indicate solid rejection at resistance on two occasions, whereas rectangles indicate that price respects both support and resistance over time. This knowledge will help ensure that you are not misreading the chart's action and not producing trades you did not want. Each indicates a different market story of psychology and potential next direction.
How To Trade A Double Top (or 'A Practical Trading Strategy')
Trading Double Tops requires an enormous level of patience, discipline, and risk management. The following approach is a step-by-step process that can be utilized in any market conditions.
Identify The Set Up: The first thing you must confirm is that you are identifying a valid Double Top. The two peaks should be evenly spaced and at a similar height (1% - 3% distance is good), there will be a significant valley between these peaks, and all of this should have evolved over several weeks or months (not hours and days) of price action.
Identify It on Higher Timeframes: A Double Top on one daily time frame is much more relevant than a Double Top on the 15 minute time frame. Once a Double Top is established on the daily time frame you can then apply your shorter time frame to defining the entry.
Wait for Confirmation: Most traders err here. You cannot just take the trade based on the second peak. You need a price to break down below the valley (neckline) to confirm the pattern. The breakdown tells you that sellers are taking priority over the buyers' support level. For example, in GBP/USD, you have two peaks at 1.3000 and 1.2980 with a valley at 1.2850.
You will wait for a price below 1.2850 before you enter a position to short it. If you jump in early, you could find yourself disappointed, as most patterns do fail. Entry Strategy After the neckline has broken, you will look to enter your short trade. Some traders enter on the break and others will wait for price to retest the broken neckline. Both methods work, but waiting for the neckline to kiss the broken line gives you a better risk/reward ratio.
If you trade on the break at 1.2845, you will place the stop loss above the second peak at roughly 1.3020. Whereas, if you get a retest back to 1.2850 and take the trade at 1.2840 instead of 1.2845, the stop loss is the same, but the entry is much stronger.
Stop Loss Placement In an ideal situation, you want to place your stop loss at typically 20-30 pips above the highest peak in the double top pattern. It gives you enough distance for normal market noise while also being protected if the pattern fails. If price breaks both peaks, we need to exit with urgency.
In our example with the GBP/USD, if we recognize these peaks are 1.3000 and 1.2980, we would want to place the stop loss at either 1.3020 or 1.3030.
This protects us if the breakout was fake and price continues pushing higher.
Take Profit Targets: The standard target is often derived from the height of the pattern subtracted from the neckline. For instance, if the peaks are at 1.3000 and the neckline is at 1.2850, this is a difference of 150 pips. Thus your target would be 1.2850 - 150 = 1.2700. Other alternatives could be to use previous support levels, Fibonacci retracements, or simply a 2:1 risk/reward ratio. For example, if you are risking 175 pips (your stop is at 1.3020 and your entry is at 1.2845), your target would be at least 350 pips.
Risk Management: Never risk more than 2%-3% of your entire account on a single trade, even for a highly probable trade idea like a Double Top. Again, position size is much more important than being correct in direction.
If you are considering scaling out of the position after your target, consider taking half of your profit at the first target, and then trail your stop loss on the continual position. This way you lock in gains yet still give it more room for larger profits as the downtrend develops.
Volume Confirmation : You want to pay attention to increasing volume on the breakdown on the Double Top. Higher volume typically means more conviction from sellers and increases the chance of follow through. Low volume breakdowns often reverse quickly.
For example, suppose EUR/USD sets up a Double Top with peaks at 1.1200 and 1.1180 and a valley at 1.1050. After the breakdown, you enter short at 1.1040, placing your stop loss at 1.1230 and your first target at 1.0890 (which is a 160-pip target based on the pattern height). This trade has a risk of 190-pips and a reward of at least 150 pips. So although the risk/reward isn’t perfect, the high probability of the setup justifies the trade (you can optimize your risk/reward further by waiting for a retest or using a tighter stop loss on the entry).
Understanding the Limitations and Risks of Shorting Double Tops
Double Tops aren't bulletproof. Like everything else in the technical world, reverting channels fail. Simply understanding the limitations of set-ups will prevent overconfidence when spotting a setup (which admittedly can be easy to do as traders).
False Breakouts and continuation signals are your biggest risk with Double Tops. Price breaks the neckline and triggers your short entry, then on a dime, reverses sharply higher (if not prepared, this is a "fake-out" that'll lead to excessive losses).
Expect false breakouts to be more frequent during choppy, sideways markets where there is indecision, while trading in breakouts can be volatile around major news events, when algos trading can induce sudden slight-moving moves, not corresponding to actual market sentiment.
To avoid false breakouts, wait for a clear break with good volume, not just a few pips below the neckline. Some traders require a 1-2% break to filter out noise. Others wait for a daily close below the support level.
Market Context Matters Double Tops work best at the end of strong uptrends when buyers are genuinely exhausted. In sideways markets or weak trends, these patterns are less reliable because there wasn't much buying conviction to begin with.
Consider the bigger picture before trading a Double Top. What is the overarching trend on higher timeframes? Up or down? Are you in a clear support or resistance area? Is there any news to come out shortly that could change market dynamics?
Time Decay A Double Top that takes a longer timeframe to play out is becoming less reliable. If the first peak to breakdown takes any months to occur, you can assume the market has possibly changed drastically. What was a reversal pattern is simply just market behavior.
New patterns (completed within 4-8 weeks) are going to have more weight than older. If you are looking at a Double Top pattern that has been developing for the last 6 months, you should be questioning the reliability of that pattern.
Volume Divergence Ideally, you would like to see that the second peak has a decrease in volume from the first peak. This provides evidence of less interest from buyers in lifting price. If the second peak advances with a higher volume than the first, it implies that buyers are still committed which makes the pattern much more likely to fail.
Similarly, the breakdown should ideally be accompanied by an increase in volume, confirming selling pressure. A breakdown on lower volume is likely going to false signal.
Confirmation Bias: Many traders start to see Double Tops everywhere they look after they have learned about them first. However, just because they see two peaks doesn't mean they are a Double Top pattern that is significant and valid. Pay attention to the two peaks being significant higher highs, there should be ample space between the two peaks, and the pattern should be confirmed by a breakdown.
It is vital that you do not go on an observational frenzy forcing Double Tops onto charts. Let the charts develop as they will, and only trade off clear textbook examples. You will conclude your day compromising your profits (or capitulating losses) into marginal examples.
Risk Management is Key: Although this pattern may be easy to identify, it is not always effective. This is why risk management is more important than pattern identification. Use stop losses, position size, and diversification to manage your capital. Never bet the entire farm on any single pattern or trade because as a trader you must realize that successful trading is predicated on the consistency of your strategy not the home run individual set up.
Example of Failure: Although Bitcoin may be trading in what looks like a potential Double Top, it can break high and continue trending up. The cryptocurrency behaves erratically, the fact that it is trading is open 24 hours and has stronger levels of volatility means traditional analysis rules do not apply. I am not saying that you cannot find Double Tops in crypto, but you will quickly learn that you need additional confirmations and risk management regardless of how perfect the patterns look.
Conclusion & Moving from Knowledge to Action
Double Tops are powerful reversal patterns that can help identify high probability trade opportunities. They offer examples of clear market psychology - buyers attempt to push the market higher twice at the same key level of resistance resulting in the possibility of a large downtrend.
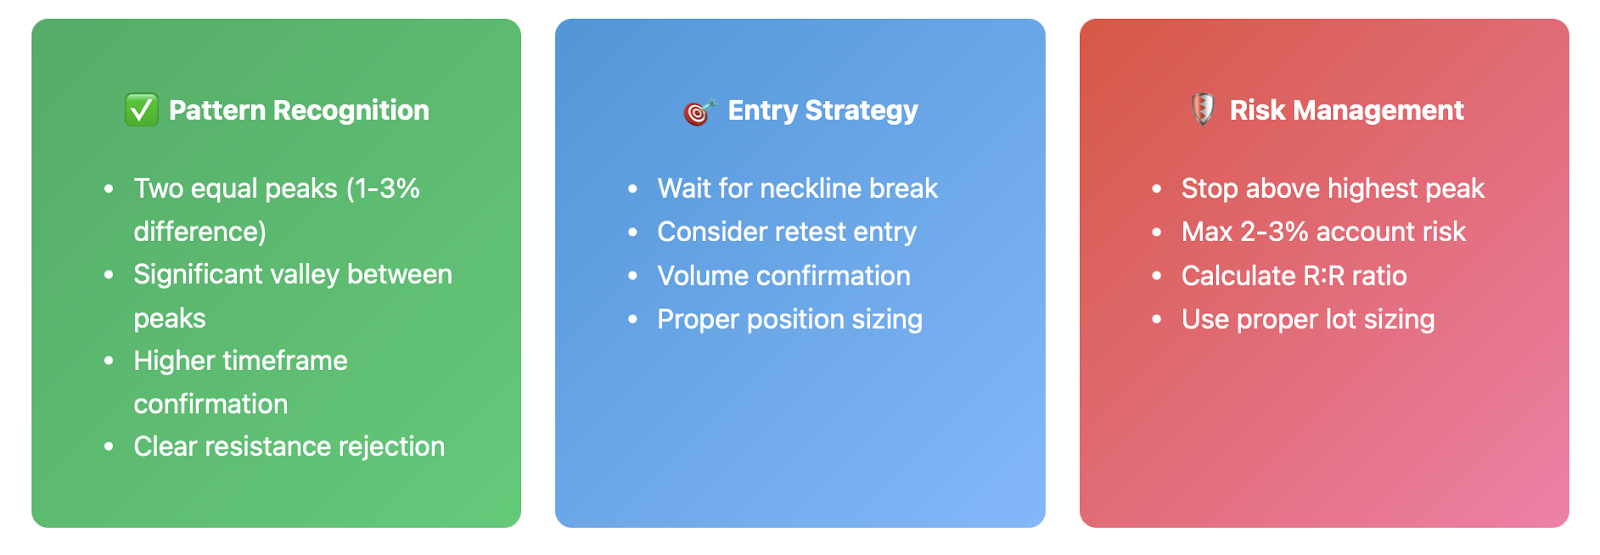
As a reminder, when identifying and trading a Double Top look for two peaks at similar price levels, a key valley with a waterfall-like decline in price, and confirmation of the trade has occurred had a breakdown of the price below the neckline of the Double Top pattern.
Do not rush into a trade just based on the pattern. First, be sure there is confirmation of the pattern and execute trades using proper money management techniques.
It is best to see Double Tops form after an impulsive uptrend on a higher timeframe. Double Tops can occur in all markets and timeframes; the higher timeframes, specifically daily and weekly patterns, signifies the opportunity carries more weight. Double Tops can also be accompanied by using an extra technical tool such as volume, candlestick patterns, and momentum indicators involving money management can lead to greater success.
Lastly, know that no pattern works 100% of the time. There are false breaks, the markets can change direction unexpectedly, and the perfect setup can fail. This is why position sizing and risk management becomes more important than being right about any particular trade.
Are You Ready to Learn More Trading Patterns?
Double Tops are a small piece in the puzzle of technical analysis. At Tradewill, we have a full forex education program ranging from basic chart patterns, and products to advanced trading techniques.
You can follow in the footsteps of thousands of traders by using our free resources, full course guides, and even real trading examples from our team of professional traders. Our materials will allow you to improve your trading method, whether you are a beginner or you have a firm knowledge of forex.
Disclaimer: The content of the blog does not represent any position of Trade W, does not serve as any trading-related decision advice, and does not endorse any third-party.