

 Trade W
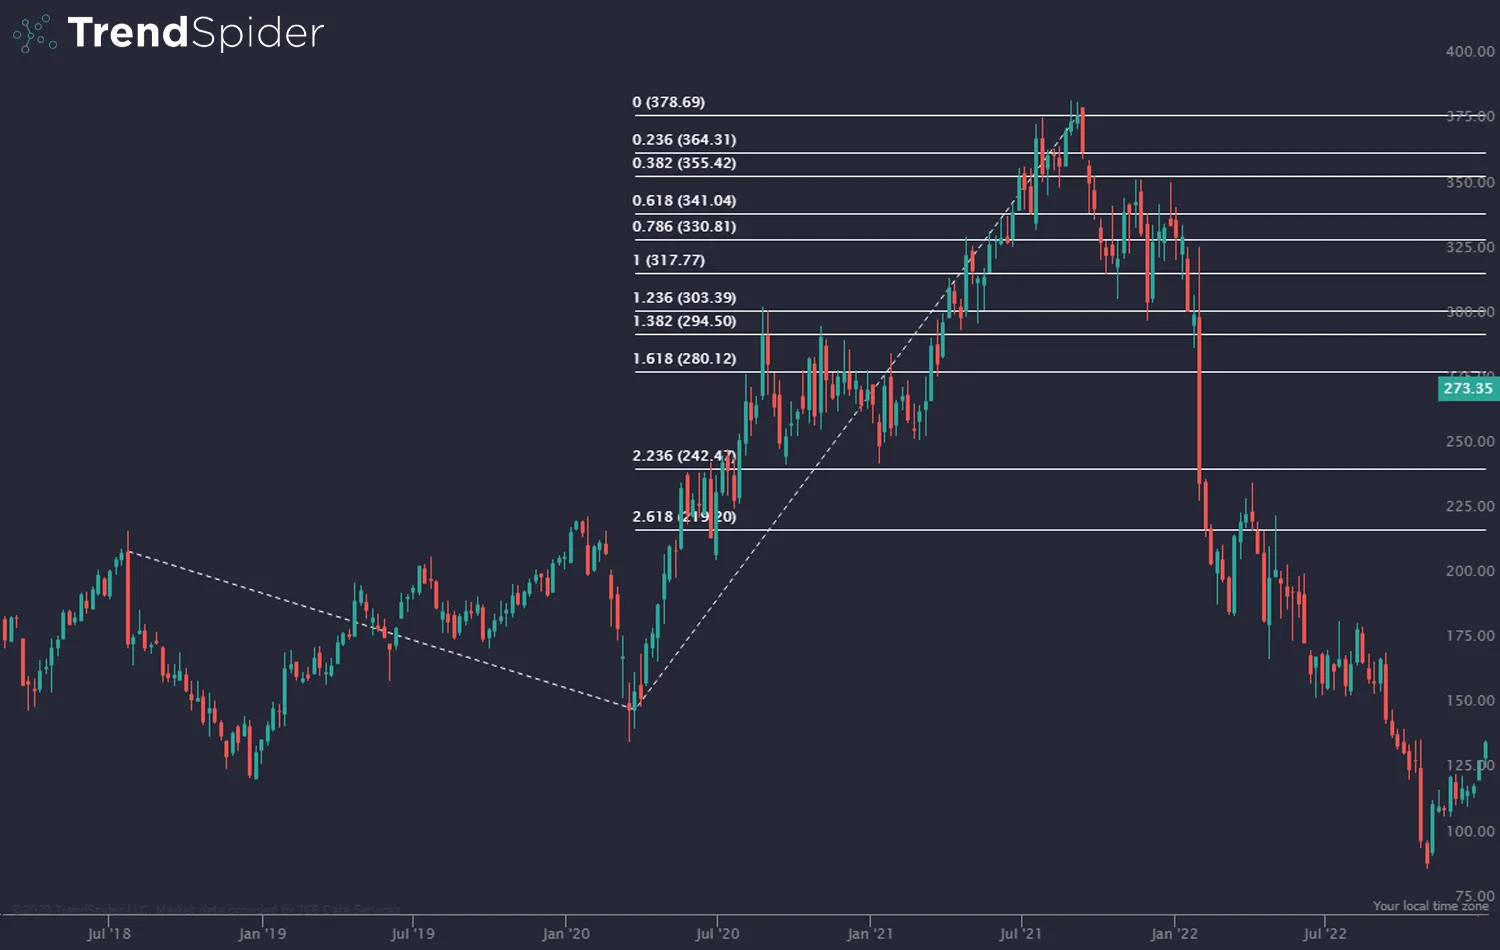
Have you ever stood in front of a price chart wondering why the price would appear to hit pause, or worse, reverse at a certain level? The action may have appeared random, and all of a sudden, the market hits a wall, an invisible wall or finds support exactly where you least expected it to. There is no magic in price action. More often than not, Fibonacci extension, or extension, is to blame.
Fibonacci extension is one of the most powerful and yet least used tools in technical analysis. Many traders are concerned with retracement levels in finding entry levels. Extensions can give you a little bit of help predicting where trends may actually end. Think of it as your crystal ball for price targets - but instead of divining what will happen next based on vague hunches, you are relying on an exact number pinpointed by mathematics.
We at Tradewill.com have seen countless traders change their approach to trading when they finally get a handle on this tool. Whether you are a pro simply looking for a way to support picking your targets or a beginner trying to understand why certain levels are significant, this is your guide to learning everything you need to know about Fibonacci extensions in forex trading.
Fibonacci extensions are beautiful because they can be used universally. From the EUR/USD finding the perfect 161.8% for a take-profit to crypto traders using these ratios in greater volatility, you can see how they are always at play. However, extensions are like any other powerful tool. They need to be understood and used correctly to be used effectively.
What is Fibonacci Extension?
Fibonacci extension is a technical analysis tool used to estimate price targets beyond the actual trend, using the ratios of the Fibonacci sequence. As you can see, while retracements indicate potential reversal points within a range, extensions estimate where the trend (up or down) may ultimately wind up.
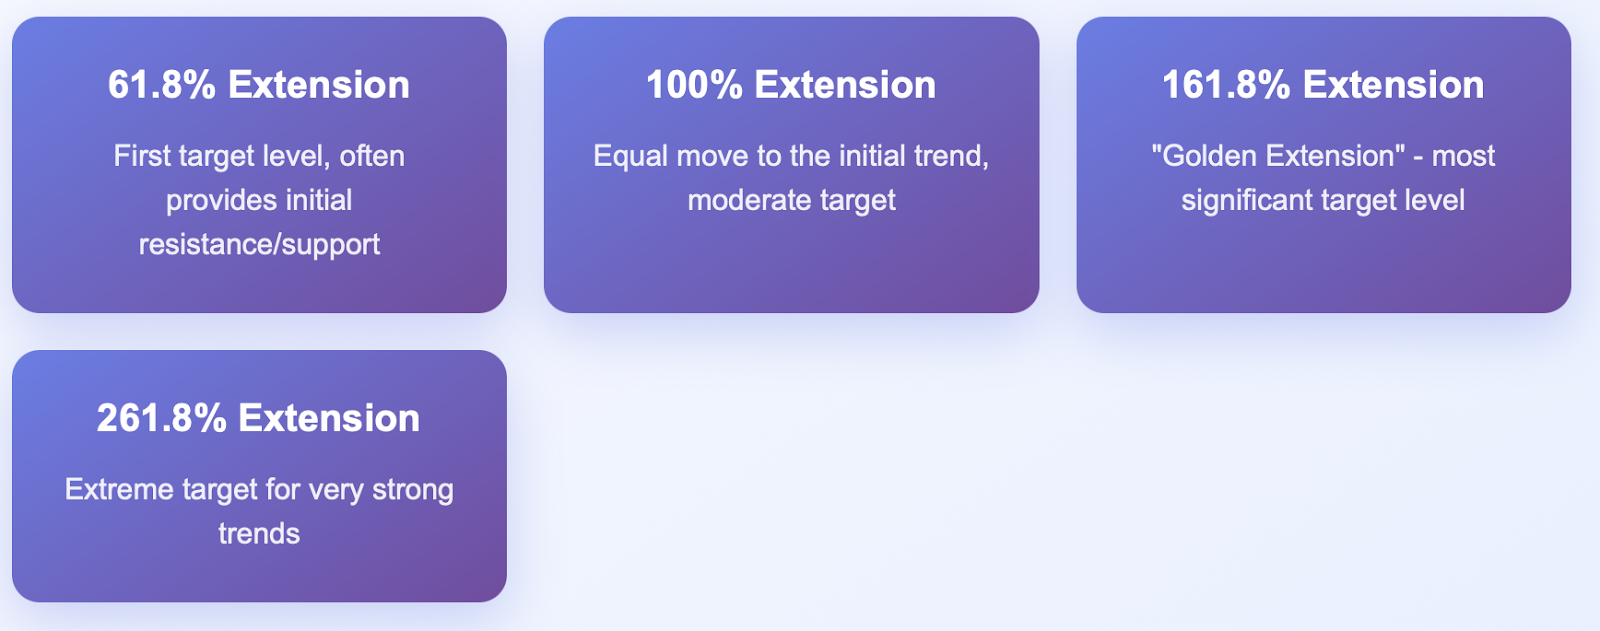
The ratios you will be dealing with are 61.8%, 100%, 161.8% and 261.8%. These are all calculated numbers based on the Fibonacci sequence; however, they represent levels at which the price may experience significant price support or resistance. The 161.8% extension has especially received mythical status among traders, as the 'golden extension'.
To draw Fibonacci Extensions, you need three things: a swing low, a swing high, and a retracement low (in an uptrend). Once the tool has the values, it shows where the mathematical relationship will project, where the next wave might end. Think of it as a map of where you are and where you are going or likely going as you follow the path.
As a reference, suppose EUR/USD climbed from 1.0500 to 1.0800 and retraced to 1.0650. If you then drew a Fibonacci extension from 1.0500 to 1.0800 to 1.0650, the extension may show a projected target at 1.0850 (61.8% extension), 1.0950 (100% extension), 1.1130 (161.8% extension), etc. You would then have your possible take profit zones.
The reason the extensions work is that thousands of traders around the world are also seeing those levels. When price approaches a major extension level, it triggers a self-fulfilling prophecy as traders close their positions (take profits) or open new ones based on the anticipated reaction.
To contextualise this, think about estimating the height of a folded paper aeroplane when you throw it. The height will be determined by physics, gravity, centre of gravity, kinetic energy (when thrown), and its flight path. In the market, the same could be said for price movement as influenced by psychological factors and its mathematical relationship to create patterns over time. Extensions give you the formula to estimate the invisible target zones.
Extensions perform best when there is a strong and clear market trend. They lose most of their predictive value in a choppy, sideways market. Extensions are a valuable tool when there is a trend move happening that is sustained and price has already established a directional bias.
Famous Fibonacci Sequence
The Fibonacci sequence has origins from mathematician Leonardo Fibonacci, who lived in Italy during the 1300s, although the mathematical relationships appear in nature (e.g., the petals of a flower, the spirals of a galaxy). The sequence has developed a famous golden ratio (1.618) that provides proportions that the human psyche desires and considers significant.
So, why do financial markets pay tribute to Fibonacci ratios? The answers lie in collective human behaviour and market psychology. All over the world, thousands of traders use Fibonacci tools, leading to zones of concentrated buying or selling. When enough participants act at similar mathematical levels, they become real support or resistance zones.
There is naturally a wave-like movement in the market where price moves up, then down, back and forth, but ultimately, there becomes a price where each wave begins and ends. Just as ocean waves have a mathematical relationship between the crest and trough, it is the same with the price waves and is often identified by the Fibonacci proportions. This is not mystical; it is crowd psychology or behaviour working itself out in patterns we can recognise.
Using historical analysis on large currency pairs, it is evident that Fibonacci extension levels have given remarkable examples of accuracy. The major trend of the EUR/USD currency pair from 2008-2023 had numerous occurrences where substantial tops and bottoms occurred at specific points of extension. These are not simply coincidental events, but repeatedly happening occurrences that demonstrate the effectiveness of how you are using the tool.
Think about how a building or monument like the Parthenon uses proportions defined by the golden ratio to create aesthetic harmony; the market displays a similar harmony in its Fibonacci relationships. Overall price movement occurs in mathematically rationalised sequences, and Fibonacci levels allow the trader to understand this context when interpreting these levels and why they carry weight as implied levels of interest in trader psychology.
Additionally, the power of Fibonacci levels is self-reinforcing in nature. More and more traders begin to acknowledge and act on these levels, and naturally, they become more significant levels for all involved within the marketplace. Fibonacci levels create a feedback loop where the theory of math becomes the reality of the market due to the collective participation of traders.
How to Use Fibonacci Extension in Forex
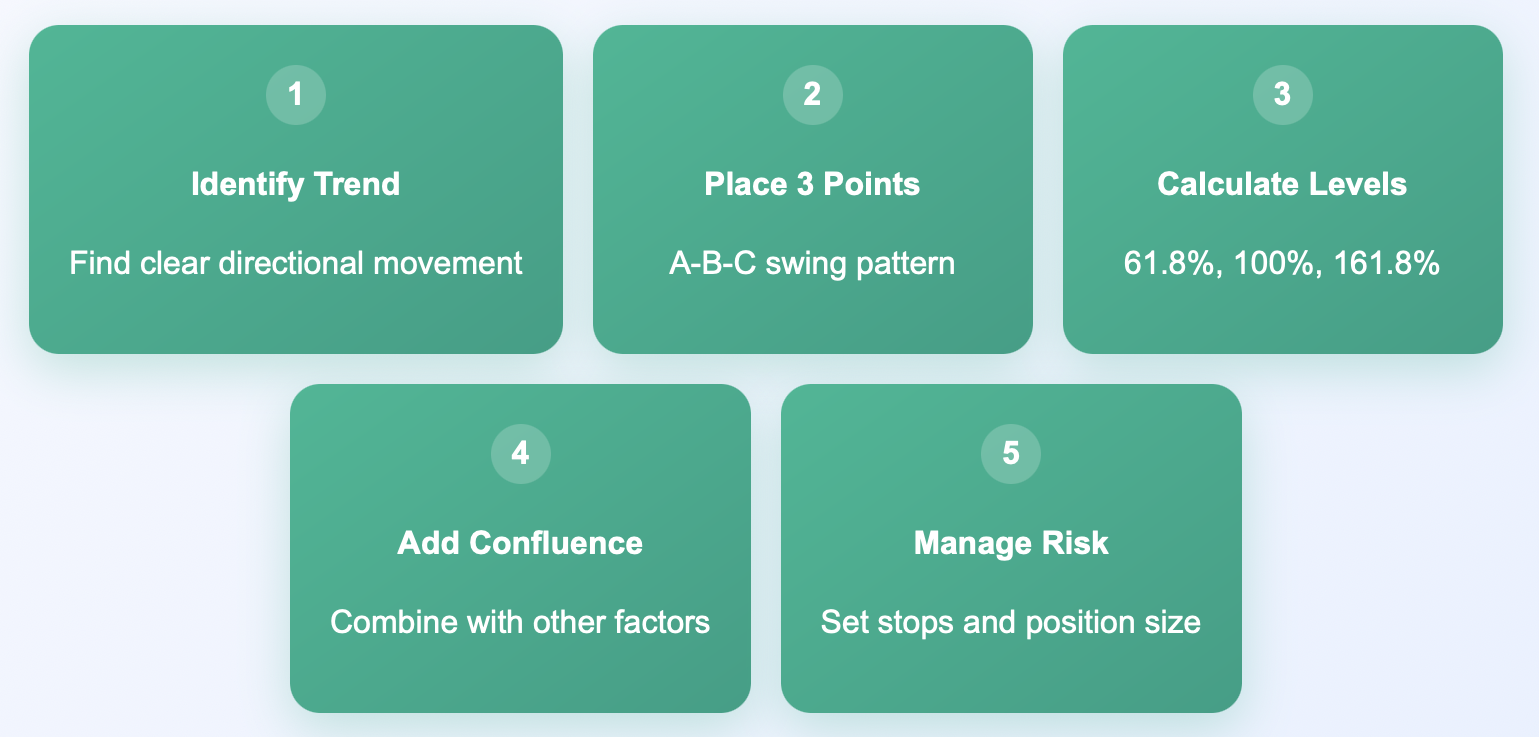
Using Fibonacci extensions in the forex market follows a systematic planning process; it all begins with the identification of a proper trend. It is impossible to forecast probable targets meaningfully unless there is a clear directional bias in the market.
Step 1: Identify Key Trend Swings
The first step is to locate significant swing highs and lows on the chart. These swings should be meaningful, not minor swings. In an uptrend, we would be looking for a significant low followed by a significant high, followed by a significant retracement. The timeframe matters. What constitutes a "major" swing on a 1-hour chart is incredibly different from what constitutes a "major" swing on a daily chart.
Step 2: Place Your Three Points
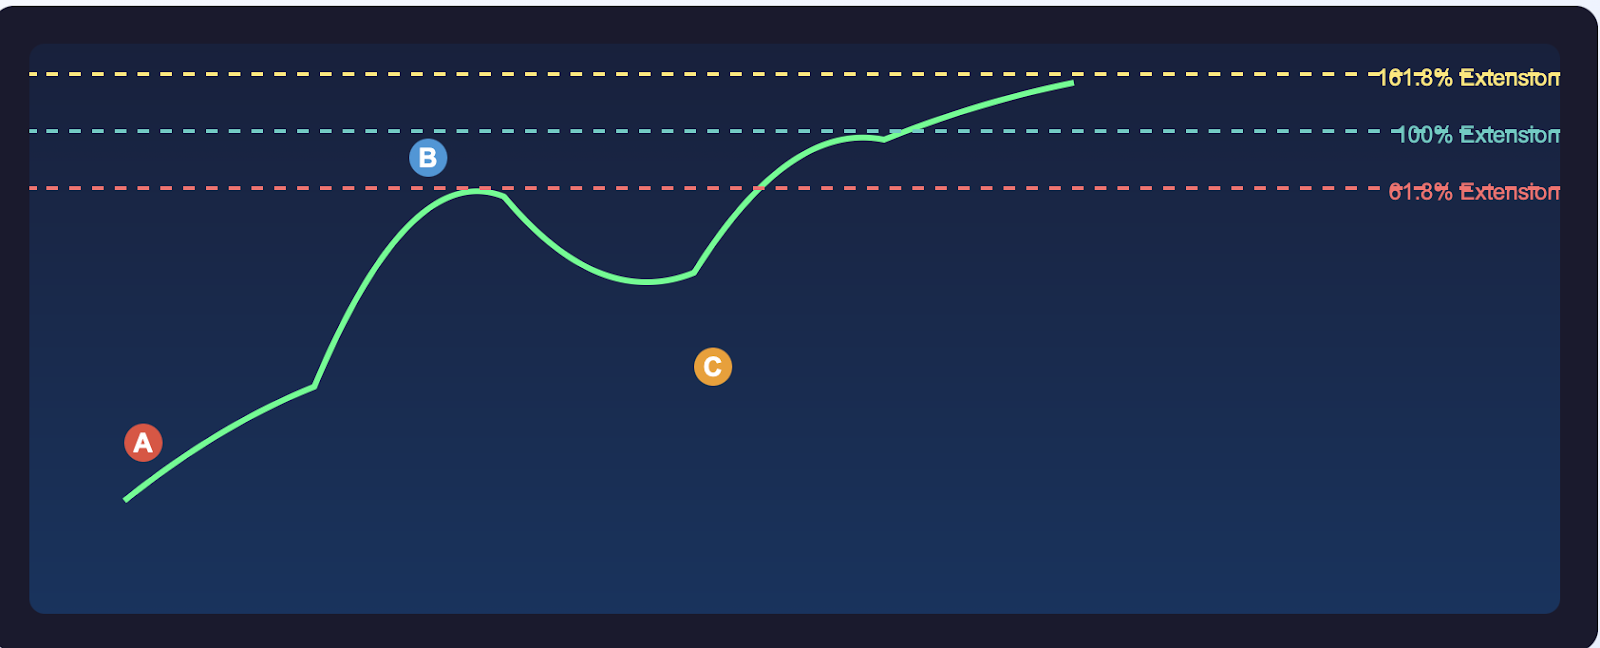
For an uptrend extension, we want to place our first point at the swing low (point A), place a second point at the subsequent swing high (point B) and then finally a third point at the retracement low (point C). That gives us a pattern of ABC, which will allow us to use the tool to project extensions. The tool will determine where the next wave (which is referenced to point C) may end.
Step 3: Identify Important Extension levels.
For the primary extension levels, we will be looking at mostly the 61.8%, 100% and 161.8% extension levels. The 261.8% extension level is good to note for extreme strength, but our first three levels are the most reliable targets. Many charts will auto-calculate these extension levels for you when you plot 3 points.
Step 4: Combine with Confirmation Variables
Never rely solely on Fibonacci extensions! You need to combine them with other technical factors, such as previous support/resistance levels, round numbers, and trendline confluences. The more factors that are at the same price level together, the more reliable your target becomes.
Let's look at an example with EUR/USD. You have found your ABC pattern and found the 161.8% extension to put a target at 1.1250. You can also see that this level coincides with a previous resistance area, and it's just above the psychological 1.1200 level. With these factors together, it gives you more confidence in your target.
Step 5: Define Your Risk Parameters
Before you jump into the market based on the extension target, you first need to define your stop-loss and position sizing. A common rule of thumb is to place your stops below the retracement low (point C), and to use position sizes to ensure you are only risking 1-2% of your account on each trade.
You can think of this process as predicting where a basketball will land when executed after a certain shooting motion. You engage the shooter's stance (trend identification), the shot the ball takes (swing points), and the characteristics of the arc (extension calculations) to predict where the ball will land (price targets) in reference to the rim or net.
Extensions are particularly effective in trend-following strategies where you enter during retracements and target extension levels for profit. This is a meaningful trading method that makes full use of the natural wave motion of the market while providing a mathematical aspect to selecting your target.
Comparison With Other Technical Analysis Tools
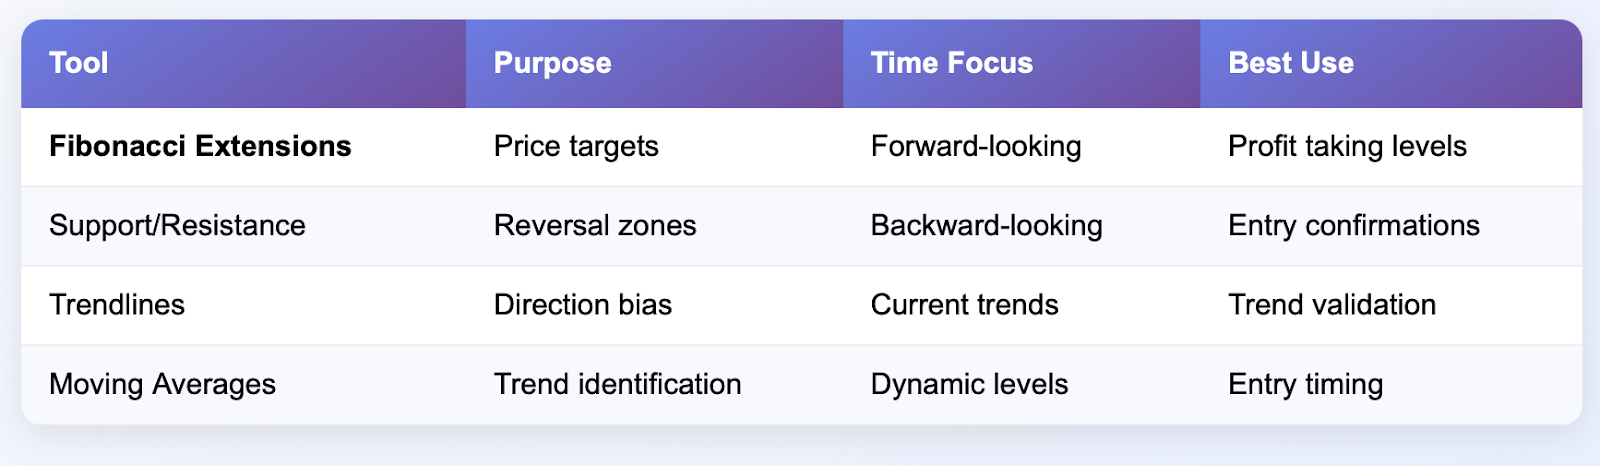
Fibonacci extensions occupy a specific area in the technical analysis toolbox. They provide complementary capabilities to other popular modalities but are not duplicative. Knowing how extensions differ from the other tools allows you to use each tool correctly.
Support and Resistance versus Extensions
Support and resistance levels signify where the price has reverted in the past. Extensions indicate where the price will revert down the road. Support/resistance is "backwards looking" and reactive, whereas extensions are "forward looking" and predictive in nature. An experienced trader will be using both tools at the same time. They will use support and resistance as a 'confirmation' of decision making, and where extensions will be the basis for a 'target' price.
Trendlines versus Extensions
Trendline behaviour provides directional bias and possible breaking points, but does not provide a price target. Extensions provide price targets at specific numerical levels that trendlines cannot provide. Trendlines will provide you with confirmation for direction, and extensions will provide specific exit criteria when the break of the trendline occurs at the same time it reaches the extension price.
Moving Averages vs. Extensions
Moving averages are good for identifying the trend and dynamic support and resistance, but they are not great for setting objectives. Extensions, on the other hand, can be used alongside moving average strategies to put valid profit-taking levels in place when trends are running out of steam.
The real magic spells when you combine them in a real strategy. Imagine this EUR/USD trade: the price breaks through a downward trendline, finds support on a 50-period moving average, and targets the 161.8% extension of the Fibonacci. You see, all the tools are telling you something different: the trendline tells you when the trend has changed, the moving average tells you the timing of the entry, and the extension gives you the objective of the trade.
The advantages of extensions:
-
Give clear numerical targets
-
Work on all timeframes
-
Based on mathematical relationships
-
A self-fulfilling prophecy based on widespread use
The disadvantages:
-
Not great at ranging markets
-
Require significant trend identification
-
Not ever taken in isolation
-
Potential for false signals in high-performance situations
The key takeaway is that it’s not about one tool to tell you everything about the market. Extensions are very good at projecting targets, but need good support in trend-identifying tools, and tools that provide a timing of when to enter the market, to develop a full trading strategy.
Cross-market Applications
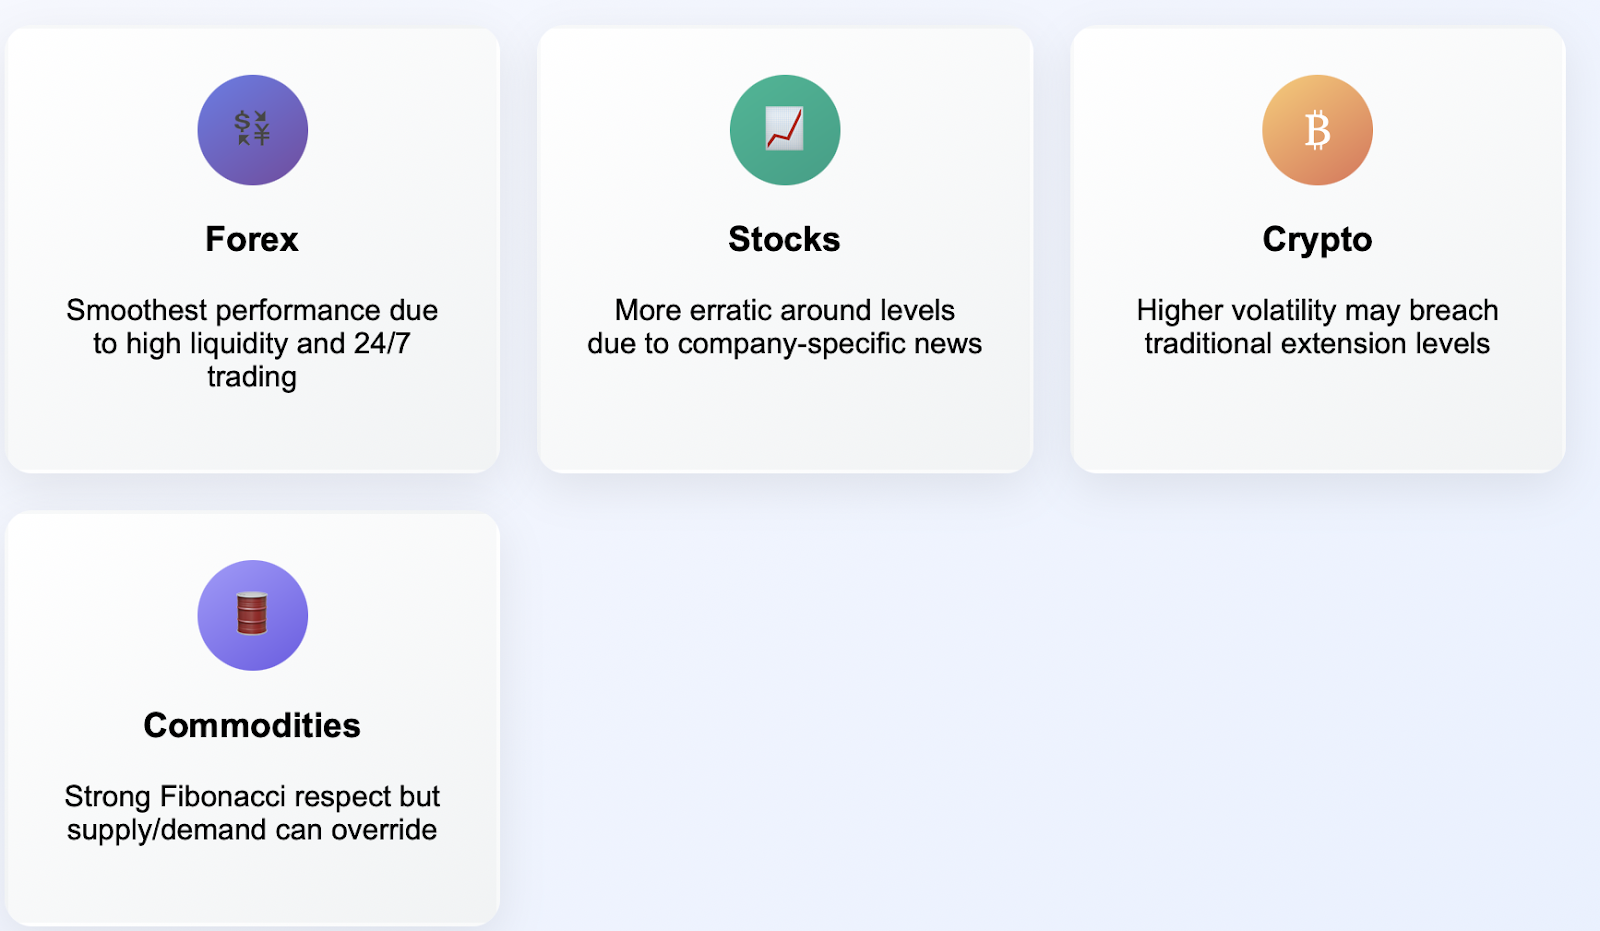
Fibonacci extensions are more universal than forex. They can be applied to stocks, commodities, cryptocurrencies, and CFDs (contracts for difference). The mathematical relationships don't change, but each market will influence how the extensions work in practice.
Forex Applications
Currency pairs generally provide the smoothest performance when it comes to extensions, partly due to the liquidity available and partly due to the reduced risk of gaps in the price action. Major pairs (EUR/USD, GBP/USD and USD/JPY) seem to respect Fibonacci extension levels the most consistently. Forex markets operate around the clock, so no pricing gaps will obstruct the development of the structure surrounding the extensions.
Differences in the Stock Market
Stock prices may demonstrate much more erratic movement around extension levels due to company-specific news and more players involved in price action, facilitating lower liquidity and fewer buyers or sellers at reasonable prices. That said, major stock indices (The Dow, The S&P 500, The NASDAQ) behave beautifully and prick along Fibonacci levels. The S&P 500 and NASDAQ have provided countless examples of textbook extensions throughout the major bull and bear ski runs.
Cryptocurrency Considerations
Cryptocurrency markets differ from currencies, stocks and commodities. Bitcoin's price action can result in accelerated extreme moves, relying on investor action, even for bitcoin itself, and can breach what are considered traditional extension levels. The alt coins typically perform closer to traditional extension levels since they have additional price action motion affected by algorithm trading. In the highly speculative environment of crypto, 261.8% and 423.6% extensions become more relevant.
Commodity Considerations
As you know, commodities such as oil and gold show Fibonacci ratios through major moves in a strong way. The supply and demand dynamics of the underlying commodity can also dramatically override Fibonacci levels with more force than in the currency market. A trader's extension strategies work best when technical and fundamental reasons coincide.
Let's look at a practical example. In the bull run for Bitcoin from 2020-2021, I observed the 161.8% extension off the March 2020 lows point towards targets that the price hit with astonishing precision! In the meantime, EUR/USD extensions hit during the same time frame were modest but similarly useful targets.
The big difference between the commodities and currency markets relates to volatility and market structure. The higher volatility in the commodities markets may mean you require larger stop-loss levels and adjust your position sizing when trading off extension levels. The lower volatility in the currency markets might mean that the price may consolidate around that extension level for a longer period of time before moving back in a directional move.
Similar understandings across markets should allow you to modify your extension-based strategies to different market environments while maintaining the same mathematical principles that give the tool its distinction.
Psychology and Risk Management
Trading Fibonacci extensions can be very easy to do without properly managing risk, just like driving a sports car without seatbelts. For as many opportunities these levels offer, there are equally as many psychological traps that traders will have to navigate around.

Market Psychology and the Extension Level
The essence of Fibonacci levels is group trader behaviour. The more traders who have expectations of reactions at noted levels, the more likely those traders will create situations where reactions occur as the cycle continues to self-reinforce. During sessions where market participation is exceptionally high, extensions are especially good.
Traders even go so far as to put take profits around major extension points, which act as another natural level of resistance. The extension levels take on more significance as anticipation and volume build around them. Once the interest peaks, it converts the math into a true market force.
Essential Risk Management Principles
Position sizing will be very important when trading the extensions. Only risk 1-2% of your account per trade, regardless of how "perfect" the trade looks! Extension levels are target areas, but nothing is for certain in the markets, and quickly changing or unusual markets can throw a wrench in everyone's expedition as well.
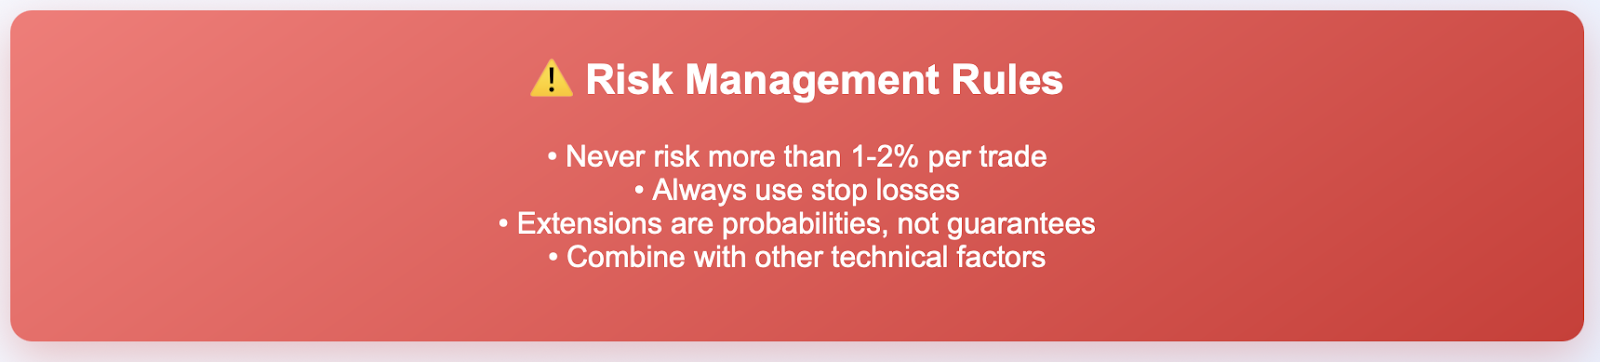
Stop-loss placement also requires some thought. When targeting upside extensions, a majority of traders will place a stop below the last retracement low (which also represents point C in the ABC Pattern). This type of logical stop provides a definitive area of invalidation and still allows for reasonably normal market behaviour to occur.
Managing Your Expectations
Extensions provide possible targets rather than guaranteed profits. Prices may reach an extension and continue moving in that same direction, or they may turn back before reaching an extension. With few exceptions, successful traders use extensions to assess aspects of probability rather than as a defined point of reversal.
Consider the idea of taking partial profits. Perhaps take some profits at the first extension level (61.8%) and hold the remaining positions in hopes of hitting a higher target. This allows you to lock in profitability while still having exposure to the upside.
Psychological Traps to Avoid
Do not become overly attached to extension targets. If conditions change, or if a great signal appears that is contrary to your projected targets, you had better know when it is time to pull the plug well before you get to those projected levels. Flexibility is better than stubbornness.
The common mistake of making a Fibonacci pattern where there isn't one is common. Out there, the price does not create valid extension opportunities. Wait for clear, well-defined ABC patterns in place instead of forcing Fibonacci logic onto choppy price action or any other unclear price action.
In essence, extensions can be thought of as being similar to forecasting the weather. They provide some value to traders, as well as cognitive guidance in sometimes overconfident decisions. In trading, use the extensions in a probabilistic measurement instead of certainty.
Meteorologists deal in probabilities, not certainty, which is why they are not stating that it will be sunny, but rather there is a 40% chance of sunshine and a 60% chance of rain. If traders find extensions justifiable, they can look at the extension area as a probability-weighted price target as opposed to a straight line basis, based on mathematical relationships and the trading psychology of market participants.
Advanced Techniques
Professional traders have sophisticated extension methods that take the basic extension processes mentioned above much further. The idea of advanced extension methods can be straightforward to use; however, it typically requires experience and a comprehensive understanding of the markets.
Multi-timeframe extension analysis
The best extension set-ups happen at multiple time frames. Initiate the process using higher time frames (e.g., daily or weekly) to find extension areas and then drop down to a lower time frame for target entry (e.g., 1-4 hour charts). The performance of extensions will increase where 4-hour extensions occur at the same time as daily extensions, especially where the hourly extension equates to a daily extension target.
For example, EUR/USD might provide an extension target in the daily chart at 1.1300, and the 4 hour chart might provide a target at 1.1295. When we find multiple time frame trading goals, it helps to develop a better probability target zone than depending on only one time frame calculation.
Multiple Extension Clusters
Traders who are consistently successful at profiting in the market will plot extensions from many different swing patterns at the same time. If you see multiple extension calculations that are providing similar price ranges, then those become the targeting area to look for a trade. Using this technique involves finding three or more valid ABC patterns at the same time as the overall price action trend is valid.
Extension-Retracement combinations
Professional traders usually combine extensions and retracement levels from different time periods. A common strategy will be projecting the 161.8% extension from one swing pattern as a target, while also monitoring the 61.8% retracement from a higher time frame swing pattern as a potential reversal zone.
Wave Counting Application
Elliott Wave practitioners also use Fibonacci extensions to determine where the projected wave targets will be. We have learned that Wave 3 targets often go out to extending to 161.8% of Wave 1, while Wave 5 often extends just slightly to 61.8% or the 100% extension of the last swing. The use of extensions provides not only directional bias but specific targets to achieve while trading the waves.
Dynamic Extension Levels
Of course, the market shifts, and with that, the levels of your extensions will shift to reflect that change. Advanced traders will constantly adjust their extension calculations, as new swing highs and swing lows develop. Being dynamic and relevant, with your extensions,, utilizes the current market structure rather than using something that was more of a historical reference.
Risk-Adjusted Position Scaling
Advanced traders vary position sizes as a function of the extension levels’ confluence. When many calculating methods point to the same target area, they often will increase their position size (while controlling risk) and reduce their position when there is no confluence or ambiguity around the extension levels.
Advanced examples would be around the price of the EUR/USD right now. The daily extension levels all target 1.1400, the 4-hour extension levels target 1.1395, and there is a previous resistance level in the price of 1.1390. This area has 3 points of confluence with Fibonacci Tools would become a high conviction target of focus - again, they may even double their position size if they cover their overall risk.
Extension Breakout Trade Techniques
Once price action breaks well beyond an important extension level, it usually indicates continuation towards the next Fibonacci level. Advanced traders will use extension breakouts as a signal to enter a trade for the extended move to the next level in the mathematical sequence.
Like all advanced techniques, they require a level of dedication to practice and an extensive level of observation of the market behaviour. Start by observing extension levels with an emphasis on basic extension identification, and then slowly add more advanced techniques as you gain more experience and confidence.
Conclusion
Fibonacci Extensions are much more than math curiosities - they are tools that change the way you think about trade management and target selection. They reshape the way you understand why prices stop at seemingly random levels, or why certain levels appear suitable for logical profit-taking zones. The extensions provide a mathematical structure that adds precision to trading the art of now.
The main takeaways from this discussion include appropriate usage and realistic expectations. Extensions are most effective when used in conjunction with other technical analysis tools, used in trending price environments, and engaged in consistent risk management techniques. Extensions provide viable projections based on probabilities, not certainties.
Be patient and disciplined when trading extensions. Allow a clear ABC pattern to develop instead of trying to force Fibonacci relationships onto vague price action. The use of multiple timeframes will help provide more accurate projections, and you should always be utilising proper position sizing regardless of how good the setup appears to be.
The psychology part cannot be understated: extensions work precisely because millions of traders observe them, and when a substantial group pays attention to the state of Fibonacci relationships across various timeframes, those relationships have a self-fulfilling nature that brings mathematical projections into the real market. Understanding this dynamic allows you to appreciate the true competence of these tools--along with their limitations.
In reviewing our cross-market applications, it is evident that Fibonacci extensions are flexible, but each market requires specific attention. Forex markets typically demonstrate the smoothest extension execution while seeing more extreme extension levels when trading in the crypto space, which may require closer attention to higher Fibonacci extension levels due to volatility.
Complex strategies, such as multi-timeframe analysis and developing extension clumping, can help you achieve optimal execution, but always start from the foundational concepts. Begin with extensions on a single timeframe and develop a consistent habit with risk management before exploring extensions or more complex concepts.
Whatever stage a trader is at, it takes commitment, application, and practice with continued education to reach proficiency status while trading with extensions. Weak market conditions change every minute, and it is your responsibility as a trader to adapt to the market's evolving state. Therefore, you need to be adaptable, have manageable expectations, practice risk management, and never risk more than you can afford to lose.
Are you ready to go out and practice everything you have learned? Go to Tradewill.com and log in to a demo account with low spreads and practice trading Fibonacci extensions!\. Go out and look for and trade well-defined ABC patterns, try your luck with several time frame combinations, and develop your own method for extension-based trading.
The markets are ready to see your approaches towards predicting price targets using your refined techniques. Use Fibonacci extensions wisely, and they can become a very valuable tool in your trading arsenal.
Disclaimer: The content of the blog does not represent any position of Trade W, does not serve as any trading-related decision advice, and does not endorse any third-party.