

 Trade W

Introduction
Did you ever notice that sometimes the prices of currencies appear trapped, like they are stuck in neutral? This is called a flat market or sideways market, which is defined by prices trading within a limited range with no identifiable trend emerging.
Here's an example: You're watching EUR/USD. It has traded between 1.1000 and 1.1020 for the past five days, going back and forth like a tennis ball bouncing between two walls. That, my friends, is a flat market.
To better illustrate this for beginners, think of a student whose scores in exams continue to fall from the 70-75 point range. With every exam, the student's scores remain in the range of 70-75 points. The student's exam performance is similar to currency pairs in flat markets, in that the performance range can be predictable.
Understanding flat markets is important for forex traders because flat market conditions occur more frequently than one realizes. Learning how to identify flat market conditions and how to trade them will prepare you to take advantage of these, as some would consider, "boring" market conditions, and avoid the traps that inexperienced traders often fall into.
This in-depth guide will cover everything from definitions to trading strategies - we'll use professional forex examples as well as analogies for beginners so the reader can connect with the material on some level.
What is a Flat Market / Definition of Flat Market
The term flat market is also often referred to as a sideways market or even trading range, which occurs when price remains focused within a certain range (between support and resistance levels) without making any significant new highs or lows. In contrast with a trending market, which has observable movement in a (upward or downward) direction, a flat market means the price doesn't move to a point of either reaching or placing a significant high or low; instead, we see horizontal price action with little or no volatility.
Things to look for in a flat market:
-
Price Action: Price is bouncing around between two well defined levels - support (the floor) and resistance (the ceiling). In fact, each time it approaches one of these two defined levels, the price/movement quickly reverses direction.
-
Volume: Trading volume is typically much less than in any trending phase - less trading interest/participation.
-
Technical indicators: A few indicators can help define market flatness, such as:
-
ADX - Average Directional Index: a value below 20-25 usually means weak trend or no trend
-
Bollinger Bands - Bands will begin to contract as volatility decreases.
-
Moving Averages - the support/resistance levels will typically oscillate around moving averages - prices do not stay above or below the moving average for a defined period.
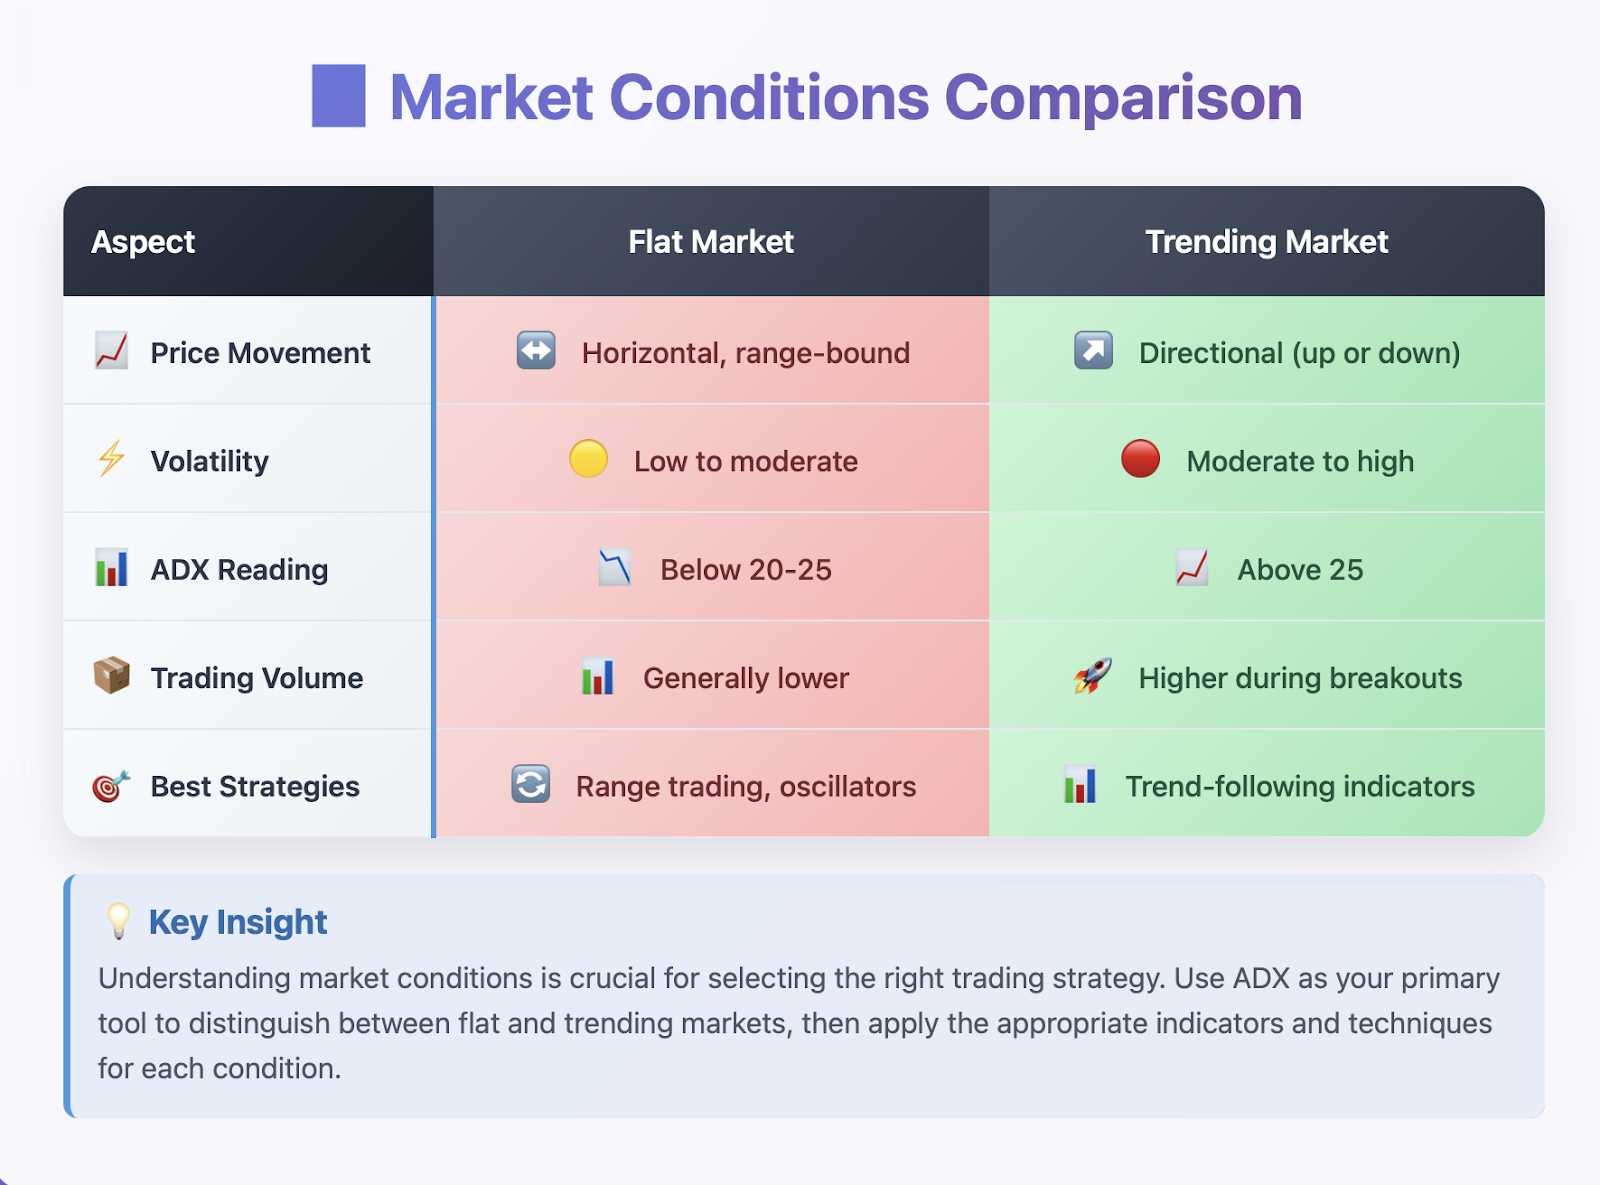
Professional Example: The GBP/USD trades within 1.2800-1.2850 for 10 consecutive days, with an ADX focus of under 20; this symbolizes a flat market.
Beginner Example: You can relate this to a video game player who scores between 2000-2050 points, over multiple times playing this game. This demonstrates stability and distanced performance, but no significant upward or downward direction.
Now, if you can identify flat markets, you are able to utilize the various range trading strategies available. Although trending markets are sexy and receive the most publicity, flat markets produce decent opportunities for traders who respect the conditions that flat markets present.
Reasons for Flat Market
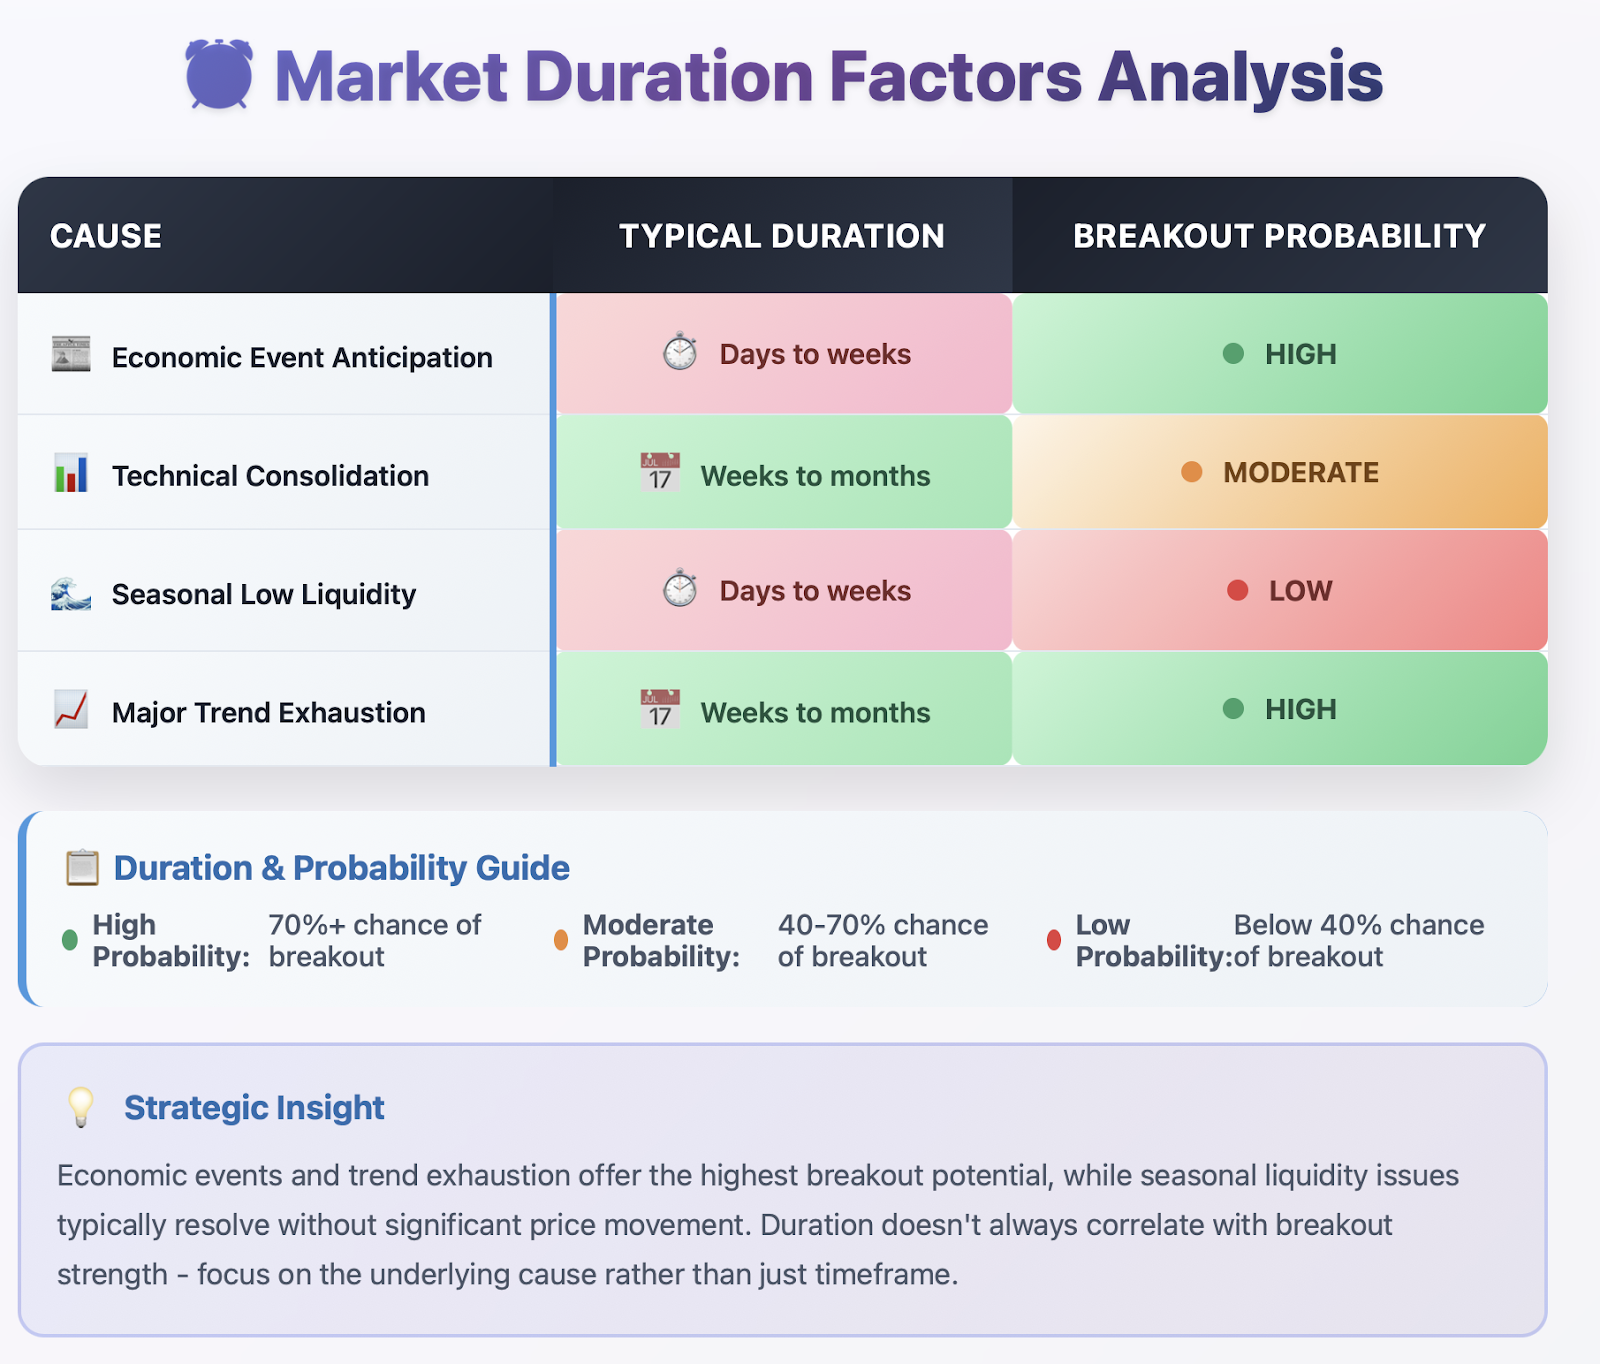
Interestingly enough, it is extremely helpful to know why the market is flat, and to be able to forecast how long the market may be flat, and which potential direction the market may break out. There are quite a few fundamental and technical reasons for a market to go into a sideways or flat market.
The main causes that contribute to Flat Markets:
1. Steady Market Equilibrium Between Bulls and Bears - If buyers and sellers have equal strength and conviction, neither side can seize control. This causes the market to stay in equilibrium and result in a tug-of-war effect therefore prices will remain restrained and within range. When traders are doing this, it is considered "price discovery" by the professionals. Essentially, the market keeps trying to find a fair value by repeatedly testing support and resistance levels.
2. Lack of Major Market Catalysts - Flat markets happen when there are no significant economic signals, central bank updates, or geopolitical events. Traders are not receiving any new info that affects market sentiment which causes them to "wait" or sit back which reduces both volatility and price action.
3. Caution from Institutions - Monetary institutions such as banks, hedge funds, and pension funds sometimes may sit on the sidelines during periods of uncertainty. When these larger players are inactive, the resulting volume and momentum decrease will often create a range bound situation.
4. Technical Consolidation - After a major move in trending prices the market may enter a phase of technically based consolidation to "digest" prior gains or losses. During this phase of technical consolidation, the market has a chance to reform energy for the next major move, while simultaneously providing an opportunity for latecomers to get positioned.
Professional Example: The USD index often has low volatility in price action leading up to Federal Reserve interest rate decisions because traders are taking a cautious approach to trading while waiting for policy announcements.
Beginner-Friendly Example: Think about exam scores that remained steady all week before final exams. The students are focused on revision for the exam, not answering practice test questions, so the performance is consistent and flat.
Acknowledging these underlying causes allows traders to not only scoop when flat markets can happen, but how long they may continue and how they will eventually breakout. This understanding is the basis for developing a viable trading plan for a sideways market.
How to Identify a Flat Market
Identifying flat markets is far from easy, but if you have a systematic process that combines multiple technical analysis tools, you will be more successful. Using only one way to identify a flat market can lead to false signals, which is why professional traders utilize a comprehensive identification process for flat markets.
Technical Indicators for Flat Market Identification:
1. Average Directional Index (ADX) - Using ADX is probably the best and most reliable single indicator for identifying flat markets.
-
ADX < 20 : indicates weak/no trend (flat market).
-
ADX 20-25: indicates developing trend strength.
-
ADX 25+: indicates strong trending conditions.
2. Bollinger Bands Review Bollinger- Bands are great visual confirmation of flat market conditions.
-
Contraction of the bands - indicates decreasing volatility
-
Price was moving back and forth through the bands and not moving with any intent longer than a momentary break.
-
Band squeeze - commonly leads to subsequent breakout movement.
3. Moving Average Condition- I take note of flat market condtions when i see multiple moving averages (20, 50, 100-period) converging or moving horizontally.
Price Action Identifying Tools:
-
Support and Resistance Tests: Find price levels that support this type of price action:
-
Multiple touches at the same price level
-
Multiple touches on the top and the bottom with clear boundaries established
-
Broke either boundary, but quickly reversed.
Candlestick Patterns
-
Doji Candles - Usually suggest indecision
-
Inside Bars - suggest prices are being compressed
-
Small-bodied Candles - indicate lower volatility
Volume Review Techniques:
-
Low/Declining volume confirmation
-
Declining volume during a range
-
Volume spikes only during a support/resistance test
-
No sustained high volume readings
Quick Identification Check List:
-
ADX reading below 20-25
-
Bollinger Bands contract
-
price respecting support/resistance
-
multiple attempts to breakout
-
declining or stable volume
-
moving averages flattening
Professional Example: The EUR/JPY have been trading between 1.1200-1.1230 comfortably for two weeks; ADX at 15, contracting Bollinger Bands, and volume readings at 30% lower than the previous 20-period average provided clear confirmation all indicated flat market conditions.
Example for Beginners: Consider tracking prices of a product at a shop where prices fluctuate slightly in the same general ballpark of $10-12 range over the course of a week with traffic being good, not terrible. This resembles how currency pairs behave in flat market conditions.
Multi-timeframe Confirmation:
You should always check flat market characteristics on multiple timeframes:
-
Shorter timeframes (15-min, 1-hour): will show detailed ranges in more defined boundaries
-
Daily charts: will confirm an overall sideways structure
-
Weekly charts: provide context to long term trend direction
Utilizing this omni-complete identification approach will greatly improve a trader's overall accuracy and ability to check for flat market conditions, rather than mistakenly identifying a brief pause as flat market conditions.
Again, it is all about timing, and making sure you receive signals confirming that you are waiting for flat market conditions to appear.
Strategies for Trading in a Flat Market
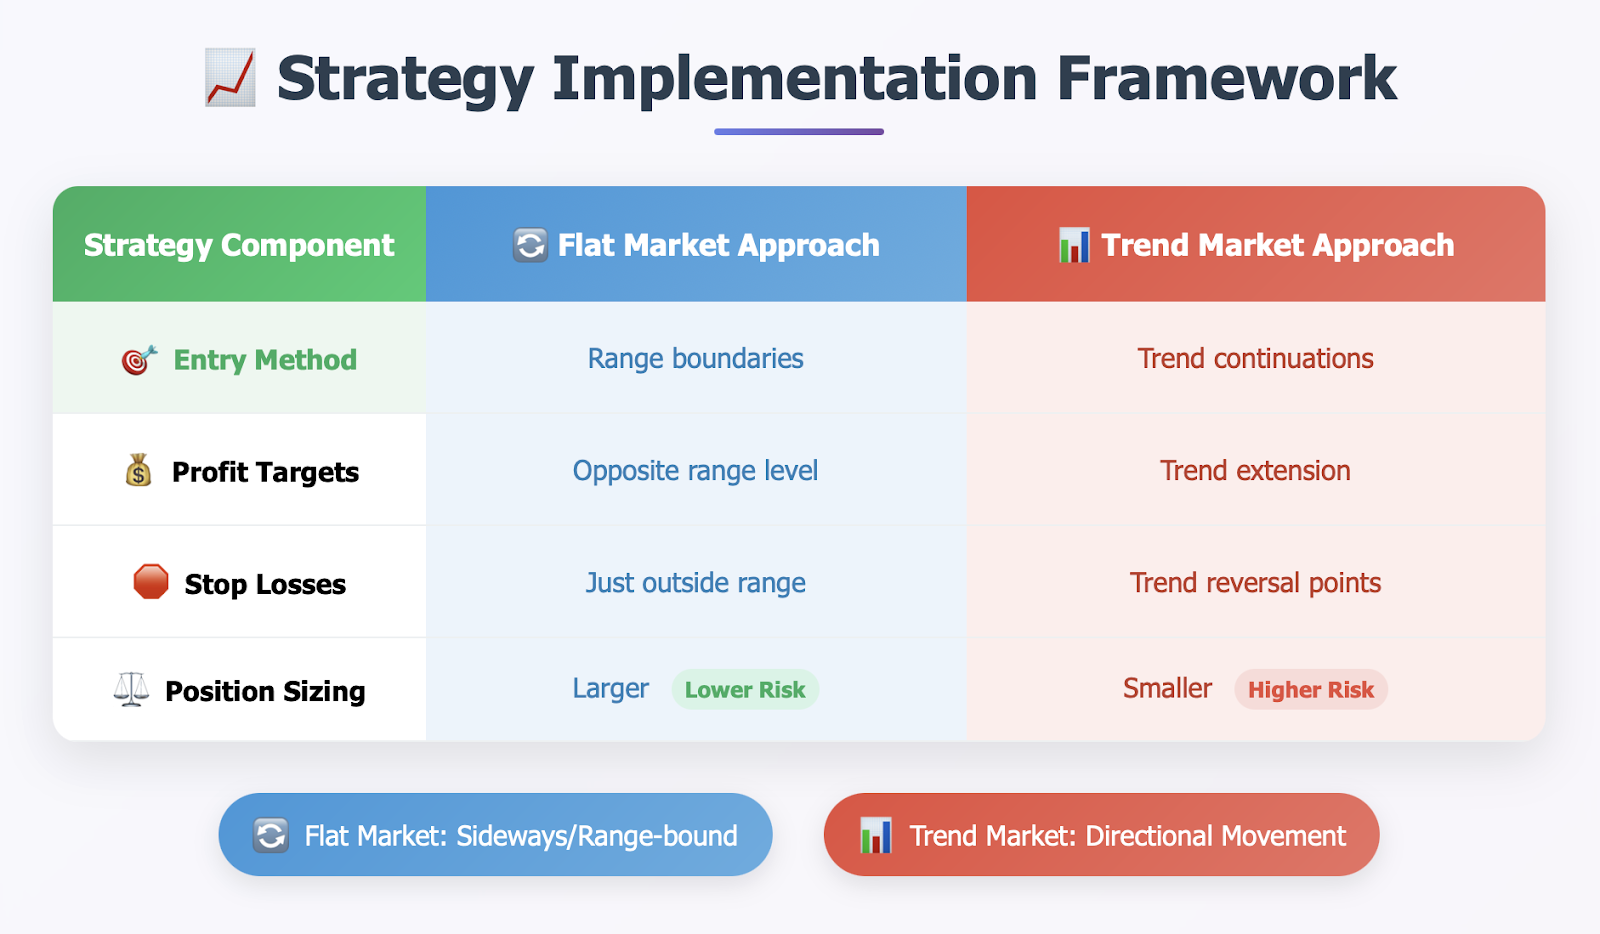
Flat markets will employ a set of trading methodologies that will be notably different than trend-following trading strategies. The key to profiting in sideways markets is to understand that the premise shifts from “follow the trend” to "buy low sell high” in a range.
Core Range Trading Strategy:
1. Buying at Support and Selling at Resistance: This is a fundamental strategy that involves:
-
Entry points: Near support for longs and near resistance for shorts
-
Target levels: At the boundary opposite direction of entry boundaries of the range
-
Risk-reward set up: A typical 1:1 to 1:2 ratios are most effective in flat markets
2. Oscillators best of the best usage: Oscillators perform well in flat market conditions:
RSI (Relative Strength Index):
-
Entry points for buy signals: When RSI is below 30 also at support
-
Entry points for sell signals: When RSI is above 70 also at resistance
-
Divergence patterns: Generally predicted a range breakout
Stochastic Oscillator
-
Diverge indicator (crossover of %K and %D) when they’re at extreme readings
-
Oversold readings if %K readings < 20 (at support)
-
Overbought readings if %K readings >80 (at resistance)
Utilizing Advanced Flat Market Techniques:
1. Multi Time Frame Range Trading
-
Daily: Identify main range boundaries,
-
4-hour: Look to locate entry and exit points
-
1-hour: Look to identify timing and risk positioning
2. Volume Based Confirmation
-
Increase position size in larger volume at range boundaries
-
Reduce risk when volume is sluggish
-
Watch for expansion of volume signifying potential flash trades
3. Mean Reversion Tactics
-
Use moving averages for dynamic support/resistance
-
Employ Bollinger Bands for entry alerts.
-
Trade pullbacks to the center of the range
Flat Market Risk Management
Stop Loss Placement:
-
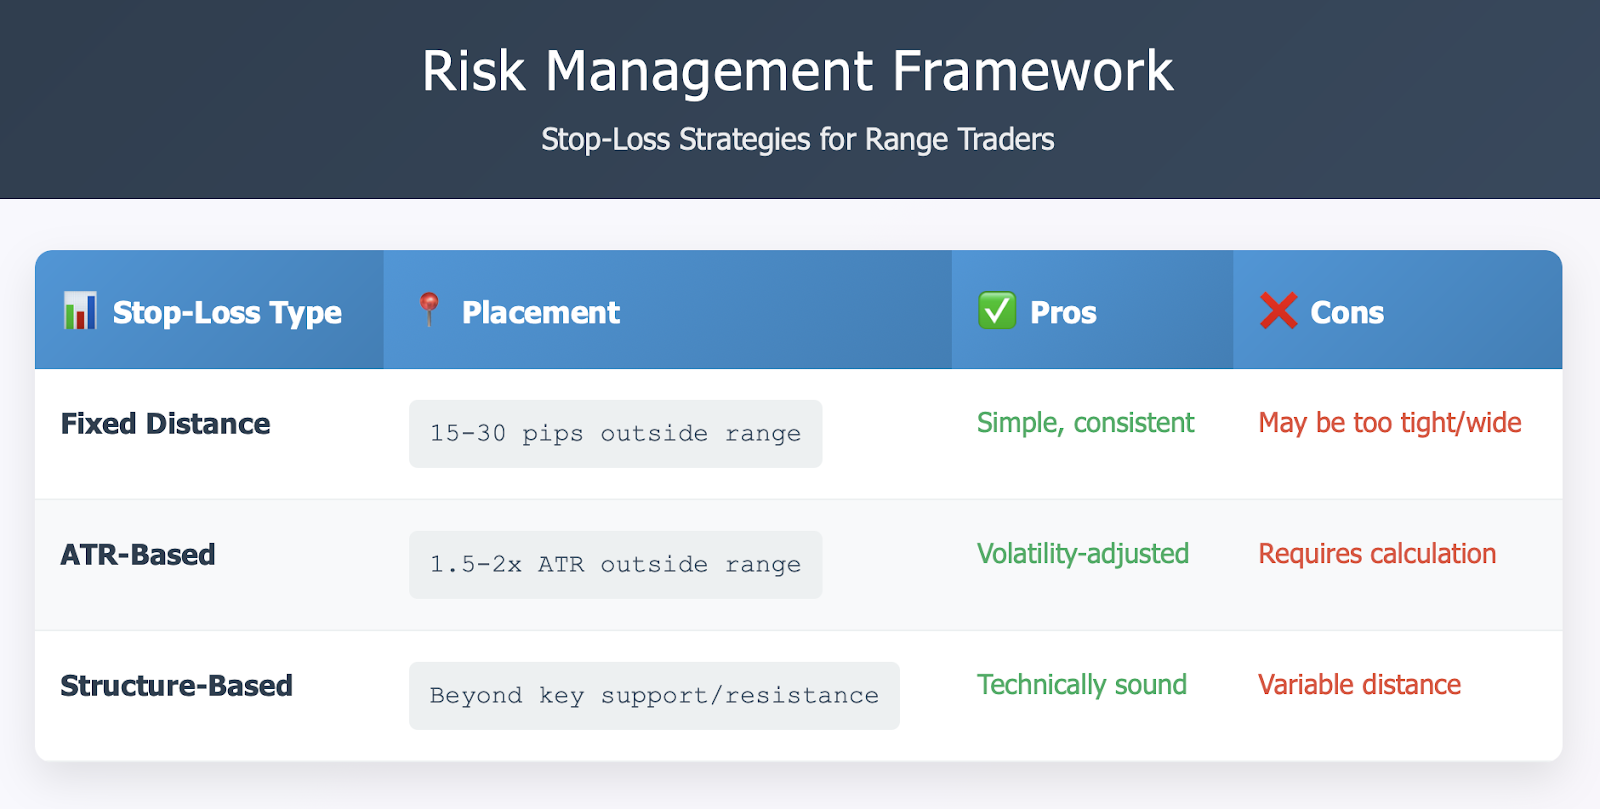
Conservative: 10 -20 pips beyond range boundary.
-
Aggressive: Just outside the swing high/low.
-
Dynamic: Require the use of ATR to establish a stop-loss amount and then allocate that stop-loss amount into trading vehicle volatility.
Position Sizing Rules:
-
Be larger size with less volatility
-
Scale your position into trades when optimized.
-
Use correlation analysis to not be over-exposed.
Professional Example: Selling the EUR/USD range trade between 1.1000-1.1020 results in a variety of profitable trades over the span of two weeks. The trader's approach is to buy at 1.1005 (close to support) with a 15-pip stop loss and take profit level, where they achieve a success rate of 70% over 10 trades.
Beginner-Friendly Example: At a school auction, I notice many of the items are selling in the same range of $50-60. I start to buy items near $50 and sell them for $55-60, consistently taking smaller amounts of profit while staying away from the fright of items with any random price move.
Strategies for flat markets to avoid:
-
Indicators that follow a trend like MACD and moving average crossovers
-
Breakout strategies with no confirmation in volume
-
Stop losses that are to wide still take advantage of range trading.
-
Not knowing correlation between currency pairs
Having patience, precision, and disciplined capital management are the key to the success of flat market trading. Although you may not make as much per trade as you would in a trending market; with a trader making more trades more frequently and with a higher probability of success, you can still make constant returns from being a good range trader.
Breakouts and Risk Management
Whenever you are trading in a flat market, there will be breakouts that occur, it is the nature of trading. When analyzing breakouts and the market, it is crucial to understand that managing your risk is the most important design. Risk management helps to not only protect your capital but will allow you to potentially profit from new trending movements.
Identifying Authentic Breakouts:
Volume Confirmation: By far the best breakout indication is volume confirmed by price movement:
-
Volume increase: (50-100% above recent averages)
-
Continued Momentum: (must be followed through in subsequent candles)
-
No Reverse: (price does not reverse back into range immediately)
Candlestick Breakout Patterns Look for:
-
Marubozu candles: (strong body with small wicks)
-
Engulfing patterns: (large candle that engulfed previous range bound action)
-
Gaps: (opening beyond the prior price range)
Breakout Directionality: Determine potential breakout direction:
-
Significant Fundamental Catalyst
-
Economic Releases: (large data can provide directional movement)
-
Central Bank Announcements: (policy change can provide sustained breakouts)
-
Political Circumstances: (changes in risk-on/risk-off)
Technical Breakout signals
-
Multi-Timeframe Agreement: (Generally all timeframes will be confirming breakout)
-
Momentum Indicator: (RSI/MACD showing directional strength)
-
Moving Averages: (Daily price penetrating MA/s)
2. Position Size Management
Before Breakout: Traditional range trading position sizes
After Breakout: Decrease your position size by 30% to 50%.
(If you have a false breakout, regardless of the situation, you would offset or exit the position; either way, you will have little risk exposure).
3. Breakout Trading Transition
When the range breaks, professional traders identify and adapt to the trending market:
-
Exit range-position trades (illegitimate trades).
-
Learn the new market structure and identify new support/resistance levels.
-
Develop and utilize trend trading strategies.
False Breakout Protection:
Common Characteristics of False Breakouts:
-
Lack of volume when the price initially breaks;
-
Immediate reversal back into the range after the breakout;
-
The price breaks-out during the times of low liquidity;
-
Lack of fundamental catalysts.
False Breakout Protection Strategy:
-
Wait for confirmation and do not chase the initial breakout.
-
Use smaller position sizes on the first time breaking out above the range.
-
Volume is key to ensuring the quality of the breakout. Low volume could mean the move is a false breakout - acceleration based on limited risk.
-
Set very tight stop losses to limit exposure on failed breakout trades.
Professional Risk Management Example:
The USD/JPY has been trading in a range of 110.00-113.00 for three weeks. A trader who trades with the below parameters:
1. Sets stop-losses at 109.80 and 113.20 for the first price break above the range (20 pips outside of range).
2. Trade size uses a risk model of 0.5% for position size, risk received, during range trading/trading.
3. When the price breaks beyond 113.00 with high volume, they reduced their position size to 0.25% risk.
4. After confirming the breakout, they relied on a 1Xstop-loss rule and added their trend trading strategies.
Conclusion
Acquiring the skills to trade flat markets is an essential milestone in acquiring a full skill set for forex trading. In this guide, we have shown how flat markets are great for traders to take a profit as they may appear to be simple but consistently offer profit opportunities to traders who understand this in flexibility.
The forex market spends 70% of its time in sideways/range-bound conditions. By becoming proficient at trading in flat markets, you'll be able to profit from the majority of market conditions and develop the patience and discipline necessary for successful long-term trading.
Want to get started applying these concepts? Start identifying flat markets on your charts today with tradewill.com and carry out the trade strategies we covered, and start developing proficiency in one of the most consistent profit opportunities in forex trading. Remember, successful trading does not come from capturing every big move - it comes from regularly profiting from the situations you have the most chances to see!
Disclaimer: The content of the blog does not represent any position of Trade W, does not serve as any trading-related decision advice, and does not endorse any third-party.