

 Trade W
1. Introduction: Why Is Fundamental Analysis Crucial in Forex Trading?
Once you join the forex market, it's like you are joining a worldwide market where currencies are the products that are competing against each other in their respective countries’ economies. This is when fundamental analysis becomes your best friend when it comes to figuring out what is driving the market and helping you to do the right thing in terms of trading.
What is Fundamental Analysis?
Fundamental Analysis is the application of analysing macroeconomic indicators, government policies and economic data whilst considering the true value of a currency. Unlike the stock market, when you trade currency, one of the key factors you need to be aware of is the cost of a country’s debt and the nation’s current political situation, not just the earning potential of a company.
Or think of it this way: In the same way you would base decisions on a company’s profit margins and prospects — and not just on a quick jump in its stock price — you would look at a country’s economic fundamentals to place a value on a currency. Strong employment in a healthy economy, controlled inflation, and sound governance are the usual drivers of a firm currency.
Fundamental vs. Technical Analysis
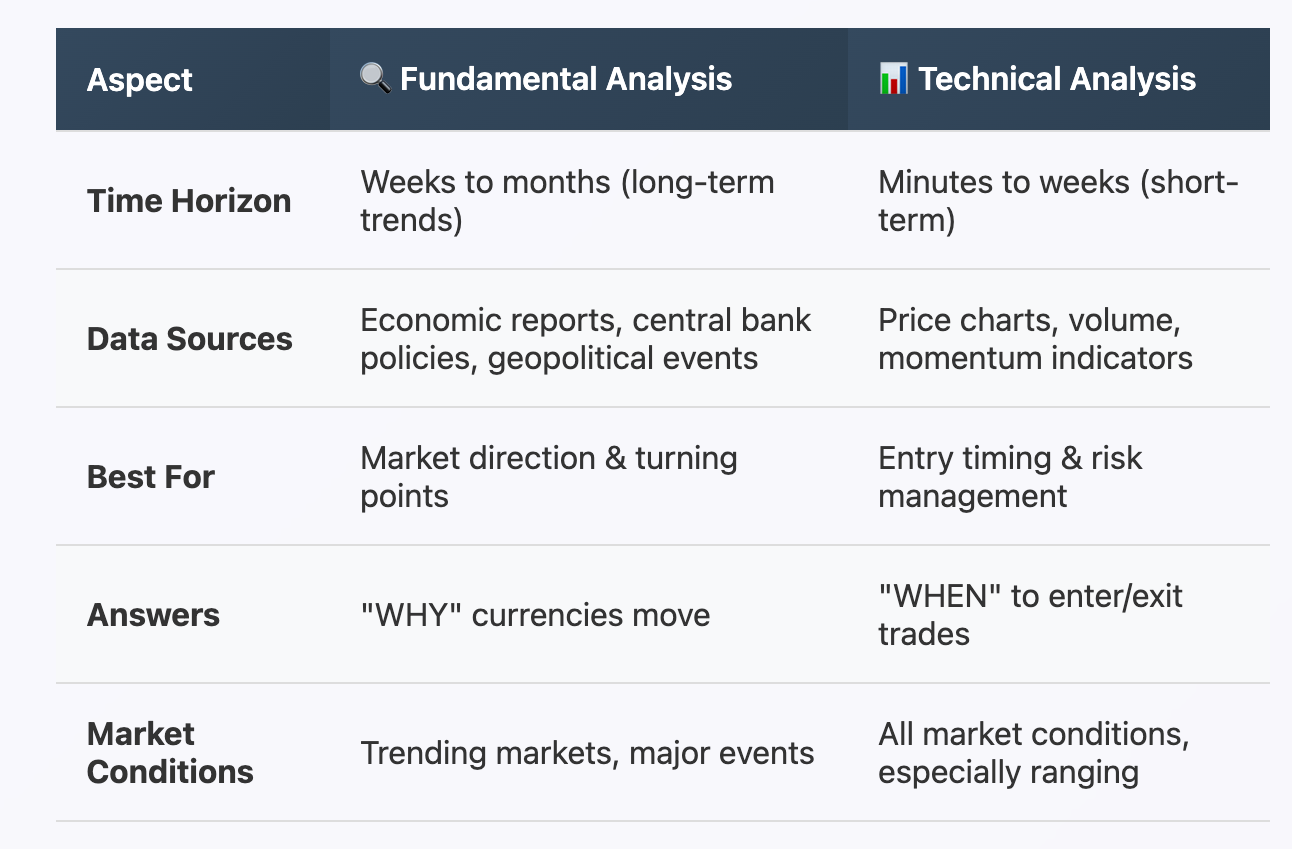
Whereas technical analysis concentrates on price patterns and chart indicators to predict a currency pair’s future price movements, fundamental analysis is based on a currency’s strength or weakness and potential directions in the future. Technical analysis may tell you when to enter the trade, but fundamental analysis tells you why a currency should move in that direction.
For sustainable growth and profitability in forex trading, you must get a good foundation. Think, for instance, of a scenario where the FOMC warned it would increase interest rates in 2022: fundamental analysis would have opened the door for traders to expect the USD to appreciate against other currencies, and it did the job over months, offering many trading opportunities to those who understood the economic characteristics behind this.
The short answer is that the basic is the floor plan, and the technical is the furniture in the room.
The bottom line here is pretty straightforward: fundamental analysis offers the direction, and technical analysis is used for timing. Learn both and you’ll have a big advantage in the forex market.
Basic Terminologies: The 5 Core Pillars of Fundamental Analysis
To comprehend the concept of fundamental analysis, you must master five key economic indicators upon which currency value is based. Think of them as the vital signs of a country’s economic health.
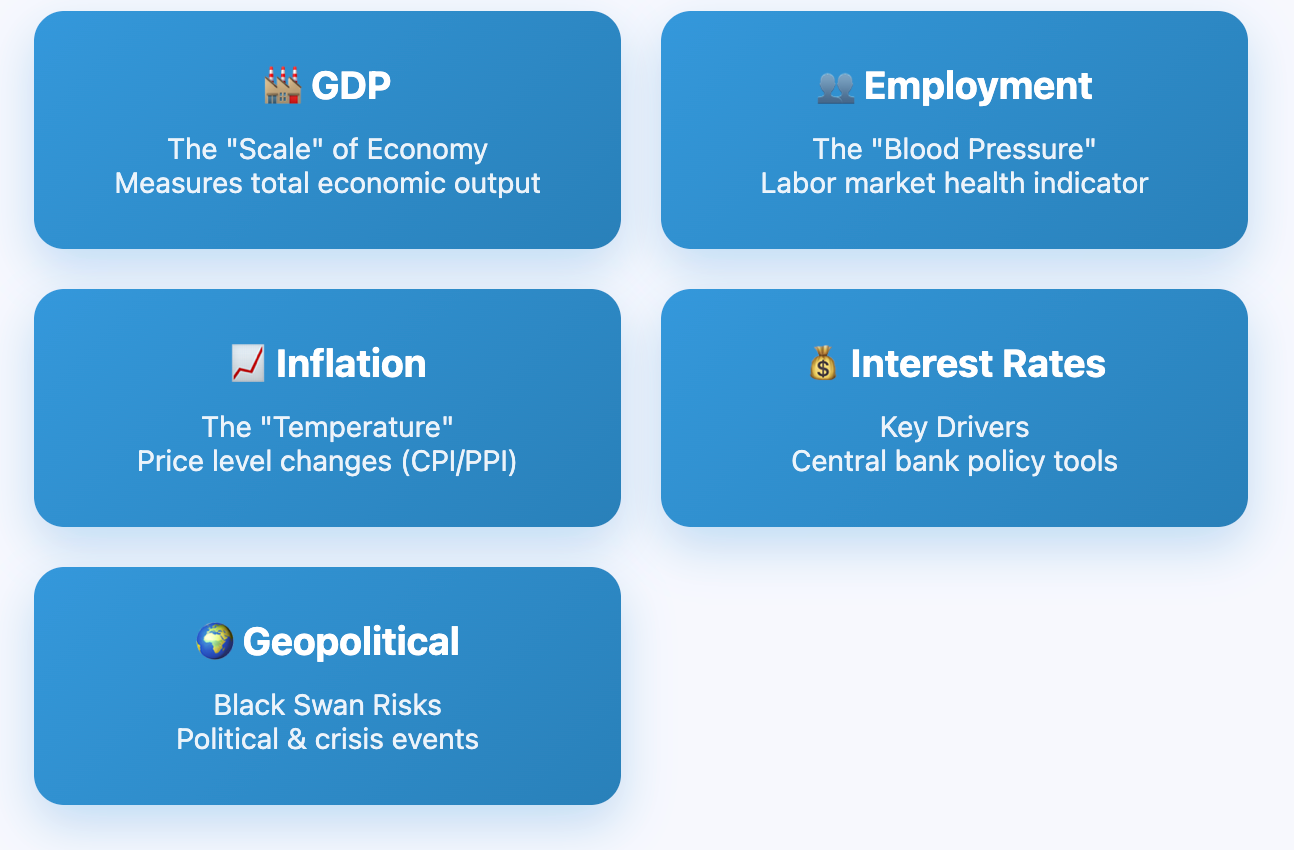
GDP: THE "SCALE" FOR A COUNTRY'S ECONOMY
Gross Domestic Product (GDP) is the sum of everything produced within a country. It is the broadest measure of current economic activity and the best indicator of the economy’s current position in the business cycle. Rising GDP figures indicate a prosperous economy that stimulates foreign investment and strengthens a country’s currency.
Professional insight: The GDP growth of about 22 per cent per year would be supportive for a stronger currency, while a negative growth means the currency is becoming weak.
Beginner explanation: GDP is a way to measure how much money a country makes in a year. The more money = the bigger the economy = the bigger the currency.
The “Blood Pressure Monitor” of the Economy: Employment Data
One can have a look at employment data (especially U.S. non-farm payrolls (NFP) or unemployment numbers to gauge the performance of an economy in making use of its workforce. Healthy labour markets are positive for the economy, contributing to consumer purchasing power that fuels economic expansion and demand for the currency.
Professional Analysis: NFP releases result in immediate volatility of 50 – 100 pips or more across all forex pairs, particularly on USD-based pairs.
Beginner explanation: The more people have jobs, the more money they spend, which makes the economy and currency stronger. Inflation - CPI/PPI: The CCP Indicator of the Currency
These are gauges of how much prices are rising in an economy, such as the Consumer Price Index (CPI) and the Producer Price Index (PPI). Some inflation (2-3%) is good. It erodes its value too quickly, but deflation can be a sign of economic weakness.
Professional view: A Larger CPI may drive central bank interest rate increases, which are generally supportive of the currency.Explanation: Central banks raise interest rates to prevent prices from skyrocketing, which in turn can help boost currency values.
Interest Rates & Central Bank Policies: Key Drivers
The announcement of changes in interest rates made by central banks has a direct effect on currency values. Foreign capital seeking higher returns tends to flow to countries with higher interest rates. Central-bank communications and policy shifts can lead to violent market moves.
Analyst insight: Long-term trends in currencies are often driven by interest-rate differentials between countries.
Beginner answer: Higher interest rates = making the country more attractive to investors = stronger currency.
Geopolitical Events & Shocks: (Black Swan Risks)
Political stability, politics, elections, trade wars and black swans can drive sudden currency market moves which overshadow economics. These occurrences can cause considerable fluctuation and uncertainty within the currency markets.
Pro-advice: Whenever trade wars or geopolitical crises occur, safe-haven currencies like USD, JPY, and CHF become stronger.
Novice translation: Political issues or surprises can spook investors into purchasing “safe” currencies.
Key Insight: The Five Pillars all work together, not separately. A country can see strong GDP growth, for example, but if inflation is spiralling, then the currency might still fall. If you use fundamental analysis, it is important to make all of these interactions explicit.
Case Study: The Full Fundamental Analysis Can the Fatalities be Reduced?
Now, an example of how professional traders apply this to their trading. We’ll take a look at the market setup around a Federal Reserve interest rate decision.
Background: Upcoming Rate Hike on March 22 from the Fed
Early in 2022, inflation in the United States had soared to 40-year highs, with the CPI rising above 7%. The situation put pressure on the Federal Reserve to increase interest rates to control inflation. The first rate increase since 2018 had been widely expected by markets.
Step 1: Market Expectations Analysis
Even before data comes out, winning investors consider what the market expects:
• Market consensus: 95 per cent chance of a 0.25 per cent rate rise
• Inflation backdrop: 7.9% CPI, well above the Fed's 2% target
• Employment situation: Strong job growth, with unemployment at 3.8%
• Fed communications: Officials hinting at hawkish stance
Step 2. Released Data and Initial Reaction
The Fed, when it announced the rate hike as expecte,d got a muted market response, since the move was already fully priced in. Fed Chair Jerome Powell, however, used a press conference to talk about “moving expeditiously” on rate hik,es which weighed broadly upon USD.
Step 3: Forecasting Asset Movement
Based on the fundamental analysis:
• USD-crosses: Look for strength against low-yielders
• Gold: Expecting pressure from higher real interest rates
• Bond yields; Anticipated to gain, giving further fuel to the USD push
Step 4: Trading Decision Framework
In a Trend: Go long USD versus EUR, JPY or any lower-yielding currencies. For hedging: Minimise the impact of interest rate sensitivity of your positions. In a Market Contrarian position: Wait for overbought situations to initiate positions in the opposite direction.n
Step 5: Understanding Market Psychology
Here’s an important lesson: sometimes positive economic data can precipitate surprising price action. In this situation, although the rate hike was constructive for the USD at the basic level, some investors sold the USD at the time when it was announced for profit-taking and a point of view of "buy the rumour and sell the announcement".
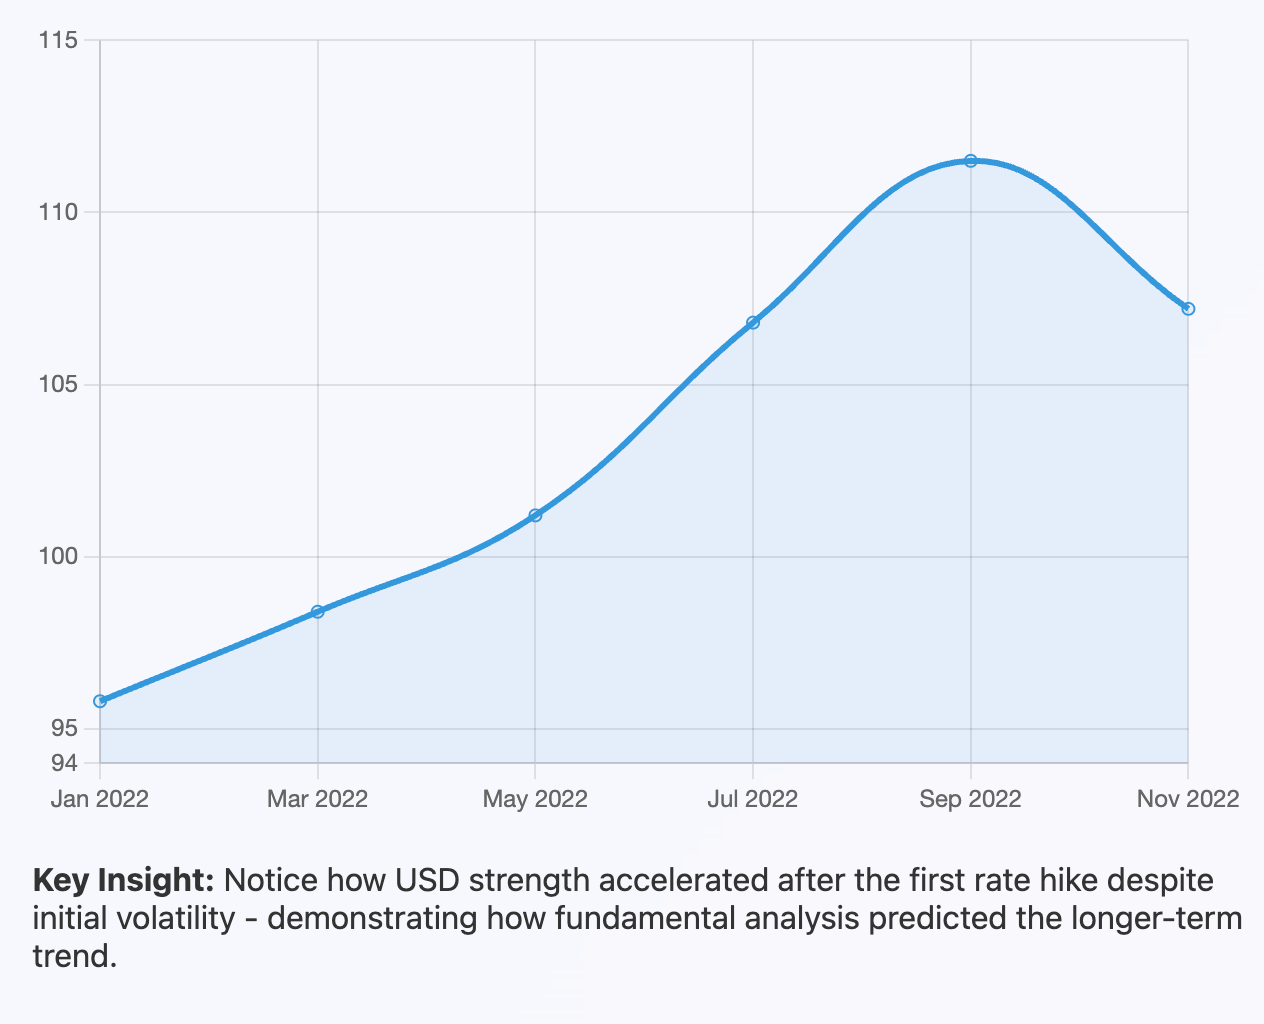
This is proof that fundamental analysis is not only about the numbers but also about comprehending how markets perceive and respond to the numbers. Even the most brilliant tradersutilisee fundamental knowledge along with market sentiment.
Bottom Line: Fundamentals - the map, Psychology - the speed and direction of travel.
Comparing Fundamental and Technical Analysis
To succeed in forex, you need to be able to fully comprehend the market and technical analysis is an inseparable part of it. Don’t consider them as competing strategies; consider them different tools in your trading arsenal.
Defining Technical Analysis
Technical analysis involves analysing price patterns, chart patterns, and statistically generated indicators using past price information for the purpose of predicting price trends, abutis just not that effective at doing so. It is based on the concept that market prices factor in all available information and that history tends to repeat itself through recognisable patterns.
Key Differences
Time Horizon:
• Basic: Trends over intervals (weeks to months)
• Tech: Minutes to weeks.
Data Sources:
• Basic: Economic reports, political considerations, and opening up geopolitical events
• Technical: Charts, volume, momentum indicators
Suitable Scenarios:
• Basic: The best type to use when you want to analyse the general direction and turning points within the market.
• Technical: Excellent for the entry, stop-loss, and short-term strategic decision making
Same Event, Different Perspectives
Take the 2022 Federal Reserve rate hiking cycle:
Fundamental Analysis Perspective: Higher interest rates and hawkish Fed bias, while lending continuous support to US strength over the months. The analysis centres on inflation, employment and the Fed's communications to predict the general direction.
While TA would also point out that after every rate hike, there is a tendency to be specific chart pattern forming, and if they are tough enough and early enough, there are some support and resistance levels and momentum signals that would have made it useful for traders to time their entries and exits on this larger uptrend.
The Power of Integration
The most effective solution combines the two:
1 Use basic concepts for your direction: Are economic conditions getting stronger or weaker?
2 TIME it – When do I enter this trade?
3 Use basics for conviction: Do I stick with short-term technical corrections?
4. Employ technicals for risk management: Where is the trend? Should I cut my losses?
As for an example, lets say you think the USD is going to get stronger based on Economic fundamentals (benefitting from Fed), but your chart tells you that the pair was due to for sell-off at the moment, then you will wait for the chart to compensate the over-buying before you take a long position in the direction of the fundamental trend.
Key Takeaway: It’s not fundamental or technical – fundamental AND technical together make for a complete trading strategy.
5. How to Monitor and Retrieve Essential Data
The right tools and interpretation of economic news are crucial in order to be successful in fundamental analysis. Your guide to how the media is covering the virus — and how to stay well-informed and make decisions based on data.
Essential Tools for Fundamental Analysis
ForexFactory: The holy grail of economic calendars, providing timely economic releases, impact ratings and market expectations.
Trading Economics: A wealth of detailed economic indicators and forecasts (1,200+) for more than 200 countries with very strong historical data and analysis capabilities.
Central Bank Websites: Direct links to statements, minutes, and speeches by the Fed, ECB, BOE and other major central banks.
Reading an Economic Calendar
In order to carry out fundamental analysis, you need to understand data on the economic calendar. Focus on four key elements:
Previous: The latest value reported for the indicator. Forecast: The name of the data source and its release period: The period the data will cover.
What matters to understand is that markets respond to surprises, not absolute values. A “good” economic reading that does not impress enough can be bad for the currency, and a “bad” one that beats may serve as a good support.
Setting Up Effective Alerts
Set alerts for high-impact events that affect your trading pairs:
• Central bank meetings and rate decisions
• Major employment figures (Non-farm Payrolls, Unemployment Rates)
• Inflation reports (CPI, PPI)
• GDP releases
• The balance of trade and current account
Understanding Impact Levels
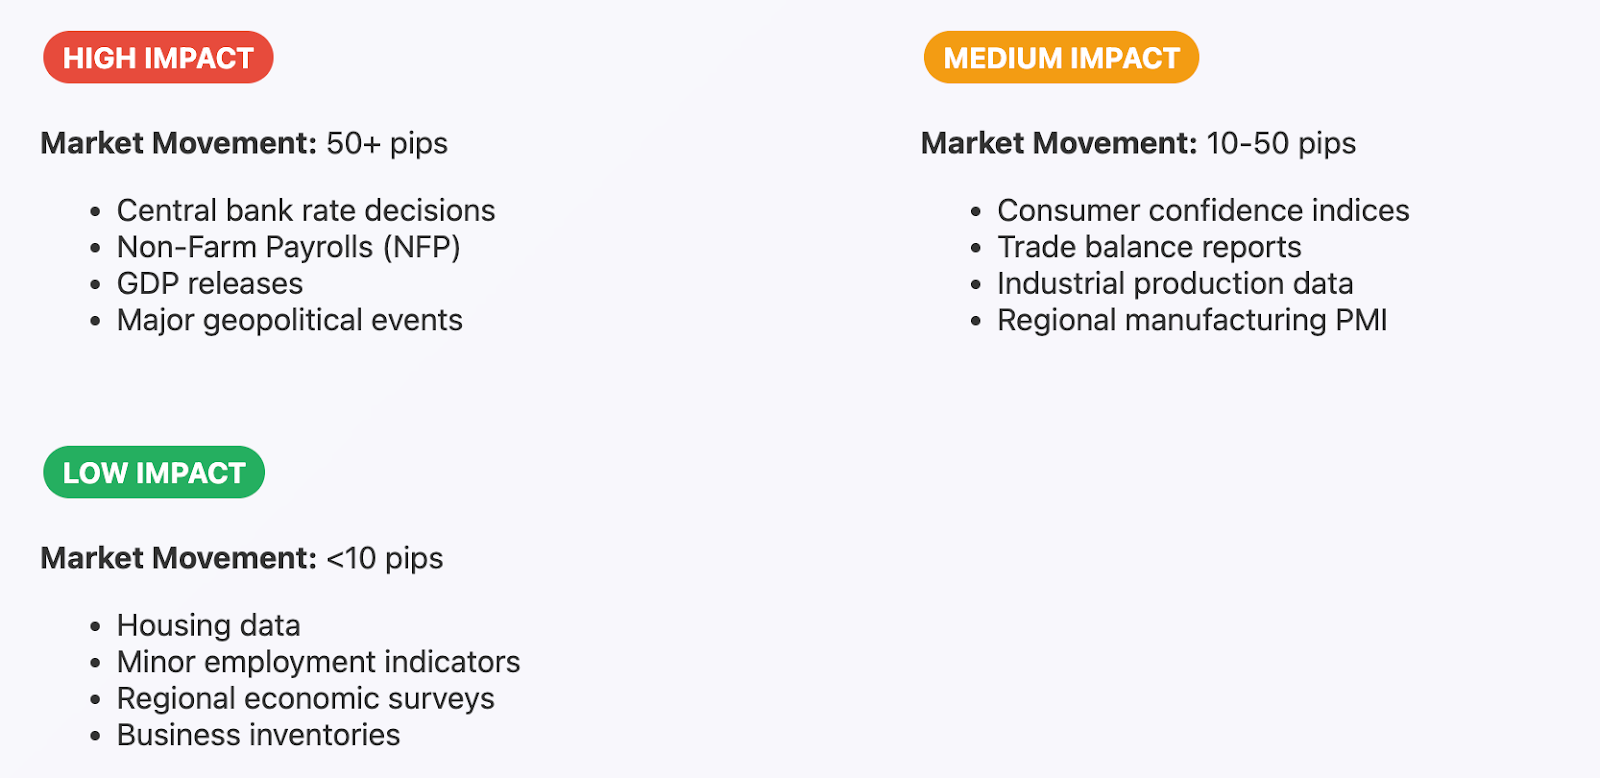
High Impact: Those events that would normally see large market movement (50 pips or more)
-
Central bank rate decisions
-
NFP releases
-
GDP reports
-
Major geopolitical events
Medium Impact: Events which may trigger a moderate amount of market movement (10-50 pips).
-
Consumer confidence indices
-
Trade balance reports
-
Industrial production data
Quiet: Little to no immediate market reaction with potential for late price swings
-
Housing data
-
Minor employment indicators
-
Regional economic surveys
Case Study: NFP Release Day
NFP comes out on the first Friday of every month and is almost always a huge driver of USD volatility. Professional traders prepare by:
It is all about Pre-release Analysis-
-
Review of leading indicators such as ADP employment and jobless claims
-
Setting the stage: Market views and possible surprise paths
-
Tech prep: Key levels to watch for B/Os
-
Risk management: SWO during high risk (or stop trading)
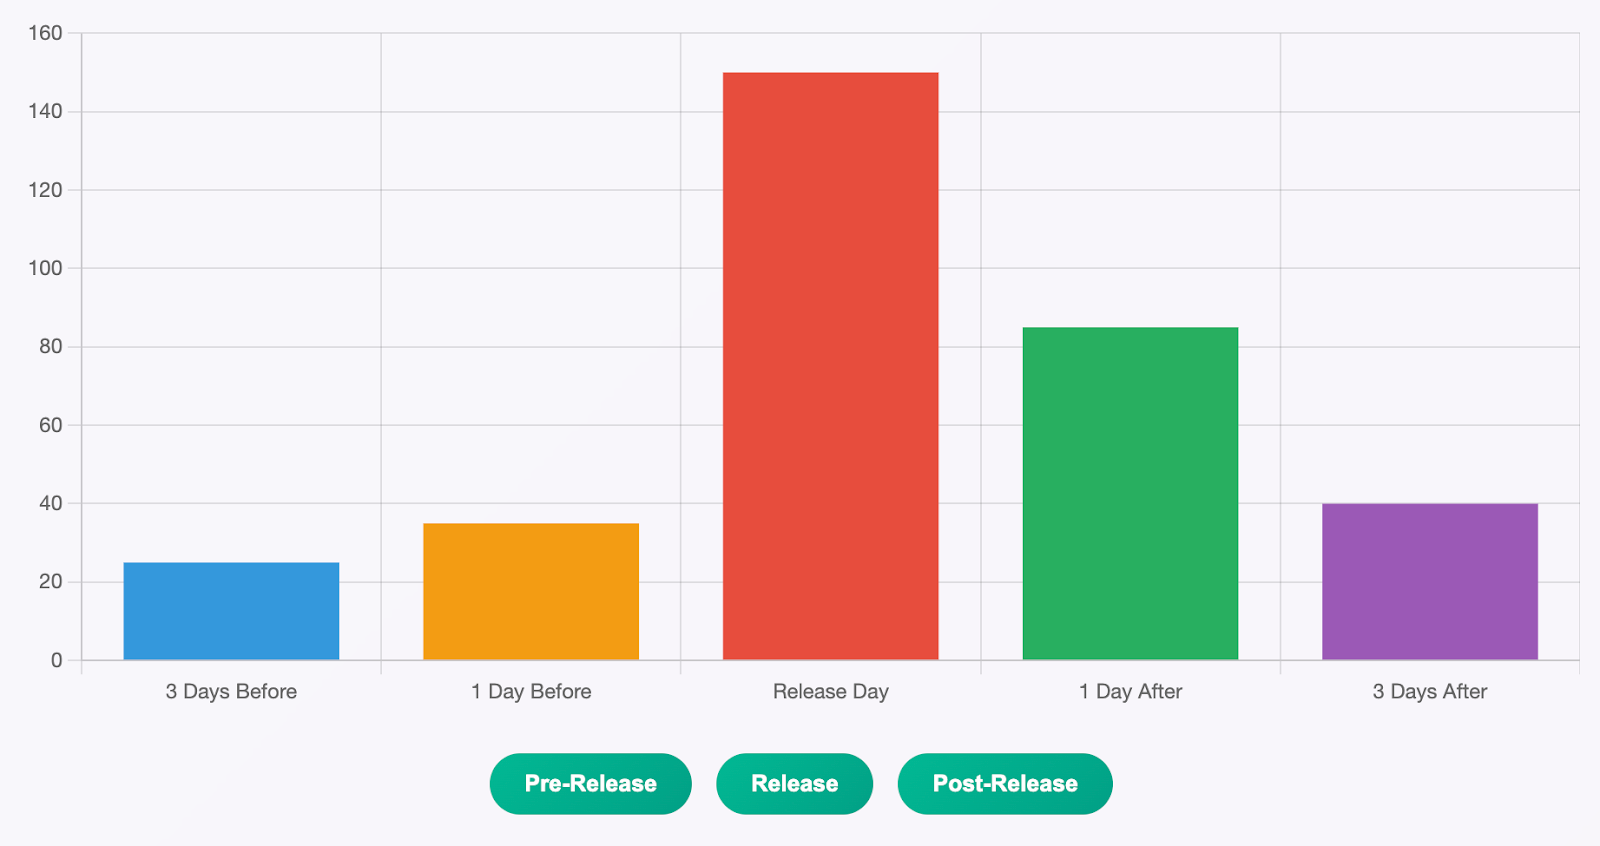
Key Takeaway: Markets don’t respond to the data itself: They respond to how that data compares with what the market had already priced in. The trader who understands this has a great advantage.
How Fundamentals Work in Various Market Cycles
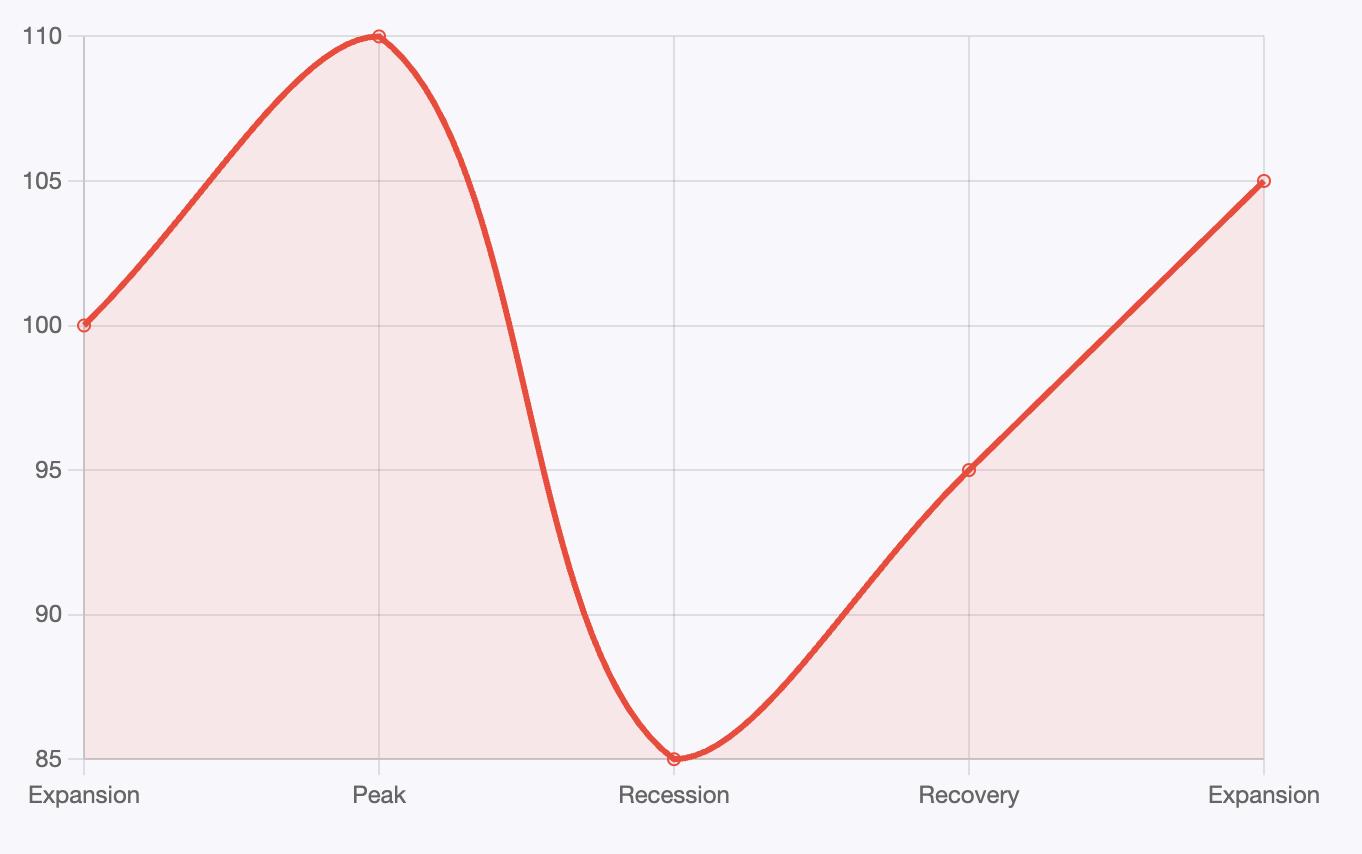
All markets are alternated in economic cycles,andt under different economic environments, some indicators dominate over the others. Knowing these cycles can help you shift your analysing emphasis and trading strategies accordingly.
The Four Phases Of An Economic Cycle
Expansionary Period: When economic conditions are favourable, concentrate on employment, consumer spending, and business investment gauges. Robust employment growth and wage gains help currency strength as better consumer spending leads to economic momentum.
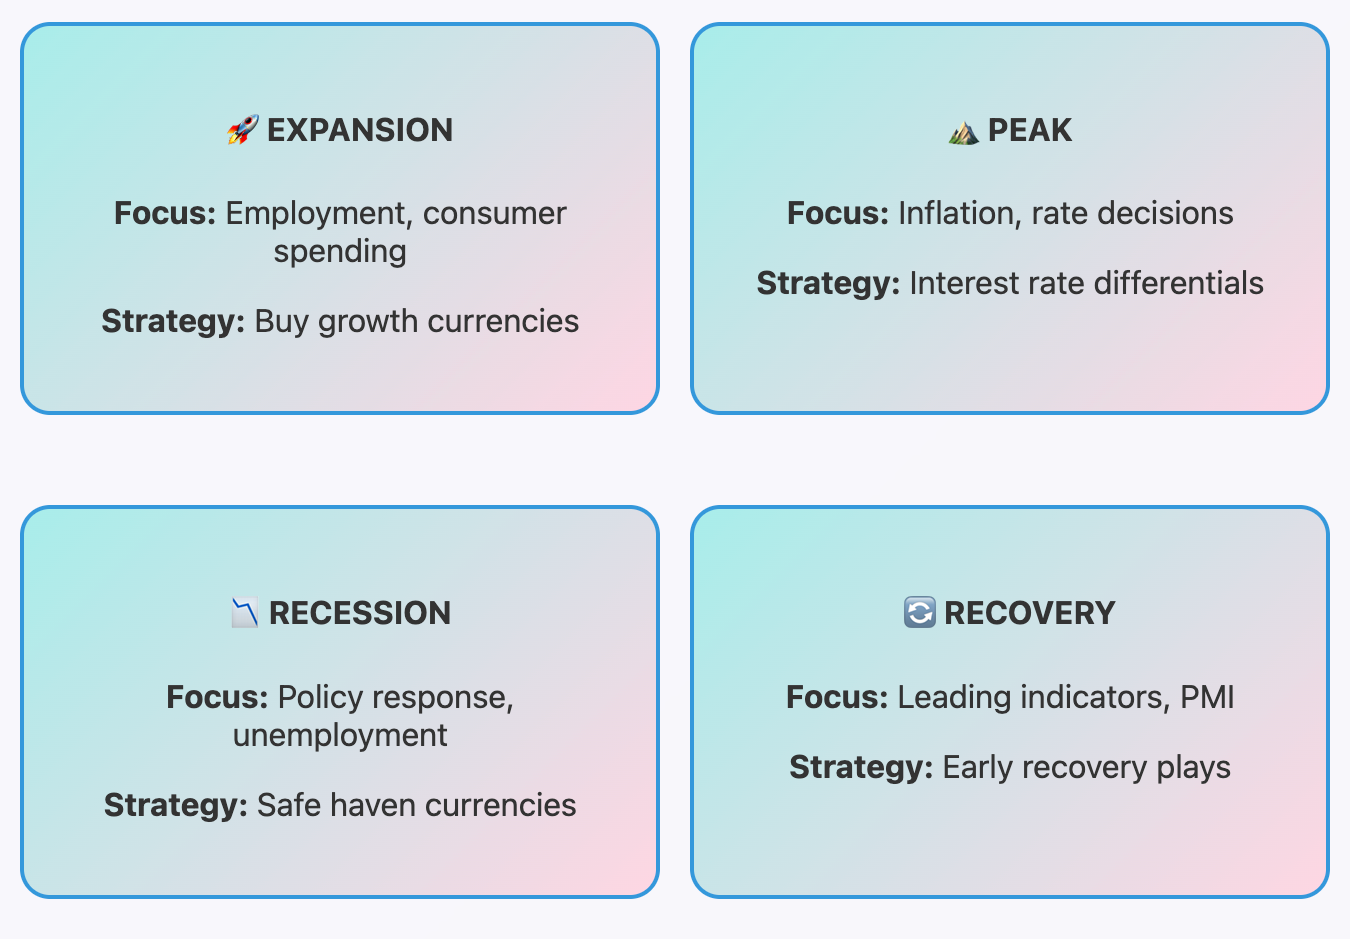
Indicators to watch: Unemployment, retail sales, business confidence surveys, industrial production
Trade strategy: Buy currencies from countries with strong employment growth and increasing consumer confidence
Peak Phase: When economies achieve full employment, inflation becomes the prevailing issue. Central banks tend to increase interest rates in order to prevent overheating, so interest rate decisions and inflation data are critical.
Key numbers to look for: CPI, PPI, central bank talks, wage growth
TradeR recommendation: Interest rate list trading strategy: Play interest rate differentials and inflation standpoint
Recession Period: In periods of financial downturn, governments and traditional banks enforce stimulation. Attention turns to policy response, jobless data and recovery signals.
Things to watch for: Government spending, central bank stimulus, unemployment claims, manufacturing PMI
Trading strategy: Safe havens usually outperform, risk appetite-related news in focus, potential policy intervention announcements to watch for
Recovery Phase: Indications of early economic recovery take the fore. Leading indicators become more important as markets try to predict the turning point.’
What to watch for: Manufacturing PMI, housing starts, consumer confidence, early employment indicators
Trade strategy: Long the currencies of the first-in-first-out economies.
Adapting Your CFD Strategy
During Expansion: As trends develop, add into positions slowly; Be in the growth currency.)
At Peak: Employ hedging as volatility spikes and policy uncertainty escalates.
In a Recession: Cut position sizes, look at haven assets and wait for a clear policy response.
On Recovery: Add size for recovery plays while keeping defences.
Case Example: 2020 COVID-19 Market Reactivity The 2020 novel COVID-19 originated in Wuhan, Hubei, China and spread, eventually receiving worldwide attention and was considered a deadly pandemic.
What made the pandemic such an unusual cycle disruptor is that things change when the world breaks down in a crisis:
USD action: Spiked first as a haven and then dropped under the weight of huge fiscal measures. Gold reaction: Consistently big buyers in the name of stagflation during the time of monetary expansion. Oil volatility: Crashed on a lack of consumption, then rallied on reopening.
This period demonstrated that traditional fundamental relationships can break down during extremes, necessitating the trader to adjust his/her analytical framework.
Takeaways: Let Your Target Analysis Adapt to the Market. The priorities that matter most in expansion look night and day different from those in recession.
Creating Your Fundamental Analysis in 6 Steps
Developing a method to approach fundamental analysis reduces the emotion associated with trading and allows for a more consistent market perspective.
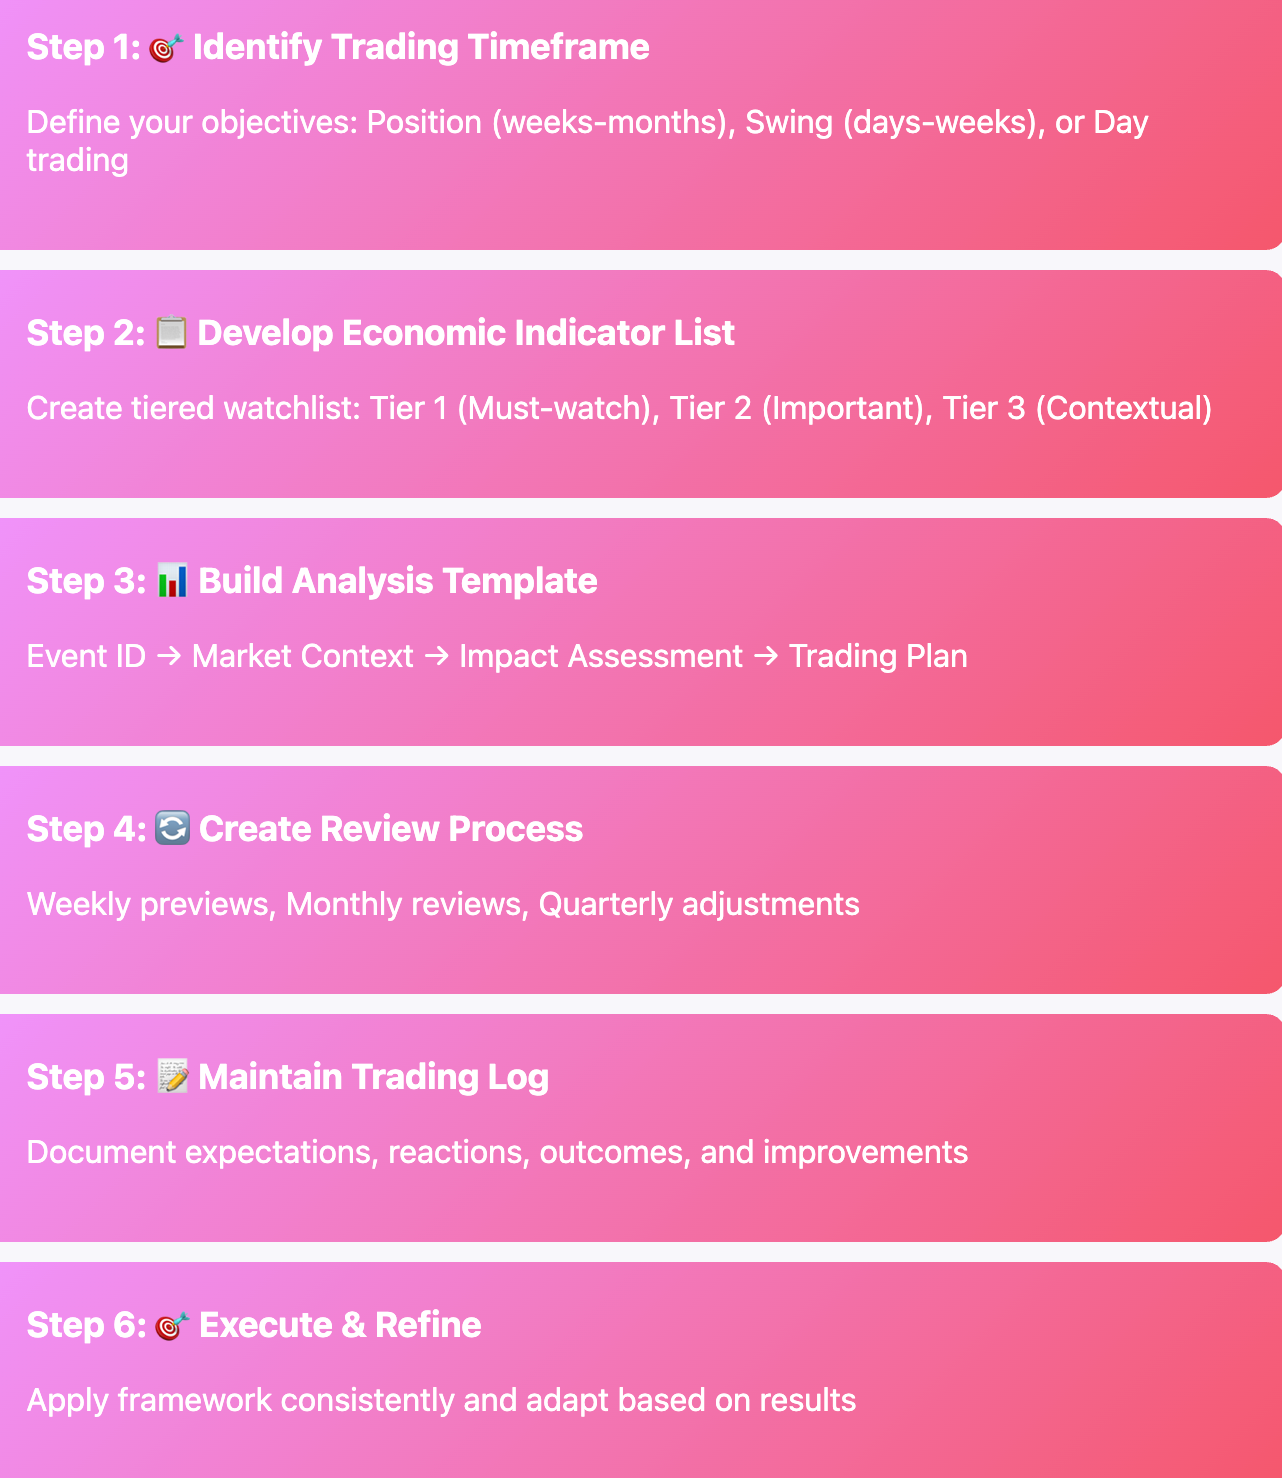
Step 1: Identify your trading preferences and timeframe
Define Your Objectives. Before building a framework, talk through your goals:
• Position trading (weeks to months): Follow longer-term trends based on fundamental analysis.
• Swing trading (days to weeks): Focus on upcoming economic releases and the way they should drive their markets
• Day Traders: Focus on same-day news, and sudden market reactions to economic news.
Step 2: Develop Your List of Economic Indicators
Compile a ranked list of filters depending on your trading bias:
Tier 1 (Must-watch):
-
Central bank meetings and interest rate decisions
-
Employment data (NFP, unemployment rates)
-
Inflation reports (CPI, PPI)
-
GDP releases
Tier 2 (Important):
-
Manufacturing PMI
-
Consumer confidence
-
Trade balance
-
Retail sales
Tier 3 (Contextual):
-
Housing data
-
Business investment
-
Regional economic surveys
Step 3: Build Your Analysis Template
Do the methodology in this framework:
Event Identification:
•What economic release is upcoming?
• What’s the market consensus?
• What are some surprise and not-so-surprise scenarios?
Market Context:
• Where are we in the economic cycle?
• How do these numbers fit into the larger economic story?
• What are other major themes in the markets?
Impact Assessment:
• Which currency pairs are most likely to be influenced?
• How big a difference do you think the market will make?
• Are there any levels at which technical factors could exacerbate the move?
Trading Plan:
•What is my directional bias?
• What is my entry and exit strategy?
•How will I manage risk?
Step 4: Create an Ongoing Review Process. Slot time into your schedule to review your tactics and strategies regularly.
Weekly reviews: Don't know whether an economic release will affect the WYRPreview Trade Management. Predict whether an economic release will affect the market and your trade.
Monthly Review reviews how your fundamental analysis has held up and how you can improve.
Front End: Analyse major economic trends and alter your framework according to market conditions.
Responses: You need to do a weekly line study where you identify your Core 5, and I would spend 5- 10 minutes fertilising them daily in the short run until they have a deviation in the response on medium of 5 points that can be held when greater volatility is not in play.
Step 5: Keep a Trading log book
Document your analysis and decisions:
•Pre-event expectations and reasoning
• How the market reacted versus what you predicted
• What worked well (and what didn’t).
• Ideas for handling a similar future situation
Sample Analysis Template
Event: US CPI Date: [Date] Time: [Time] Rating: Market Context: Fed on hold, inflation becoming a concern Expected Impact: High Tradable Currencies: USD crosses Intended Strategy: Buy USDJPY if CPI > 3.3, Sell if < 3.0 Risk Management: 2% account risk, position size reflects Forex Volatility Index (2%)
Case Study: FOMC Meeting Preparation
Pre-meeting Analysis:
•Economic backdrop assessment
-
Market expectations survey
-
Technical level identification
-
Risk scenario planning
During the Meeting:
-
Real-time reaction monitoring
-
Deviation from expectation assessment
-
Position adjustment decisions
Post-meeting Review:
-
Actual vs. expected outcome analysis
-
Market reaction evaluation
-
Framework refinement opportunities
Takeaway: Do you have a strategy? Having structure in place minimises the emotional factor and keeps you consistent.
FAQ: Common Questions from Beginners
Q. What is superior: fundamental or technical analysis?
Neither is “better” by default – they have different uses. Fundamental analysis helps you to understand why markets move and identifies long-term trends, while technical analysis gives you a bit of timing and risk management. The best traders combine both methods as an integral part of a holistic way of thinking. As I like to say, fundamental analysis is your strategic compass and technical analysis your tactical GPS.
Q: What is NFP?
NFP tracks changes in the number of people employed in the US, excluding farm workers, government employees and non-profit organisation workers. It comes out each month and is important because jobs directly impact consumer spending, which is about 70% of the United States economy. Positive NFP numbers, which are usually above 200k, tend to strengthen the USD, and price tends to move up, while a decline in NFP numbers can lead to USD weakness, and prices may rally.
Q: Why does a high CPI sometimes lead to a fall in a currency?
This counterintuitive response happens for a few reasons:
• Managing expectations: Traders may sell the currency if CPI is strong but is lower than market eexpectations• Policy uncertainty: Extremely high inflation could unsettle markets when they are concerned about the economy overheating
• “Buy the rumour, sell the news”: Traders may have already positioned themselves for the expected result and book profits following the release.
• Future fears: Strong inflation could suggest future economic challenges
Q: Can I study fundamental analysis without out economics diploma?
Absolutely! An economics background is useful, but not essential. Concentrate on becoming familiar with the relationship among different currencies and the changing patterns of the economy. Begin at the beginning: interest rates, inflation, employment, G.D.P. The basic idea wasn't taught in their cheap course or "mentorship. The secret is learning and doing on an ongoing basis.
Q: With how many years does one get roughly competent in fundamental analysis?
It takes around 2-3 months for most traders to understand the basics and consolidate them through practice. It doesn’t take long to develop the common sense necessary to understand the complexities of markets and economies, but in a typical case, we estimate such intuition is formed after about 6-12 months of real-time market participation. The secret is to get started simply, concentrate on big features and only increase the complexity once the understanding deepens.
Q: Is it wise to trade right after an economic release?
For beginners, many find it more rewarding to wait 15-30 minutes following big releases, which allows for volatility to settle and for a clearer direction of the market to emerge. Advanced traders may choose to trade the initial reaction, but this entails greater risk and advanced abilities. I think that's the most logical, and hopefully profitable, because you would combine fundamental analysis for bias with technical analysis for entry timing.
Takeaway: It proves that anyone willing to spend some time learning and internalising the cause-and-effect relationships of the economy can learn how to do fundamental analysis at a professional level. Begin with simple things and slowly make more complex subjects with practice.
Conclusion
There is an old investing adage that says Learn to 'atomise' fundamental analysis is your first step to understanding the 'why' of the forex market moves. Technical analysis can let you know when to get into a trade, but fundamental analysis tells you the “why” to a currencyÂ’s future value or lack thereof.
In our guide, we’ve discussed how economic indicators such as GDP, employment figures, inflation, and central bank actions lay the groundwork for currency movements. We’ve observed how those elements all come together in different market cycles and how successful traders create systematic mechanisms to analyse and trade off of fundamental information.
Success isn't about picking one from fundamental versus technical analysis, but knowing the two are related, or conjoined. It is the strategic direction of the market that information can give you –it tells you which currencies should be strong and which should be weak, based on the economic data and events. Technical analysis gives you the tactical aspect – it helps you time your entries, manage risk, and maximise your trading decisions.
After all, even the most complicated economic relationships are understandable through regular study and discipline. Begin with the basics: follow a single economic indicator for a currency pair that you have an interest in; observe the way the market moves at the time of the release, observe the patterns, and then slowly build up your knowledge of economic cause and effect.
Take Action Today
Start Your Journey:
• Pick one economic indicator you will follow every week this week
• Create alerts for key central bank meetings and employment data
• Be sure to warm up to how markets respond both to economic surprises and expectations
Continue Learning:
• More forex trading guides and resources in the blog post section
• Learn from REAL-TIME examples so you can learn how to apply fundamental analysis to any market.
• Connect to the traders and share ideas, insights and strategies
Practice Risk-Free:
• Practice fundamental analysis with Tradewill, for free, without any financial risk
• Put your economics forecasts to the test using virtual money
• Develop confidence in your analysis before trading live
Stay Informed:
• Get the weekly macroeconomic newsletter from our columnist by clicking here.
• Get regular updates on the most important economic events and how they can affect the market
• Use advanced fundamental analysis tools and resources.
Forex rewards those business owners who know the economy and who can anticipate how the value of certain currencies will change. So start with fundamental analysis as your base, and add in regular practice as your way forward, and you are all set to navigate the adventurous world of trading forex.
Your success journey begins with getting back to basics. Begin your journey today.
Disclaimer: The content of the blog does not represent any position of Trade W, does not serve as any trading-related decision advice, and does not endorse any third-party.