

 Trade W
The fast-moving world of forex trading can feel confusing when you're attempting to understand the prices that keep changing all the time. Every single second, currency pairs are either moving up or down or both, and making sense of it all in any kind of orderly fashion is a real hat trick for anyone attempting to do it because, quite frankly, it is doing the impossible.
And yet, this is the very basis of trading in any market, and forex trading is no different. And so, there are tools that traders use to try to get a handle on it all.
No matter if you are a total newbie to the world of trading who is just trying to grasp the basic concepts of market trends or if you are an intermediary trader who is attempting to tune up your already existing trading plan and strategy, understanding moving averages is crucial to your success in forex trading. This guide is intended to take you from basic concepts concerning this indicator to more advanced ways of using it.
What Is a Moving Average?
A moving average is a tool for technical analysis that determines the average price of a currency pair over a defined duration. You can consider it a mathematical confines mathematical filter that takes price changes over a defined duration and smooths them together to yield a resultant change that, somehow, seems more trend-like than anything you would get from just looking at price changes. It, therefore, yields a price progression concept that gives one the illusion of seeing the price as being more trend-like.
Identifying trends is the main thing a moving average does. It does this by eliminating the random price movements that happen from minute to minute. If you look at a straight price chart, you see countless up-and-down movements that can be very distracting. The moving average shows you the picture that's a step further back, or in some cases, a step further forward. In the case of the picture that's a step further back, the moving average shows you the part of the trend you're in that you can see with more clarity.
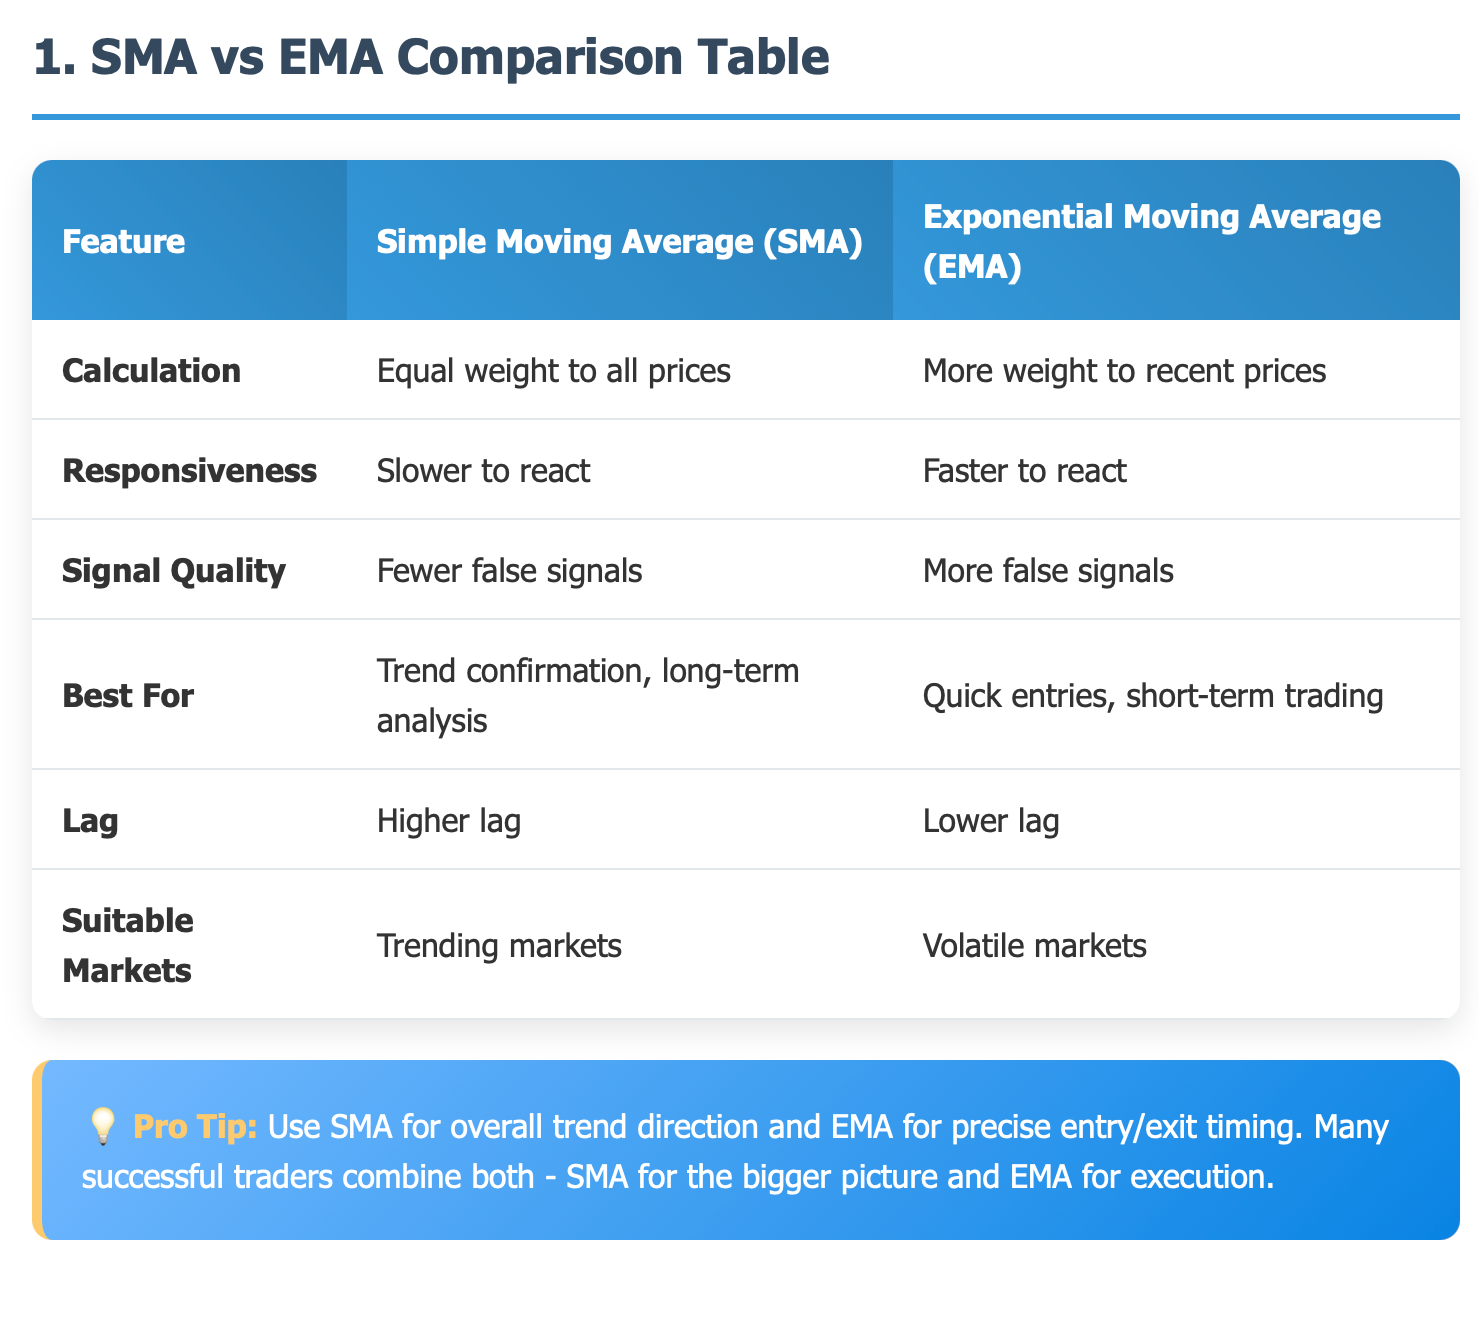
There are two principal kinds of moving averages that all forex traders ought to comprehend:
Simple Moving Average (SMA)
This derives the arithmetic mean from the closing prices over a certain number of periods. For instance, a 20-day SMA takes the sum of the last 20 days' closing prices and divides that sum by 20.
Exponential Moving Average (EMA)
This provides more leverage to new pricing, making it more obedient to the present marketplace. The EMA does what the SMA does, but it does it faster.
Spotting the overall market direction is especially handy with moving averages. An uptrend is when prices consistently trade above the moving average. A downtrend is when prices persistently stay below the moving average.
Everyday Example
Consider your last five math quiz scores: 80, 85, 78, 90, and 92. Rather than concentrating on just your most recent score (92), the score that would give a better overall impression of your performance would be the average score (85). In the same way, traders use moving averages to take the price data of a currency pair and understand the overall direction in which it is moving, rather than getting distracted by individual price movements. Young 485.3ier 51
Professional Trading Example
An individual who makes money by buying and selling currencies might observe the EUR/USD pair using a moving average of 50 days to garner evidence concerning the long-term price direction of the pair. If the price stays consistently above this 50-day moving average, a trader would use that information to conclude the pair is in a long-term uptrend and might look to buy the EUR/USD pair on price dips.
Different Types of Moving Averages
Understanding the differences between SMA and EMA is crucial for creating effective trading strategies. Each indicator has its own special set of qualities that make it suitable for particular market conditions and trading styles.
Simple Moving Average (SMA)
The Simple Moving Average works by taking the average price of a stock over a set number of past periods, usually days, and then plotting it on a chart. To plot the SMA for today, you would take the price of the stock at equal intervals over the last 30 days (if you were using a 30-day SMA) and average those numbers. Then you would use that average as a point on the graph for "today" in your SMA.
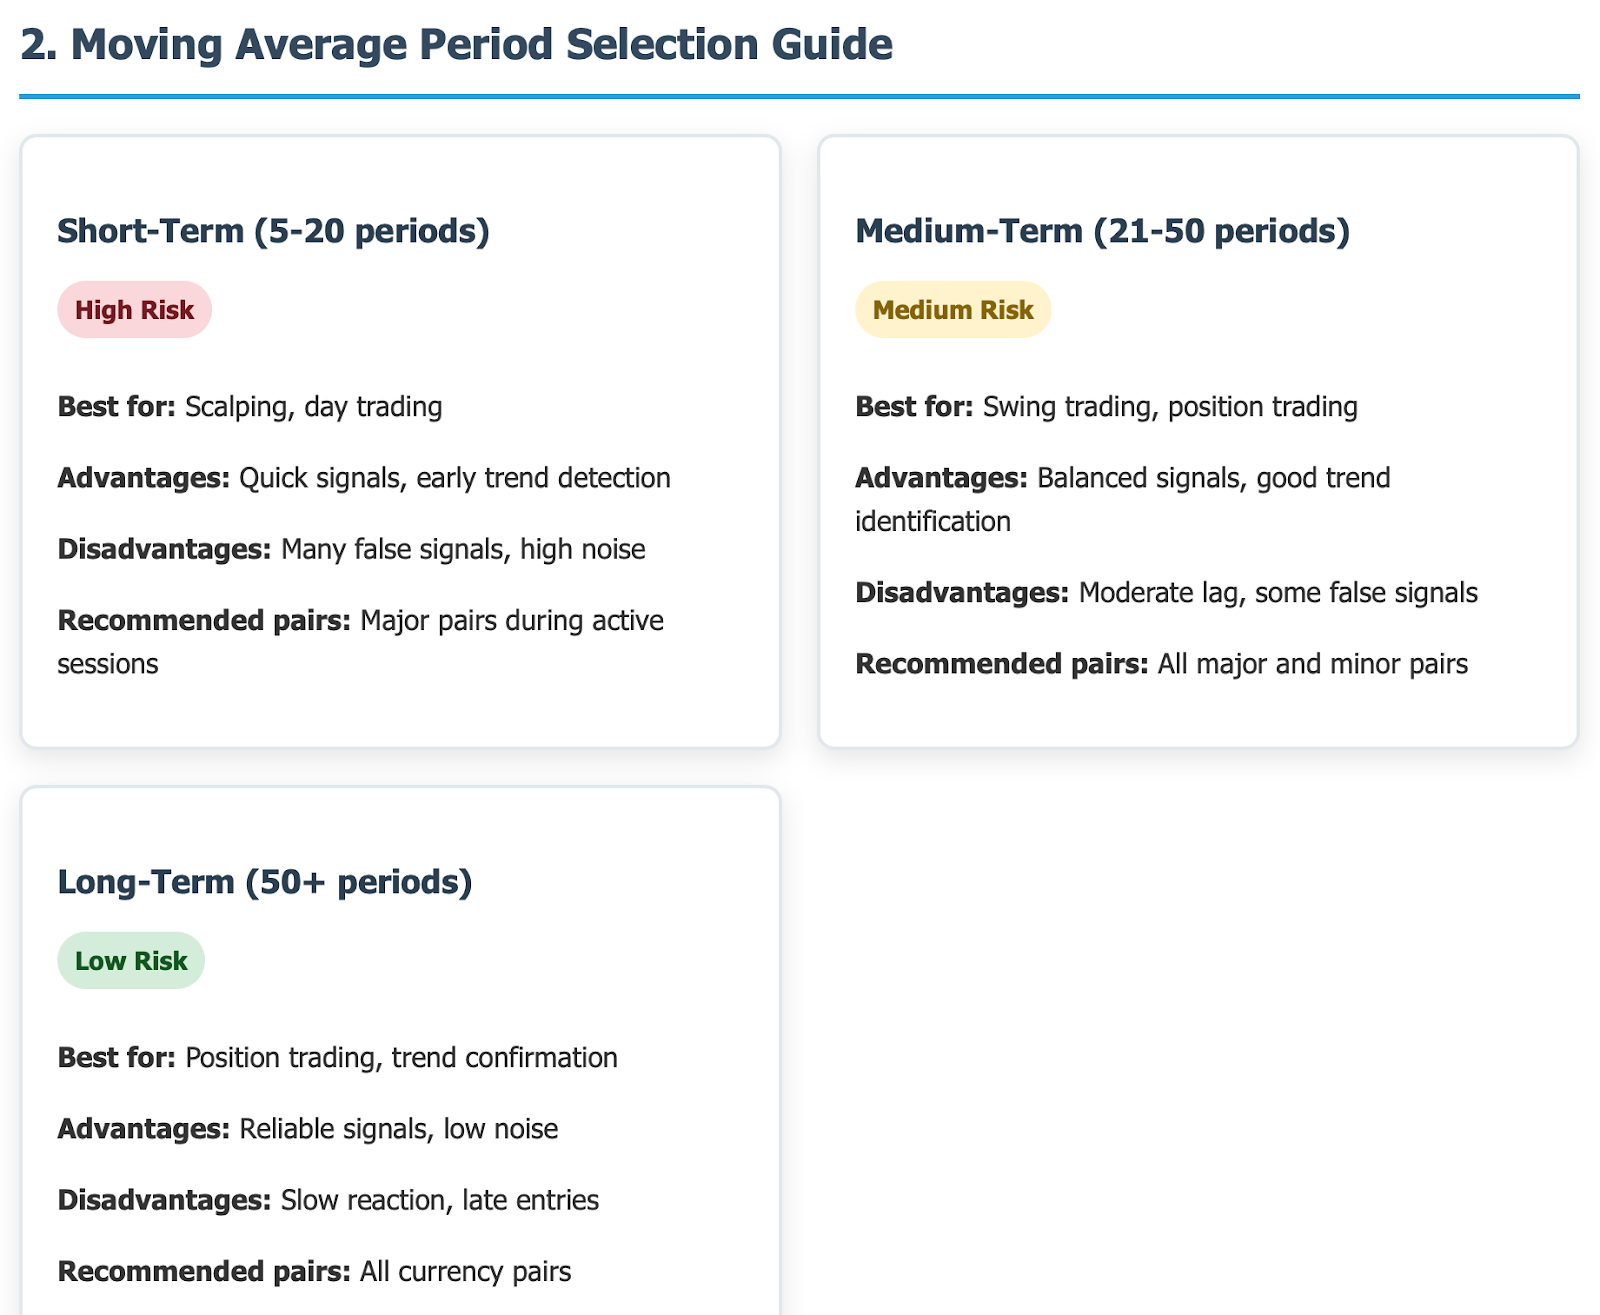
Commonly used durations for SMA are:
-
Simple moving average over a period of 10 days: For analysis of the short-term trends.
-
SMA of 50 days: Used for medium-term trend analysis.
-
200-day SMA: Used to confirm the analysis of long-term trends.
Exponential Moving Average (EMA)
The EMA is more responsive to new price information than the SMA, and it is also more weighty in this respect. This makes it a more trader-friendly tool in the type of market price change for which traders really want a tool. Being early is good, and not being late is even better. In that sense, the new price information is just working its way into the average as it should, without anything apart from the current price being allowed to influence the average. Directive changes for the price the average is working on accompany all sort of price changes for all sorts of reasons. In a sideways market, the more probable market/average relationship works against the average.
The EMA is favored particularly by:
-
Day traders who enter and exit positions rapidly.
-
Individuals who conduct short-term trading strategies.
-
Market participants in unstable environments, where split-second responses are essential
Choosing Between SMA and EMA
Choosing between the Simple Moving Average (SMA) and the Exponential Moving Average (EMA) comes down to what market you are in and, more critically, your trading style. Push for the SMA if you want a smoother, more stable signal. It's optimal for clearly trending markets with minimal noise and when you're concentrating on long-duration position trades. To avoid false breakouts, you might also push for the SMA. Go with the EMA if you need a quicker reaction to price changes. It's well-suited for volatile markets that are ramming forward in a hurry and for when you're somewhat more active, i.e., scalping or day trading. To catch early trend reversal signals, you might also favor the EMA.
Everyday Example
If the most recent test you took is given double the weight of the previous tests when calculating your grade, then your average is way less certain in terms of any test performance you do that's either good or bad. That's how exponential moving average (EMA) is different from regular moving average (MA). It's not as huge when you go in the switch direction of EMA; it's way huger when you go in the switch direction of MA.
Professional Trading Example
A day trader could use a 9-day EMA along with a 21-day EMA to catch early trend reversals in USD/JPY. The faster 9-day EMA crossing above the 21-day EMA could signal a buying opportunity. A swing trader, on the other hand, might prefer to use a 50-day SMA for USD/JPY analysis, accepting slower signals in exchange for more reliable trend confirmation.
How Traders Use Moving Averages in Forex
There are many functions served by moving averages in the field of forex trading. They confirm trends. They also generate signals needed to enter and exit trades. There are other functions moving averages serve, too. If you understand how and why these different functions work, you can effectively use moving averages in your own trading. This chapter covers all of that.
Trend Direction Confirmation
The most fundamental application of moving averages is in identifying the direction of the market. When the price is above the MA, it shows that a bullish trend is in effect; when the price is below, a bearish trend. This is a simple rule that forms the basis for many successful trading strategies.
Moving Average Crossover Strategies
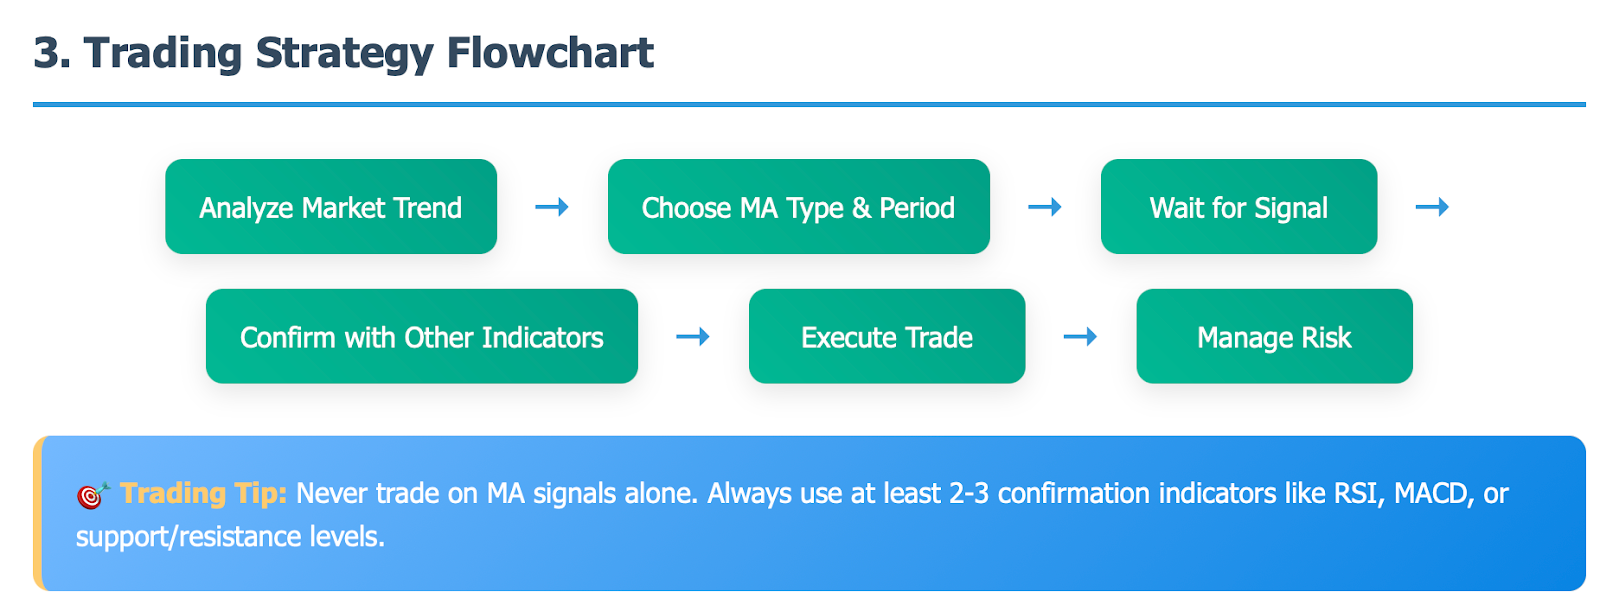
MA crossover strategies use two moving averages of different periods. The shorter MA crossing above the longer MA generates a buy signal; the shorter MA crossing below the longer MA generates a sell signal.
Well-liked crossover combinations are:
-
Golden Cross: 50-day MA crossing over the 200-day MA (a bullish sign)
-
Death Cross: 50-day MA crossing under the 200-day MA (a bearish sign)
-
Fast crossover: 10-day MA crossing over the 20-day MA (this gives quicker signals)
Dynamic Support and Resistance
Dynamic support and resistance levels are provided by moving averages. When the price pulls back in an uptrend, the moving average can be a support level. When the price has a rally in a downtrend, the moving average can be a resistance level. This is why moving averages are useful for a number of important functions in trading:
-
Identifying potential entry points
-
Setting stop-loss levels
-
Determining take-profit targets
-
Combining MAs with Other Indicators
Professional traders almost never employ moving averages solely. They are much more commonly used in conjunction with other tools. Some combinations seen more often than others include:
MA + RSI: Confirming overbought/oversold conditions with the RSI when the security's price touches the moving average.
MA + MACD: Using the moving average to determine trend direction and the MACD to see when the security's price is likely to make a big move in the direction of the trend.
MA + Price Action: Assessing the reliability of a security's moving average by using price action techniques at the moving average level.
Everyday Example
Consider the path of a student's GPA over time. It's a good approximation of a curve drawn with the following segments, from left to right:
1. Climbing upward toward the first threshold;
2. Plateau at that threshold;
3. Climbing again for a while (the second slope) toward the second threshold;
4. Falling for a while (the third slope) back down toward the first; and finally
5. Climbing back up to the first threshold once again.
Now, this is only an approximation of a piece of path-dependent function from math class, but it's a good way to think about it. And it's even a decent way to perform some visual analysis of the changes in the path. Think of the price of a stock both rising and falling in a random walk extending monotonically over time.
Professional Trading Example
The Golden Cross strategy is a classic MA application. It signals a bull market and occurs when a short-term moving average crosses above a long-term moving average. The most followed version of this simple strategy is when the 50-day moving average (MA) crosses above the 200-day MA in the currency pair of your choice (e.g., GBP/USD). It often leads to significant bullish momentum and tends to precede major rally phases. As always, ensure that you combine this signal with other technical analysis tools before punching the buy button.
Pros and Cons of Moving Averages
1. Clarity: The hurdles imposed upon charting clear, straightforward, and unambiguous indicators of the direct and unambiguous application of moving averages are greatly fallen. Partly this is because the average itself is the clearest possible indicator, a clearly defined computation with a clearly defined application.
2. Comprehensiveness: They capture an enormous amount of price action and do not make an excessive number of assumptions about the state of the market.
3. Smoothness: Averaging a small number of figures is always slick, and when it is averaged and plotted, it assists in seeing the trend. In trend-following systems, we generally use moving averages. They inform us about the trend with little signal noise.
Advantages of Moving Averages
The moving average serves one primary purpose, and that is to bring clarity and simplicity to the task of trend identification. For all its uses, a moving average is simply an average that is recalculated as new data becomes available. In essence, it is an indicator that is smoothed out, to a certain degree, in order to make the current apparent trend more visible.
2. Emotional-baseless trading decisions: i.e., pure math, good signals, and clear, as well as objective, interpretations, which, we hope, as a result, narrows the number of moments in which a trader has to make a judgment call—right or wrong—when, after all, the decision could be made by a signal we send instead. The cheaper, the better. MAs in this context are impersonal decision-makers. Traders rely on them, and they rely on clean, clear signals and objective judgment calls for the most part.
3. Noise Reduction : The moving average is a statistical tool to smooth data. It works by taking the price of an instrument and using this price along with other previous prices to create a new price that has less random variation and way more clarity than the original price. The moving average can be used for noise reduction. Traders can use it and still get the noise that they need if the moving average is put at a specific location on the chart.
4. Flexibility: Moving averages are deployable in any time frame and for all currency pairs, permitting them to accommodate a great many trading styles, from the styles that demand quick in-and-out trades (scalping) to the kind that plods along paying off over the long haul (long-term investing).
Disadvantages of Moving Averages
1. Properties of Moving Averages: Moving averages trend changes. They do this well but too late. In other words, they are indicators of trend changes that lag. You cannot chase a trend if you cannot see it. Waiting for a moving average to tell you a trend exists is waiting too long.
You need to catch a trend when it is just beginning if you want to see it. A moving average is not good for this.
To ride a trend, you must enter a trade, which means you have to see the trend before it is clear to a moving average. You might think part of the reason for this is that a moving average, being an average, requires some amount of movement to be apparent.
2. Sideways Markets: Send False Signals Chuck or sideways markets can have a lot of crossover signals generated from moving averages that are false. This can mean a lot of whipsaws and losses.
3. MAs Can't Predict: MAs can inform us only about past events; they cannot inform us about future events. They can verify a trend; they cannot predict a trend.
4. Parameter Sensitivity: The effectiveness of moving averages is strongly contingent on the appropriateness of the time span selected. This choosing spans a wide range of potential settings across various market configurations.
Everyday Example
The average of your prior test scores predicts your next score fairly well, but only if you're not mixing it up too much from test to test. If you're consistently pulling A's, then your next score will likely be an A. If you're consistently pulling D's, though, your next score will likely be in the same neighborhood as your last score. What the average score isn't, in either instance, is a good indicator of your true capabilities. It's the best you can do to use past performance to project future performance.
Professional Trading Example
In 2023's late ranging period for EUR/USD, the traditional method of using moving average crossovers generated a number of false trading signals. These signals told traders to go long or short at various points in the range when, in actuality, you should've just been trading the range. If you were using the moving average crossover method and ignoring all other forms of analytic tools, you could've seen some significant losses during this time.
How to Choose the Right Moving Average Strategy
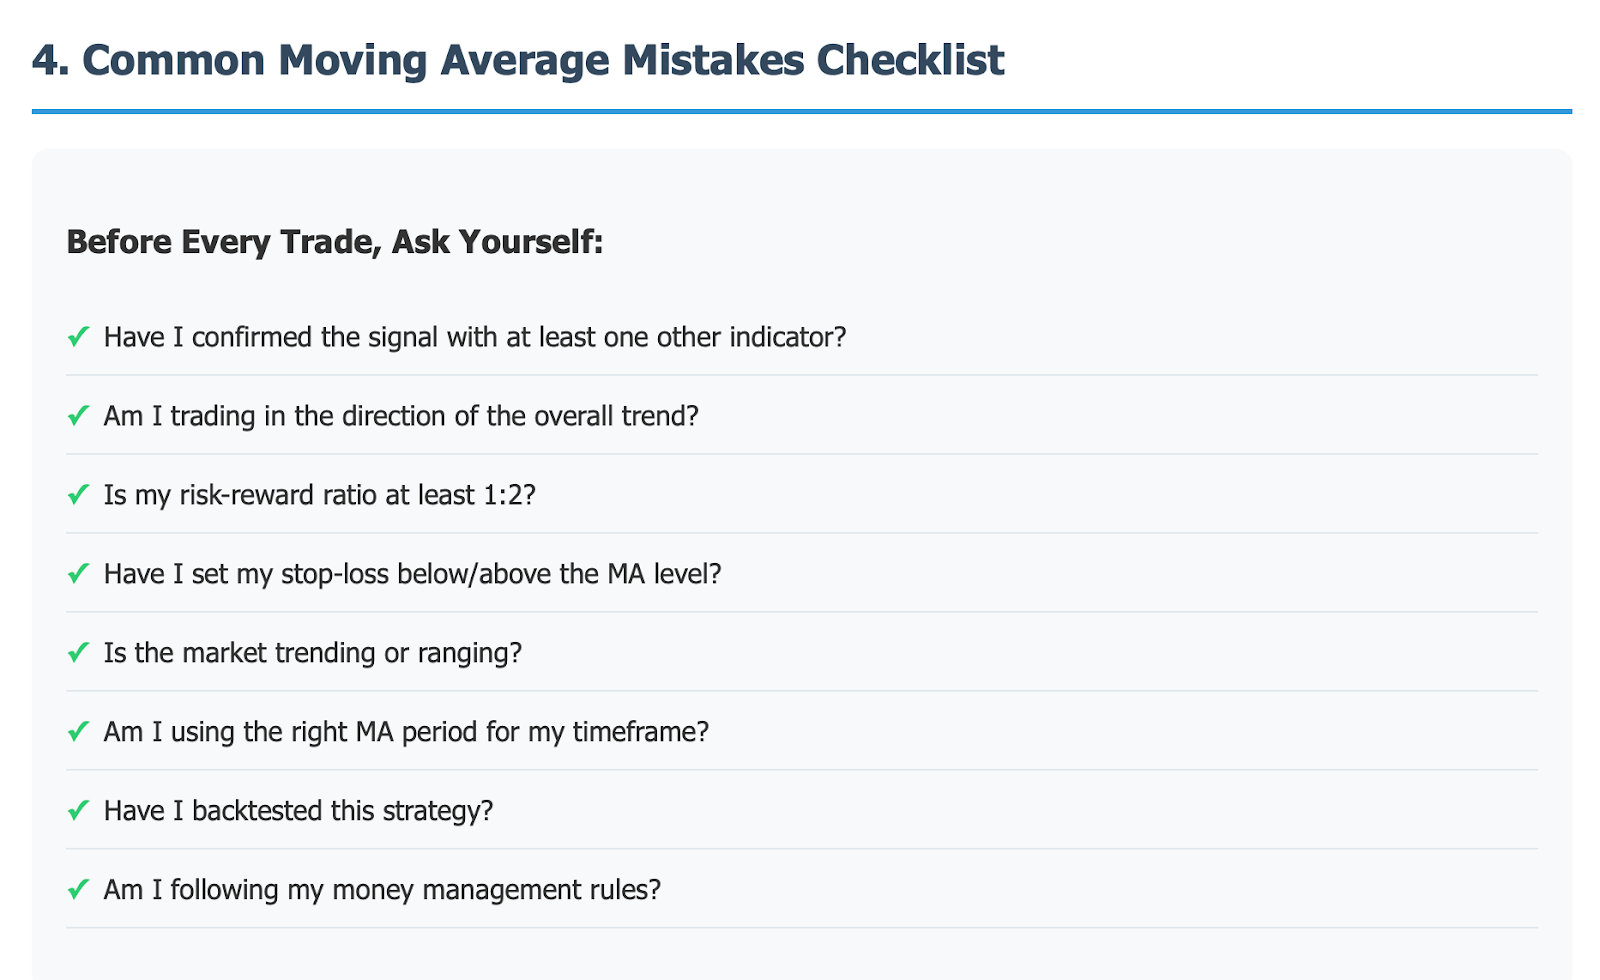
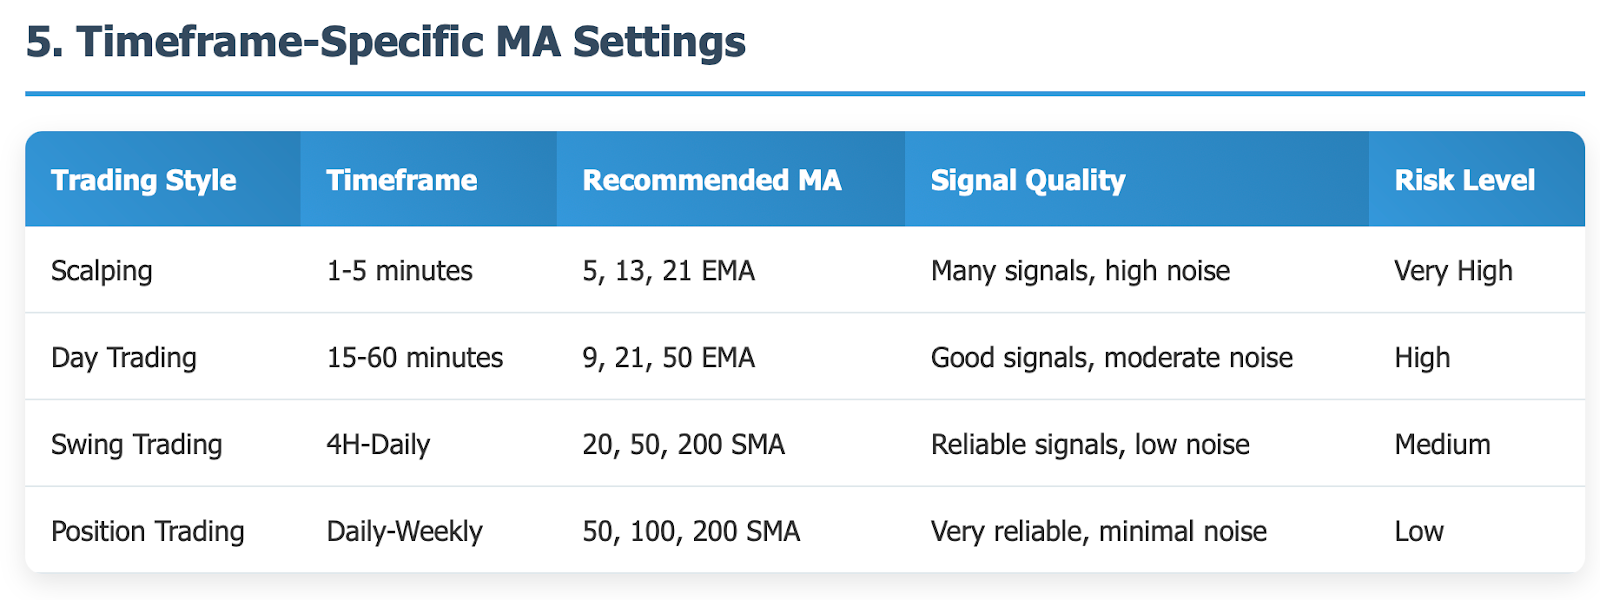
Choosing the correct moving average strategy is about more than just selecting a number. It requires consideration of your trading style, risk tolerance, and the particular nuances of the market you're navigating. The moving average is a highly adaptable tool, and the "best" moving average setting is the one that works for you.
Timeframe Considerations
-
Scalping (1-5 minute charts)
-
Use fast EMAs: 5, 9, 13, 21
-
Concentrate on rapid entries and exits
-
Tolerate a higher rate of false signals for the sake of speed
Day trading (15-60 minute charts)
-
Combine fast and slow EMAs: 9/21, 12/26.
-
Balance speed with reliability.
-
Use shorter periods for volatile pairs.
-
Swing trading uses 4-hour to daily charts.
-
Reliable signals are the priority.
-
MA signals are better when you use a slower method.
Trading by Position (using daily to weekly charts)
-
Concentrate on simple moving averages for 50, 100, and 200 days
-
Identify long-term trends more easily
-
Obtain less frequent but more trustworthy signals
-
Currency Pair Considerations
-
Distinct currency pairs show different volatility traits that influence how well moving averages work.
Major Pairs (EUR/USD, GBP/USD, USD/JPY)
Overall, these are more stable.
Standard MA periods tend to work better.
They are less likely to give false signals.
Unusual currency pairs (such as USD/TRY and EUR/ZAR) are more volatile. Higher volatility means we need to make adjustments to how we trade these pairs. Focus on longer time periods. This helps to reduce the noise that you hear during shorter time frames. Also, when using signal filtering, be more selective.
Backtesting and Optimization
Prior to the implementation of any moving average strategy, perform comprehensive backtesting:
Historical Scrutiny: Apply your selected MA configurations to the historical dataset.
Diverse Market Scenarios: Validate the approach's effectiveness over both trending and sideways market conditions.
Money Management: Integrate sensible stop-loss and take-profit mechanisms into the backtesting routine.
Simulated Trading: Get a feel for the approach's operation with a virtual trading account before committing real capital.
Everyday Example
Some students learn best with frequent and brief reviews before each quiz, akin to doing quick exercises for scalping in the market. They need fast, responsive study plans that allow them to review material in the short term but require them to be much more on top of the content in the present than in the past or future. When these learners try to use a comprehensive review plan, it becomes a far too slow and clunky method of learning for them.
Professional Trading Example
An experienced trader could conduct a backtest on an EMA crossover strategy, using the 20-period and 50-period EMAs, to see how well (or poorly) it would have performed on the AUD/USD currency pair from March 2024 to September 2024. The results of such an analysis might show approximately the following:
March-May 2024: EPS = +500 pips
June-July 2024: EPS = -75 pips
August-September 2024: EPS = -400 pips
Interpretation: In backtests, the EMA crossover strategy shows a significant degree of trend-following behavior, which can be advantageous or not, depending on whether the market is in a trending or consolidating state.
Advanced Moving Average Techniques
While gaining proficiency in the basic moving average, there are some advanced methods you can learn to make your trading even better.
Moving Average Ribbons
An average of averages, if you will. Picture a sideways funnel with, say, four tubes in it. In the tube on the far right, as you look at it from the front, is a 5-day moving average. In the next tube over to the left is a 10-day moving average. Next is the 20-day moving average. And, in the tube on the far left (again, as you look at it from the front), is the 50-day moving average. Now picture inside those tubes non-volatile Forex pairs. No risk, no throw on the covers; just 100% pure trading potential. You don't need to be a math whiz, or even a half-a-math whiz, to plot those period moving averages on a chart.
Adaptive Moving Averages
These fine-tune their responsiveness according to market volatility, becoming more and responsive during periods of high volatility and smooth during low-volatility periods.
Volume-Weighted Moving Averages
These take into account trading volume, with more weight given to the periods of higher volume, potentially giving more accurate trend signals.
Multiple Timeframe Analysis
Applying moving averages over various timescales unambiguously pinpoints the prevailing trend and sharpens the focus on the moment in time when a trading opportunity presents itself. This can be done, for instance, by deploying a 200-day MA over a daily chart for an all-out look at the trend's direction, and then simultaneously using a 20-period MA over a 4-hour chart to see the moment when a possible entry or exit trade would be most advantageous.
Risk Management with Moving Averages
When in forex trading one uses moving averages, effective risk management is of the utmost importance; otherwise, losses can accrue at an alarming rate. A moving average is not a lagging indicator; it is a delayed charting tool. A risk management method that is almost universally accepted among traders is the use of stop-loss orders.
Position Sizing
Never risk more than 1-2% of your account on a single trade. Adjust position size based on the distance between entry and MA levels. Consider market volatility when determining position size.
Stop-Loss Placement
Establish stops beneath or above the most recent moving averages. Use the ATR (Average True Range) to figure out the sensible distance to place your stops. Trail your stops using the moving averages as the price moves in your direction.
Take-Profit Strategies
Consider the use of resistance/support levels identified by longer-term MAs. Do not hesitate to take partial profits at these pivotal levels. When at all possible, trail your profits using shorter-term MAs.
Common Mistakes to Avoid
Don't Rely on MAs Alone Too Much Moving averages should not be relied upon too much. They are best used in conjunction with a thorough market analysis. Always take into account: Price action patterns Support and resistance levels Market sentiment Economic fundamentals.
Ignoring Market Context
MA signaling is more dependable in trending markets and less dependable in ranging markets. Relying on MA signaling in the broader market seems less reliable when the broad market is ranged and more reliable when the broad market is trending.
Inconsistent Application
Adhere to the MA parameters and strategy you have selected. If you keep shifting the settings around, especially according to the latest performance, you're going to end up with a wildly inconsistent set of results.
Poor Risk Management
Even the best MA strategy will fail without appropriate risk management. Always employ stop-losses and rules for sizing your positions.
Conclusion
To achieve success with moving averages, the secret is not to seek the "perfect" parameter, but instead to apply what you understand in a consistent, sensible manner as part of a larger trading system. Moving averages can be worked into many trading systems. For some, they form the backbone. Whether you are using the simplest of MAs—a 50-day SMA, say—for long-term trend identification or a complex crossover system for day trading, the MA signals you've been taught to seek should be combined with other technical analysis tools that you've been taught to use in tandem.
Ready to Start Trading with Moving Averages?
Practice and experience are the best ways to master moving averages. A demo account is a great place to test MA strategies without the risk of losing real money. You can play around with different timeframes and currency pairs to see what fits your trading style best. When you're ready, you can take your moving average knowledge to the live market.
Take Action Today:
Test your strategies against data from the past.
Move gradually to live trading with correct risk management measures.
The forex trading journey begins with moving averages. When you learn how to use this fundamental tool, you lay the groundwork for moving on to much more advanced and much more interesting forex technical analysis.
Disclaimer: The content of the blog does not represent any position of Trade W, does not serve as any trading-related decision advice, and does not endorse any third-party.