

 Trade W
The forex market operates 24/5, with over $6 trillion traded daily. In this vast ocean of currency pairs, technical analysis tools serve as navigational instruments for traders. Among these tools, pivot points stand out as one of the most reliable and widely used indicators for determining market direction and identifying key support and resistance levels.
Pivot points have been used by professional traders for decades, particularly in floor trading environments where quick decision-making was crucial. Today, they remain equally relevant for CFD trading and forex markets, helping both novice and experienced traders make informed decisions about market entry and exit points.
This comprehensive guide will take you through everything you need to know about pivot points – from basic calculations to advanced trading strategies. Whether you're just starting your trading journey or looking to refine your technical analysis skills, understanding pivot points will provide you with a solid foundation for making better trading decisions.
What Is a Pivot Point?
A pivot point is a key price level calculated based on the previous trading day's high, low, and closing prices. Think of it as a benchmark that helps traders determine the overall market sentiment and potential direction for the current trading session.
The concept is elegantly simple: if the current price is trading above the pivot point, it suggests bullish sentiment; if below, it indicates bearish sentiment. This makes pivot points particularly valuable for intraday trading strategies, where quick decisions about market direction are essential.
Pivot points serve as static reference levels – unlike moving averages or oscillators that change with every price tick, pivot points remain constant throughout the trading day. This stability makes them reliable anchors for technical analysis, especially when combined with other indicators.
The system also generates support levels (S1, S2, S3) and resistance levels (R1, R2, R3) based on the pivot point calculation. These levels act as potential turning points where price action might reverse or consolidate.
Here's a practical example: Yesterday's EUR/USD traded with a high of 1.1020, a low of 1.0920, and closed at 1.0960. Using the standard formula, the pivot point would be 1.0967. If today's price opens and remains above this level, traders would interpret this as bullish sentiment, suggesting potential upward momentum.
To illustrate this concept with a relatable analogy, imagine you're predicting how many free throws you'll make in basketball today based on yesterday's performance. If you made 7 out of 10 yesterday, that becomes your "pivot point" for today. If you make more than 7 today, you're performing above your pivot (bullish), and if fewer, you're below it (bearish).
The key emphasis here is that pivot points represent a predictive benchmark reflecting market sentiment, not real-time fluctuating indicators. They provide a framework for deciding whether to lean bullish or bearish for the current trading session.
How to Calculate Pivot Points (With Formula)
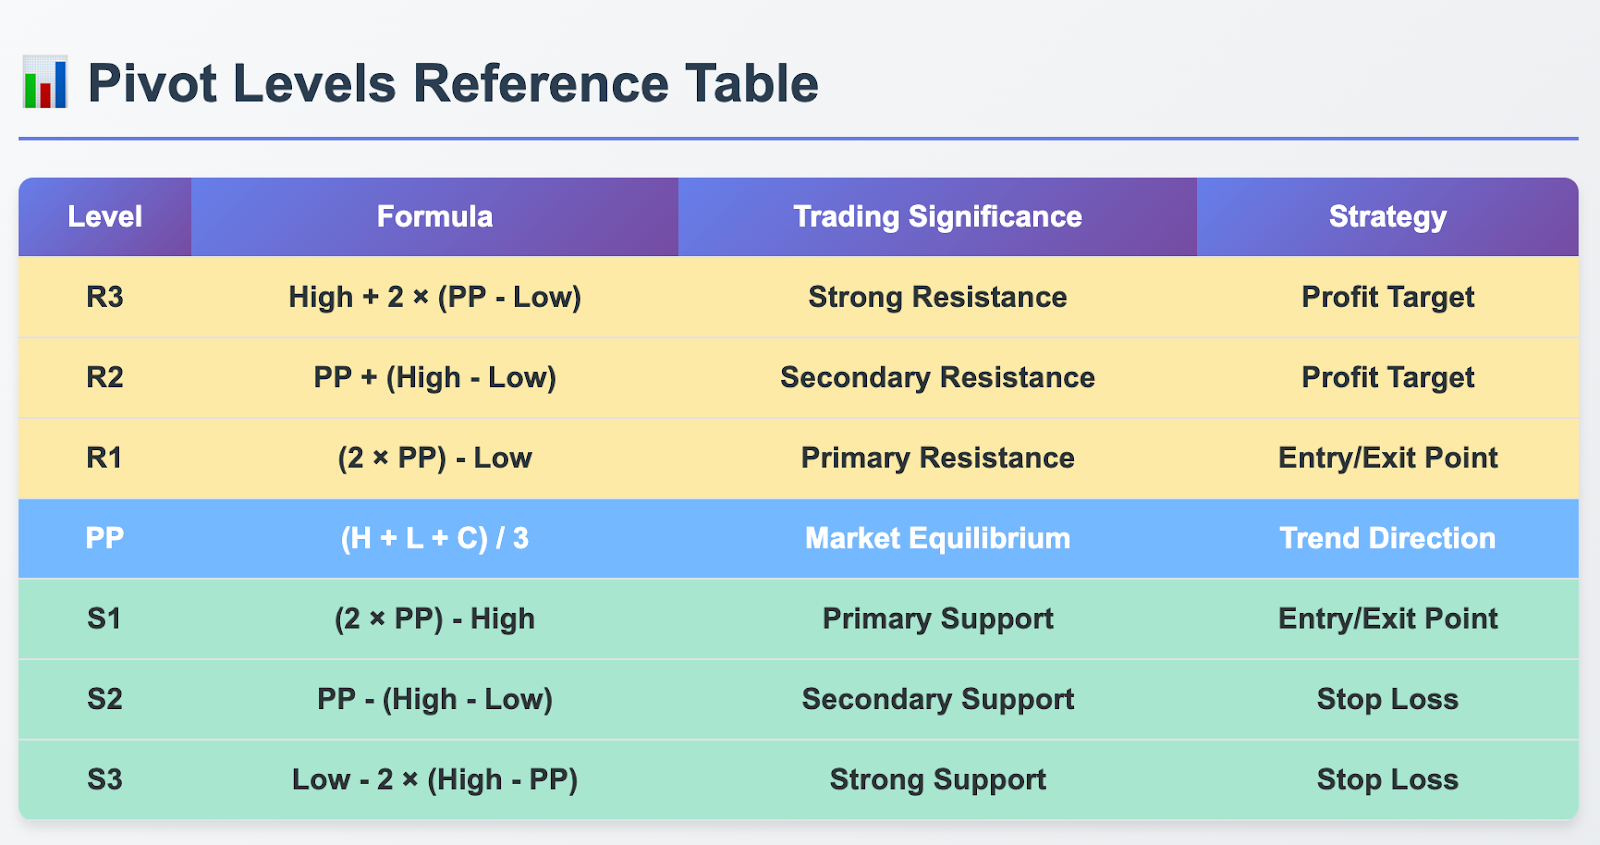
Understanding the mathematics behind pivot points empowers traders to calculate these levels independently and gain deeper insights into market structure. The standard pivot point formula is straightforward yet powerful:
Pivot Point = (High + Low + Close) / 3
From this central pivot point, support and resistance levels are calculated:
R1 = (2 × Pivot Point) - Low S1 = (2 × Pivot Point) - High R2 = Pivot Point + (High - Low) S2 = Pivot Point - (High - Low)
For additional levels: R3 = High + 2 × (Pivot Point - Low) S3 = Low - 2 × (High - Pivot Point)
Let's work through a practical example using Gold (XAU/USD) data:
-
Yesterday's High: 2012
-
Yesterday's Low: 1998
-
Yesterday's Close: 2005
Pivot Point Calculation: Pivot Point = (2012 + 1998 + 2005) / 3 = 2005
Support and Resistance Levels:
-
R1 = (2 × 2005) - 1998 = 2012
-
S1 = (2 × 2005) - 2012 = 1998
-
R2 = 2005 + (2012 - 1998) = 2019
-
S2 = 2005 - (2012 - 1998) = 1991
This calculation reveals that the pivot point sits at 2005, with immediate resistance at 2012 and support at 1998.
While the standard method is most commonly used, other variations exist, including Fibonacci pivot points and Woodie pivot points. However, beginners should master the standard approach first, as it's the most widely recognised and traded by market participants.
Think of this calculation like averaging three exam scores to determine your expected performance level. The pivot point acts as this "central line" – a mathematical representation of market equilibrium based on previous price action.
The beauty of this pivot point formula lies in its simplicity and universal application across all financial instruments. Whether you're trading forex pairs, commodities, or indices, the calculation remains consistent, providing a standardised approach to technical analysis.
How Pivot Points Help Predict Market Direction
Pivot points serve as emotional watersheds in the market, providing clear signals about potential price direction and market sentiment. The logic is straightforward: when price respects and reacts to these calculated levels, it demonstrates their psychological significance among traders.
When the market opens above the pivot point and maintains this position, it suggests that buyers are in control, creating a bullish bias for the trading session. Conversely, when the price falls below the pivot point and remains there, it indicates that sellers dominate, creating a bearish outlook.
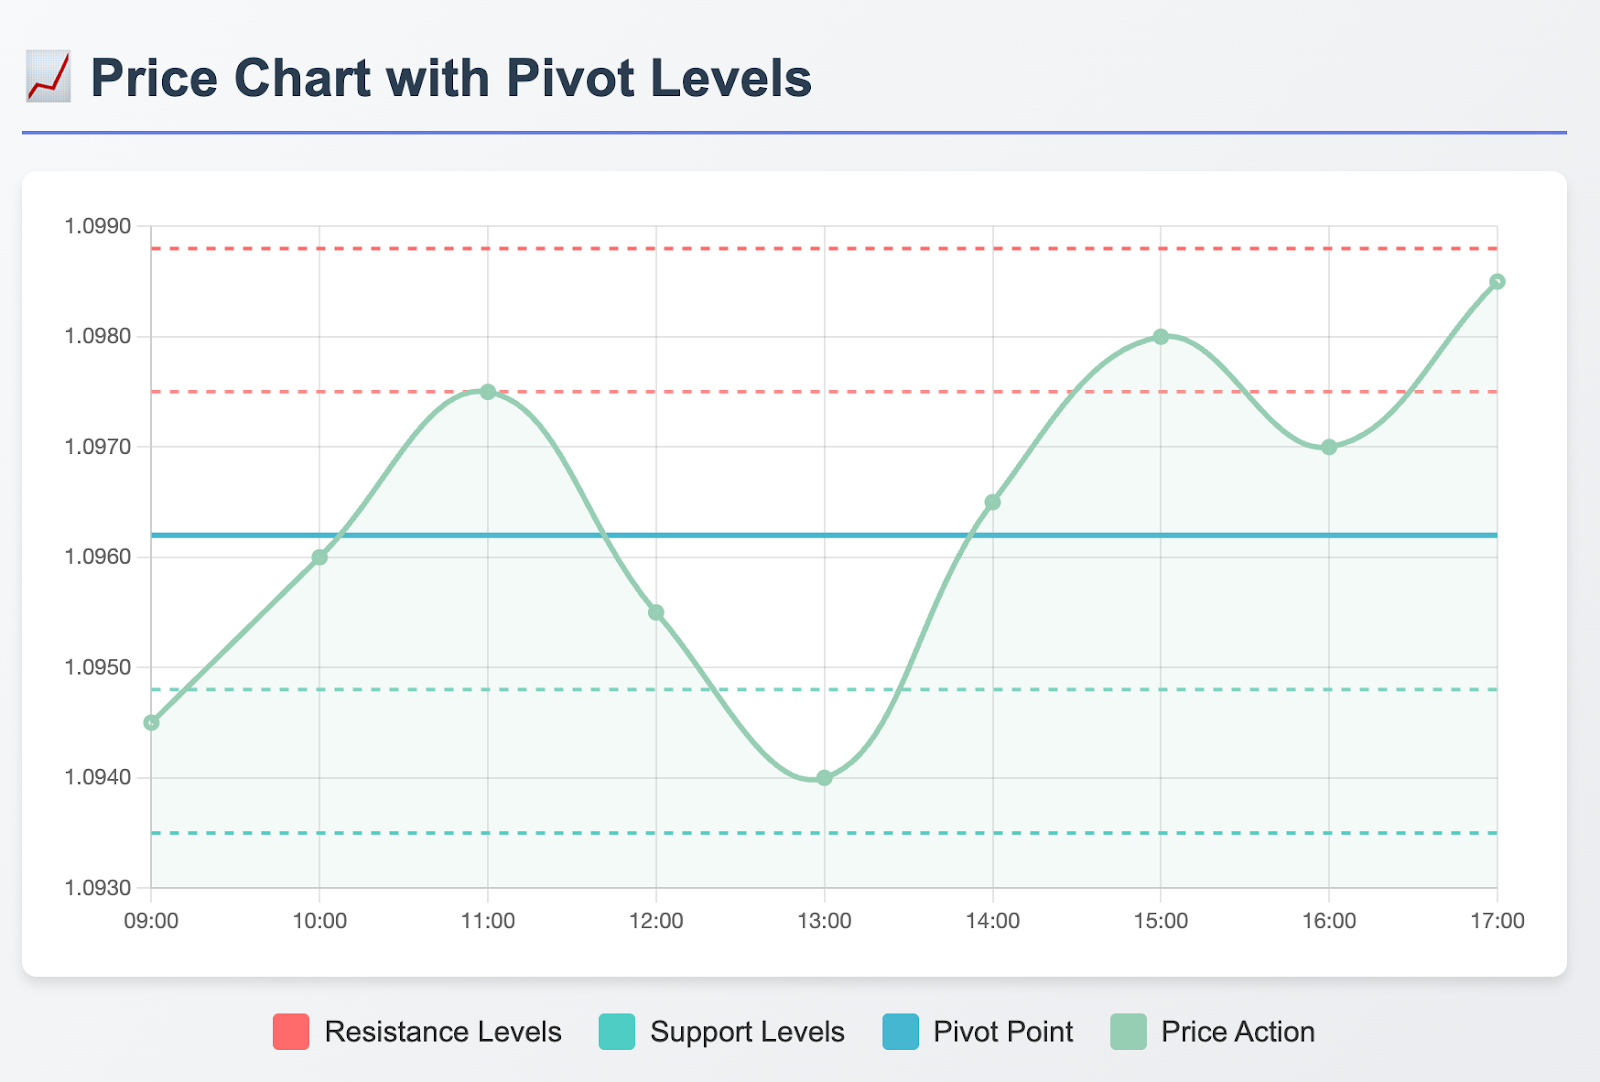
The support and resistance levels (S1, S2, R1, R2) function as natural profit-taking and stop-loss reference points. These levels often coincide with areas where traders place their orders, creating self-fulfilling prophecies as price approaches these zones.
Here's how professional traders typically interpret pivot point signals:
Bullish Scenario: If GBP/USD opens above the 1.2650 pivot point and breaks through R1 at 1.2680, it indicates sustained bullish momentum. Traders might enter long positions with take-profit targets near R2 at 1.2710 and stop-loss orders just below the pivot point.
Bearish Scenario: If the same pair opens below the pivot point and breaks S1, it suggests bearish pressure. Short positions might be initiated with targets at S2 and protective stops above the pivot point.
Range-Bound Trading: When price oscillates around the pivot point without clear directional momentum, traders might employ range-bound strategies, buying near support levels and selling near resistance levels.
It's crucial to understand that pivot points are not absolute boundaries but serve as decision-making references. They work best when combined with other technical indicators like RSI, MACD, or moving averages to confirm signals and reduce false breakouts.
Volume analysis adds another layer of confirmation. When price breaks through a pivot level with high volume, it strengthens the signal's validity. Conversely, breakouts on low volume are more likely to fail.
Think of pivot points like a weather forecast predicting temperatures above 30°C – you're more likely to dress for warm weather. Similarly, when the price is above the pivot point, you're more inclined to look for buying opportunities rather than selling.
The effectiveness of pivot point analysis increases significantly when multiple timeframes align. For instance, if the daily pivot point suggests bullish sentiment and the 4-hour chart confirms this bias, the probability of successful trades increases substantially.
How to Use Pivot Points in Live Trading
Translating pivot point theory into practical trading strategies requires understanding how to implement these levels effectively on trading platforms and integrate them into comprehensive trading plans. Modern trading platforms like Tradewill make it easy to overlay pivot point indicators directly onto price charts.
Setting Up Pivot Points on Trading Platforms:
Most professional trading platforms offer built-in pivot point indicators. On Tradewill, traders can access these tools through the technical analysis section, allowing automatic calculation and display of all pivot levels. The platform typically highlights the main pivot point in one colour, support levels in another, and resistance levels in a third colour for easy identification.
Core Trading Strategies:
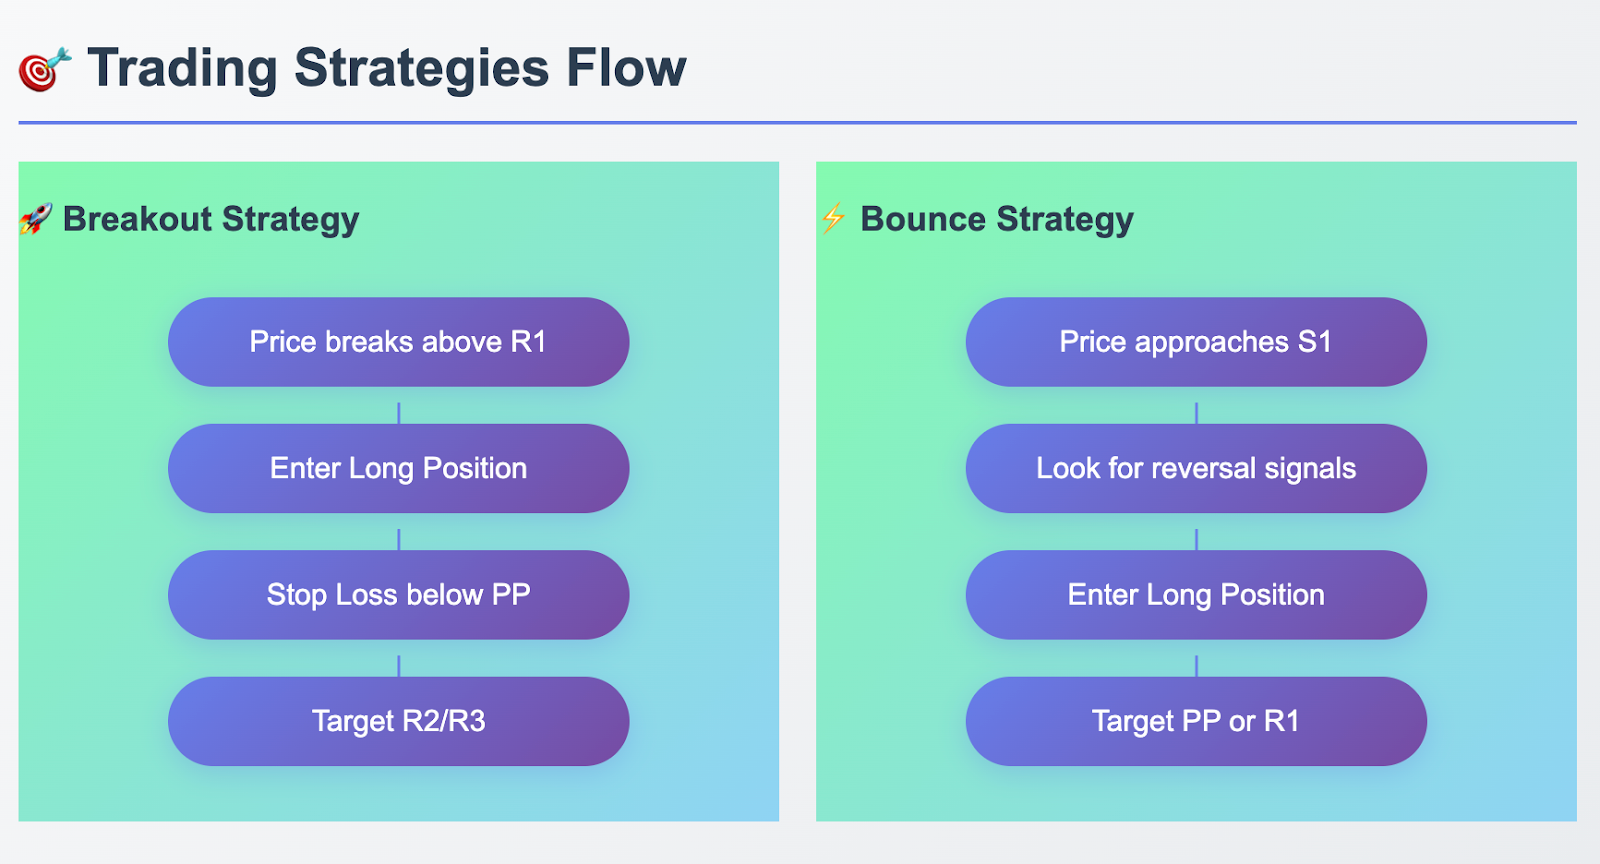
Breakout Strategy: When price breaks above R1 with conviction, enter a long position with a stop-loss just below the pivot point. Target the next resistance level (R2) for profit-taking. This strategy works particularly well during trending market conditions.
Bounce Strategy: When price approaches S1 and shows signs of reversal (such as bullish candlestick patterns), enter a long position targeting the pivot point or R1. This mean-reversion approach works effectively in ranging markets.
Fade Strategy: In strong trending markets, some traders fade (trade against) pivot point bounces, expecting price to continue in the dominant direction after brief pauses at these levels.
Practical Example: Consider a EUR/USD intraday trading scenario where the pivot point is calculated at 1.0950. If the pair opens at 1.0940 and rallies above the pivot point with strong volume, traders might enter long positions with stops at 1.0935 and targets at R1 (1.0975).
Risk Management Integration:
Effective pivot point trading requires disciplined risk management. Never risk more than 1-2% of your account balance on any single trade. Use the natural spacing between pivot levels to determine appropriate position sizes. If the distance between your entry point and stop-loss is large, reduce your position size accordingly.
Advanced Techniques:
Experienced traders often combine pivot points with other technical indicators. For example, if RSI shows oversold conditions near S1, it might provide additional confirmation for a bounce trade. Similarly, if MACD shows bullish divergence at a support level, it strengthens the case for a long position.
The key to successful pivot point trading is consistency and discipline. Treat these levels as a framework for decision-making rather than absolute rules. Market conditions change, and successful traders adapt their strategies accordingly while maintaining core principles.
Common Mistakes When Using Pivot Points
Understanding the limitations and potential pitfalls of pivot point analysis is crucial for developing realistic expectations and avoiding costly trading mistakes. While pivot points are powerful tools, they're not infallible and require proper context and interpretation.
Over-Reliance on Pivot Points Alone:
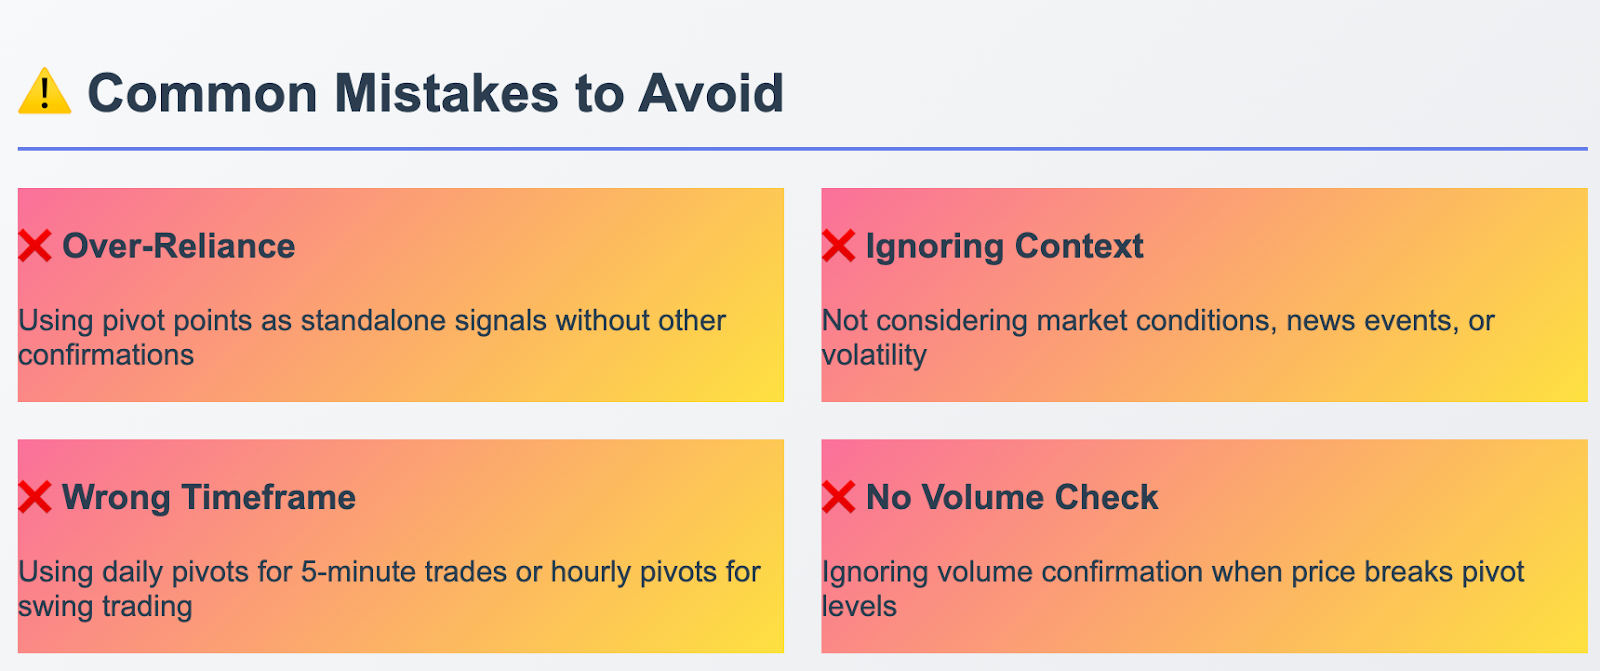
The most common mistake novice traders make is treating pivot points as standalone trading signals. These levels work best when combined with other forms of analysis, including candlestick patterns, volume analysis, and momentum indicators. Successful traders use pivot points as one component of a comprehensive trading strategy, not as the sole decision-making criterion.
Ignoring Market Context:
Pivot points are calculated based on historical price data, making them less effective during periods of extreme volatility or when significant news events occur. During Federal Reserve announcements, earnings releases, or geopolitical events, price can blast through all pivot levels without pause. Traders must remain aware of the economic calendar and adjust their strategies accordingly.
Inappropriate Timeframe Application:
Different timeframes require different approaches to pivot point trading. Daily pivots work well for swing trading strategies, while hourly pivots are more suitable for scalping. Using daily pivot points for 5-minute trades or hourly pivots for position trading can lead to poor results.
Failure to Adapt to Market Conditions:
Pivot points perform differently across various market conditions. In trending markets, price often breaks through multiple levels without significant retracements. In ranging markets, these levels act as stronger support and resistance. Traders who fail to recognise current market conditions and adapt their strategies accordingly often struggle with pivot point trading.
Neglecting Volume Confirmation:
Price breaking through a pivot level without accompanying volume is often a false signal. Professional traders always consider volume when evaluating pivot point breakouts. High-volume breakouts are more likely to sustain, while low-volume breaks frequently fail.
Rigid Stop-Loss Placement:
While pivot points provide natural stop-loss levels, market volatility and spread considerations must be factored in. Placing stops exactly at pivot levels can result in premature exits due to normal market noise. Successful traders allow for some buffer around these levels.
Instrument-Specific Considerations:
The effectiveness of pivot points varies across different financial instruments. Major forex pairs like EUR/USD and GBP/USD tend to respect these levels more consistently than exotic pairs or highly volatile assets like cryptocurrencies. Traders should test pivot point strategies on their preferred instruments before implementing them with real money.
Think of pivot points like using last summer's weather forecast to decide today's clothing – it provides valuable reference information, but shouldn't be followed blindly without considering current conditions.
Psychological Pitfalls:
Many traders abandon their pivot point strategies after a few losing trades, not recognising that no technical analysis method has a 100% success rate. Consistency and proper risk management are more important than being right on every trade.
The key takeaway is that pivot points are powerful tools within a comprehensive trading framework, but they require proper context, risk management, and realistic expectations to be effective.
Combining Pivot Points with Other Indicators
Pivot Points with Other Indicators
The real magic of pivot points comes to light when they are merged with other indicators to develop a holistic trading strategy. This is an excellent combination that gives us reliable signals and a strong entry point, while helping to filter out false breakouts, which allow us to ride the trend.
Pivot Points and RSI Integration:
The RSI can be very effective in confirming pivot point signals and spotting overbought or oversold conditions. If price is nearing a pivot support level (S1) and RSI is oversold (dips below 30), this is the type of high probability set-up that can lead to a bounce. On the other hand, when the price is at resistance (R1) while RSI is overbought (greater than 70), there's a potential for a reversal.
Example: EUR/USD near S1 (1.0920) and RSI reaching 28. This combination implies that the market is oversold at the low of the day (or the bottom of the range) and that the market is likely to close near the high of the day (or at the high end of the range).
Moving Average Confluence:
The trend direction can also be ascertained, and the trader can also gain insight through the use of the pivot points. If a pivot level intersects with the 20-period moving average, it brings added significance to that price. If the price is above the pivot point and also the moving average, this is a signal of bullish sentiment.
Advanced Strategy: Identify consolidation where the pivot point, a significant moving average (like the 50-period), and a Fibonacci level fall in line with each other. These confluence areas tend to generate strong trading signals at a great risk-reward ratio.
MACD and Momentum Confirmation:
You can use the Moving Average Convergence Divergence (MACD) indicator to help identify momentum shifts that occur along with pivot point interactions. If MACD exhibits bullish divergence while trading near a support, it indicates that the price is likely to experience upward movement. At the same time, bearish divergence at resistance suggests potential downside momentum.
Volume Analysis Integration:
Volume – The volume increase at the pivot point breakout is the second-to-none confirmation of signal strength. Price breaking above R1 with much higher than average volume means that there’s real buying interest, and this is not just a false breakout. Very good professional traders wait for volume, confirming the signal.
Here are the most common ways to use pivot points:
As a level of price rotation: If the price is in an upward direction, the pivot point is a level the price can reach on the way. If it is also a resistance level, that offers opportunities to traders as well.
If it is possible for the price to drop further, it has an opportunity to offer traders more to trade. There are powerful new pivot point signals for all those to trade, too.
Professional traders just sit back and watch the price. If everything lines up, traders make a solid trade, with nothing other than that level confirming the decision.
Grid trading was the most popular form of trading until traders began to understand how to grid trade.
Candlestick Pattern Recognition:
Pivot Point Reversals with Japanese Candlestick Patterns. Adding another layer of confirmation to a Fibonacci trading strategy is the use of reversal patterns. Doji candles printed around pivots show indecision and the possibility of a reversal, so do strong bullish or bearish candlestick patterns for direction bias confirmation.
Multi-Timeframe Analysis:
Pivots on different timeframes together paint the bigger picture of the market. They used daily pivot points to give an overall market direction and then specific levels for entry and exit, along with a stop loss and take profit levels. When pivots Confluence, they form high-odds trading zones.
Risk Management Enhancement:
Combining more than one with a focus on pivot points helps to distinguish the stronger trade signals. Rather than just depending on pivot levels for stop placement, traders can also take various indicator divergences and pattern failures as further confirmation for an exit.
The art of good integration is to steer clear of indicator overload. 3-4 properly selected indexes, together with the minorities’, are enough for any trading decision with the help of pivot points. More indicators do not mean more successful — it usually means more confusion and analysis paralysis.
Think of it as having traffic signals combined with a traffic officer. So pivot points are the traffic lights giving general direction, and the other indicators are the officer indicating to you to take this or that path in a nuanced way, according to the current weather.
Pivot Points Across Different Markets and Timeframes
The flexibility of pivot points applies even to other markets in which there are active trading periods, and the timeframes in which the trader uses to trade the market, but they don’t work as well for some despite the difference in efficacy. A clear paradigm for the optimal use of pivot point systems must incorporate these variations to provide sound trading judgment in every situation.
Forex Market Applications:
Pivot points are particularly popular in the forex market because the high liquidity ensures constant and smooth price action all day and night. The likes of the EUR, USD, GBP, and JPY see high respect for pivots, particularly during the London and New York trading hours, which are when they experience their highest volume on average. For forex day traders, this strategy works best in the London session as there is maximum volatility.
Forex day traders find pivot point analysis especially useful. The 4HR and Daily timeframes give up strong pivot levels that give traders the ability to watch short-term price action and can also be used to keep a bird’s eye view on the overall market structure.
Precious Metals and Commodities:
Pivot points tend to cause gold and silver markets to react, although you have to discount the way these two markets trade. With precious metals, gapping is common, particularly before and after major economic events. This results in price opening significantly higher or lower than the pivot levels and leads to adjusted trading strategies.
Because gold and silver are money and are volatile, the breakouts of these pivot points usually see substantial price moves than those in the forex. But it also raises the danger of false signals, and so confirmation from other indicators is even more crucial.
Cryptocurrency Markets:
Pivot point analysis is however, is not without its problems in cryptocurrency trading. Cryptocurrency markets are highly volatile and trade 24/7, so these kinds of shifts can happen and mess up your standard pivot point calculations. But with big coins like BTC and ETH, it’s worth paying at least some lip service to pivot levels, especially when they’re in low-vol mode.
Traders applying PP to crypto should do so at shorter timeframes and also look at the volume to get a more holistic view of the market, GlassCommunicates summarised.
Timeframe Variations:
Daily Pivot Points: Most stable, suitable for both swing and day trading. Intraday pivots are useful as well, but the major support and resistance levels that daily pivots provide can be traded more consistently and consistently.
Hourly Pivot Points: Hourly pivots are also sensitive to more immediate price action and provide perfect settings for day trading and scalping. They provide signals more often, but demand that you manage your risk because noise can play a larger role.
Strategy 2: Position Trading- Weekly Pivot Points Only, and best suited for long-term trading. Weekly pivots are useful in identifying significant trend reversals and also for giving timing to monthly trading decisions.
Market-Specific Adaptations:
Not all markets are the same, and each one requires a different approach to pivot point trading. The equity markets, for instance, are influenced by gaps and earnings numbers that can render pivot levels invalid. Commodities are driven by seasonality and supply and demand, which can trump technical levels.
Cross-Market Analysis:
Pivot points, when calculated, are also analysed in correlation with other markets by professional traders to further boost their understanding and information. For instance, if EUR/USD and GBP/USD are both challenging their pivot points at the same time, we could perhaps conclude USD-related strength or weakness.
Adaptation Strategies:
Learning to effectively use pivot points takes time and practice. Traders may apply wider stop-losses and smaller position sizes in more volatile markets. The former, breakout strategies, are used when the market is trending, and the latter bounce when the market is ranging.
The trick is in understanding that pivot points are not a one-size-fits-all resource. They work under certain market conditions and for given timeframes and have to be properly adjusted to unique instruments. Traders who acknowledge the variations and adapt their tactics to the different cycles will be more successful.
Advanced Pivot Point Strategies
To master pivot points, you need to learn sophisticated concepts that go beyond the realm of simply identifying support and resistance. These are the kind of sophisticated traders that can stay disciplined, focused, and adaptable, as opposed to micromanaging their positions and having second thoughts about every trade they take.
Multi-Timeframe Pivot Confluence:
Professional traders also tend to look for a confluence of pivot points from multiple timeframes. The daily pivot coinciding with a 4-hour R1 and weekly S1 level will make a strong confluence zone with a strong likelihood to react to a price there. These zones tend to offer a good risk-reward for bidding and offering the contracts!
Pivot Point Trend Channels:
Rather than referring to pivot points as independent levels, some traders extend a trend channel by using multiple pivot points over time. The pivot points are connected over a few days, and trend channels are in their making, with dynamic support and resistance that can be ascertained.
Session-Specific Pivot Analysis:
The forex market is open 24 hours a day in different parts of the world during the Asian, European, and American trading sessions. More advanced traders compute session-specific pivot points, given that Asian session pivots will take on more importance within Tokyo trading hours, European pivots, and London trading hours.
Pivot Point Momentum Strategies:
These are the tactics aimed mainly at the SPEED and CONVICTION of the breakout of a pivot point. If price moves powerfully through a pivot level, you can often count on it to also move powerfully away from it. Traders can ride these momentum moves whilst employing trailing stops to capitalise.
Counter-Trend Pivot Strategies:
In strongly trending markets, traders can use them to find potential reversal zones. We sometimes get a trader bounce, at least when a market is approaching a major pivot support level.
Pivot Point Scalping Systems:
Day traders forge scalp systems out of intraday pivot points, especially during heavy after-hours and pre-market trading. These methods need careful management of your risk and generally include taking many smaller profits instead of large ones.
News-Event Pivot Strategies:
Experienced traders will excel at reading these types of movements, and it is common to hear talk about adjusting their pivot point analysis based on news events. They could expand their profit target heading into big news events or refrain from trading pivot levels during high-impact news events when plain vanilla technical analysis is less dependable.
Adaptive Pivot Calculations:
More advanced traders may customise these calculations and use pivot points to account for volatility in the market. During times of high volatility, they may place more weight on recent price action, while in calm markets, they adhere to standard calculations.
Risk Management Integration:
Pivot point strategies often come with transitioning risk control methods. This involves lot size calculation based on the distance between pivot levels, correlation analysis when trading more than one pair, etc.
These are more advanced tactics and should be done with great care after thorough backtesting. They’re not for novice traders but are the continuation of pivot point analysis for traders who wish to increase their trading efficiency.
Summary & Next Steps
Pivot points are one of the oldest and most reliable technical analysis methods because they are an “objective” way of considering market action. We have seen throughout this extensive manual how these calculated levels are acting as the "central reference line" in a day-to-day trading process.
The road to pivot-point study started with the basic definition -- a quantified image of market sentiment taken from past trading sessions. We looked at the basic formula and saw how to establish support and resistance zones that are the basis of intraday trading.
We’ve also covered many of the pitfalls to avoid and explained that while ‘pivot points’ can be a useful signal, they can be most effective when part of a wider trading strategy, rather than as standalone buy or sell signals. The effectiveness is greatly increased when combined with other technical indicators such as RSI, MACD and moving averages.
The fact that pivot points are widely used in various markets, such as forex, stocks or futures, and time frames too, helps to determine their importance. Forex Majors to Bullion Trading, Scalping to Swing Trading, these levels offer users a set of reference points for market analysis.
Your Next Steps:
Open a Demo Account: Open a demo account to start trading the Pivot Point and Pivot Point strategies with Tradewill. You will be able to experiment and develop a feel for the game in a safe environment.
Learn the Best Pairs: Observing that in most cases, the market is more reliable in some of the major pairs, sometimes the session time can affect the pair. Start off with trading on the popular currency pairs.
Plan Your Trades: Set up a method that includes Pivot Points as part of your pre-market trading strategy. Have clear and measurable entry and exit rules, risk management rules and position sizing rules.
Practice Daily Calculations: Calculate today's pivot point for EUR/USD by hand yourself and aim target levels at R1 and S1. This manual approach will increase your understanding of how these levels are produced.
Record Your Trades: Once you have identified a good opportunity, write it down, along with what worked and what did not. This record will assist you in fine-tuning your technique.
Continue to learn: Read more on CFD trading and technical analysis while building your knowledge and enhancing your trading capabilities.
Pivot points are like your own personal trading coordinate system – you won’t be lost wandering through the markets anymore! These are the levels that put price action into structure and state the context in which you can operate on price action, rather than being a reactive trader and making emotional decisions.
Begin the pivot point journey today, and move towards more structured and profitable trading!
Disclaimer: The content of the blog does not represent any position of Trade W, does not serve as any trading-related decision advice, and does not endorse any third-party.