

 Trade W

Price channels are perhaps one of the most potent yet less used methods in forex trading. Despite many traders focusing on a single trend line or a host of indicators that often combine price action and indicators, price channels provide something unique: both direction and boundaries of price action. Think of these channels as guard rails on a winding mountain road, allowing you to risk more confidently through the market's unexpected curves.
Concept of price channels in forex trading:
A price channel is simply two parallel lines that can connect recent highs and lows to create a visual path for price action to move. In contrast to simply drawing a trend line, price channels provide trading signals because they provide a complete picture of where price can occasionally find support and resistance, and it shows both direction and boundaries.
For example, the price channel is often defined as follows:
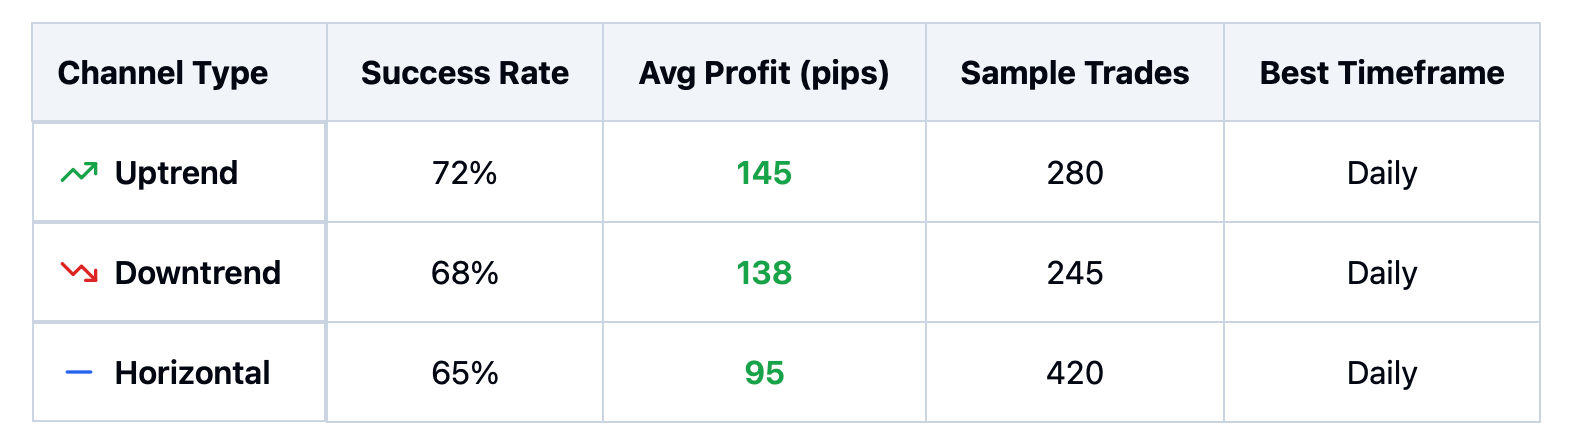
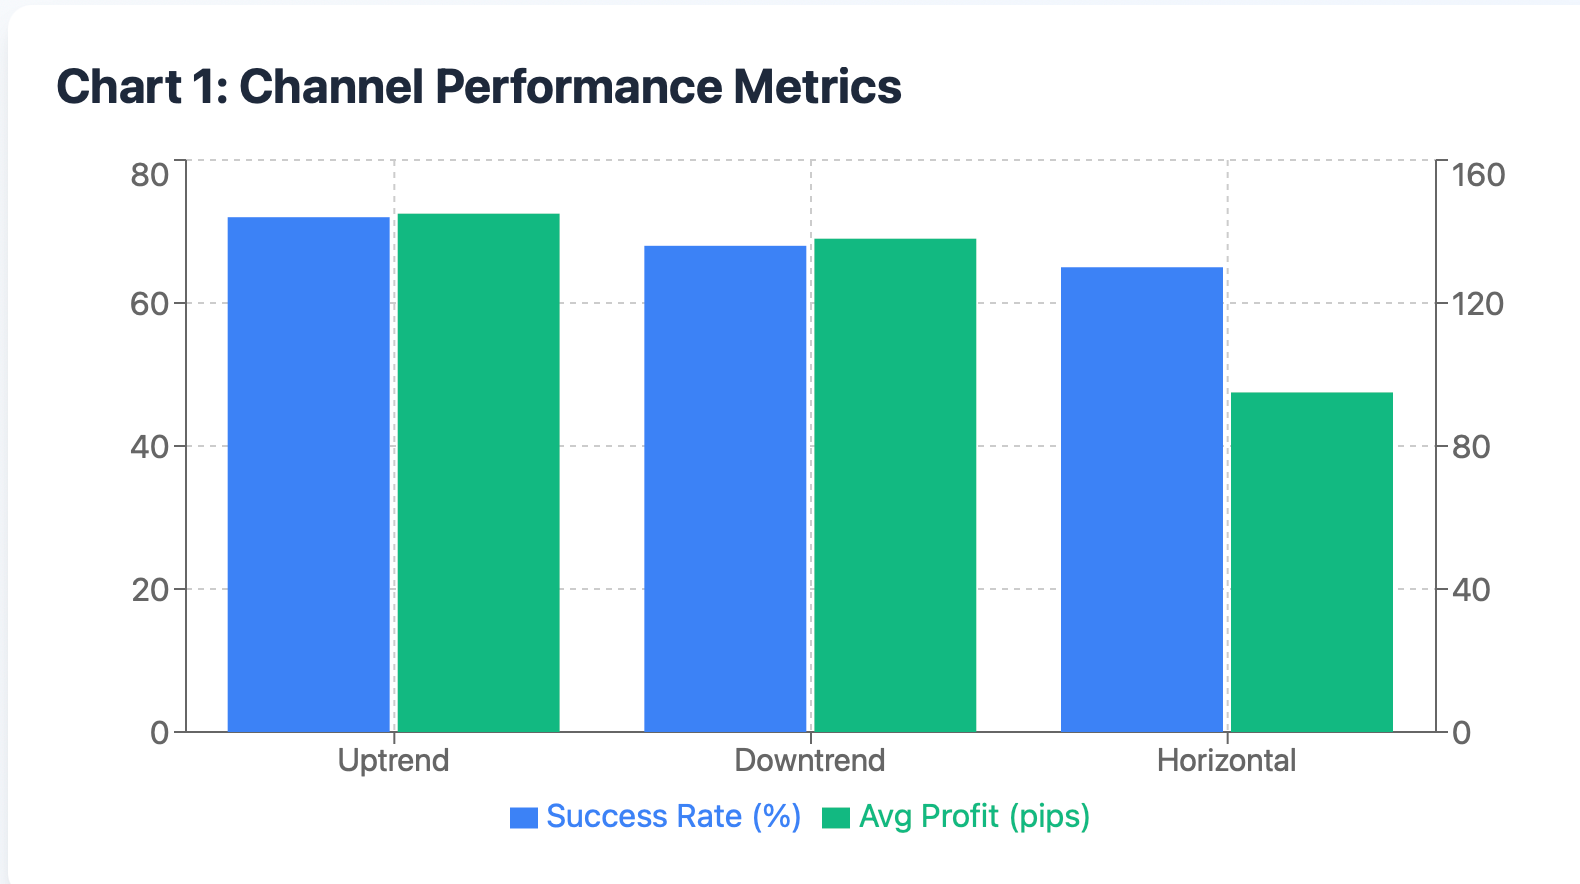
Uptrend Channels describe price actions making higher highs and higher lows, acting parallel to each other. Think of a staircase with each step higher at times being the same width.
Downtrend Channels describe lower highs and lower lows of prices acting parallel to each other. Think of a ball bouncing down a hallway, sloped in a downward direction.
Horizontal Channels (or sideways channels) are when prices travel within a specific range without a clear upward or downward bias. A good analogy is thinking of price action moving up and down like elevators traveling between floors.
For instance, let’s say you are observing EUR/USD on the daily chart. You notice that the pair has repeatedly made higher lows around 1.1200 and higher highs around 1.1400 for the past several weeks. If you draw lines parallel to the top and bottom price points, an uptrend channel is created. When the price travels down towards the lower price barrier, the price typically reverses back up, and the top price barrier represents resistance.
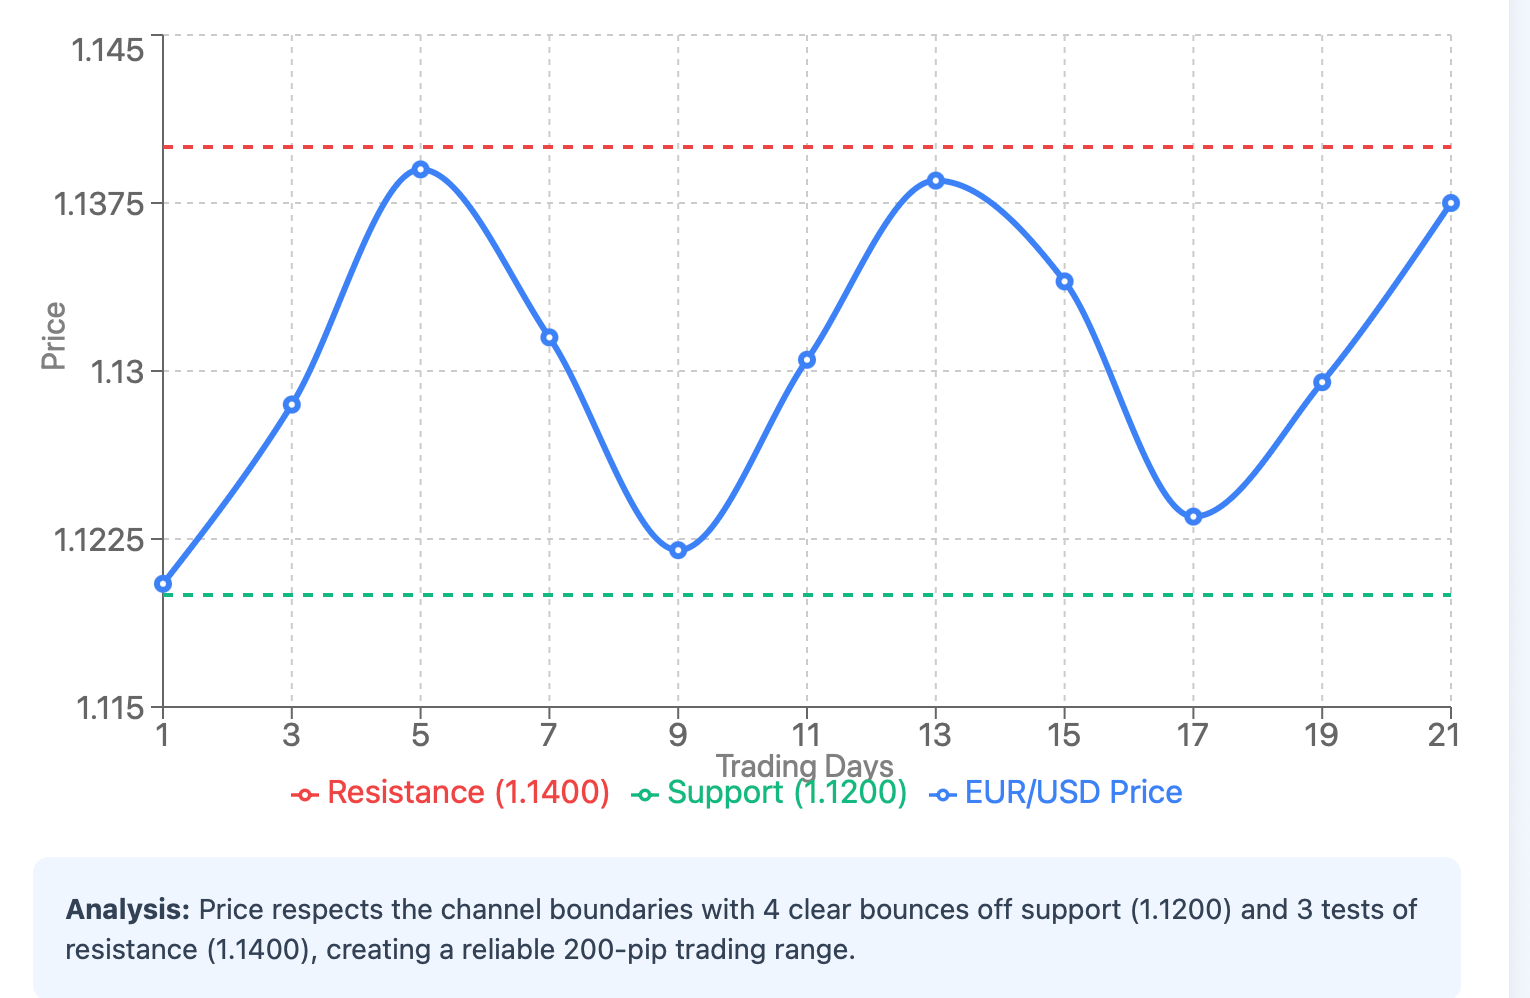
Using a simpler analogy, think of a basketball game where the score fluctuate between 60-80 points over the course of the game - the score rarely goes below 60 (support) or above 80 (resistance). Both points create a horizontal channel of expected performance.
How to Professionally Draw price Channels
Correctly drawing price channels isn't about connecting every high and low. It's about connecting significant price action where prices react consistently.
Take the following step-by-step approach.
For Uptrend Channels: Begin by connecting a minimum of two relevant lows with a trendline. Then, draw a parallel line to connect the highs. The important factor is that they are indeed parallel lines, whether or not every price point perfectly touches both lines.
For Downtrend Channels: Start with highs, and connect at least two relevant peaks. Draw your parallel line through the lows. Again, do not force every price point to perfectly touch both lines.
For Horizontal Channels: Identify the highest and lowest points during the sideways period, and then draw parallel horizontal lines at those ranges.
Using multiple timeframes is another level to consider when you trade channels. For example, you may have a strong uptrend channel on the daily chart, and then find nested channels on the 4-hour. These smaller channels will help you find more precise entry and exit levels.
Take note of the daily chart for USD/JPY beautifully laying out an uptrend channel. The lower boundary of the channel is situated somewhere around 108.50 while the upper portion of the channel is approximately 110.20. You have seen a minimum of four bounces off the lower portion of the channel in the past 2 months.
On the 4-hour chart, you are able to see smaller channels within this larger overall structure allowing you to trade both with and against short-term momentum an unlimited number of times. Additionally, volume confirmation is very pertinent in terms of validating your channels.
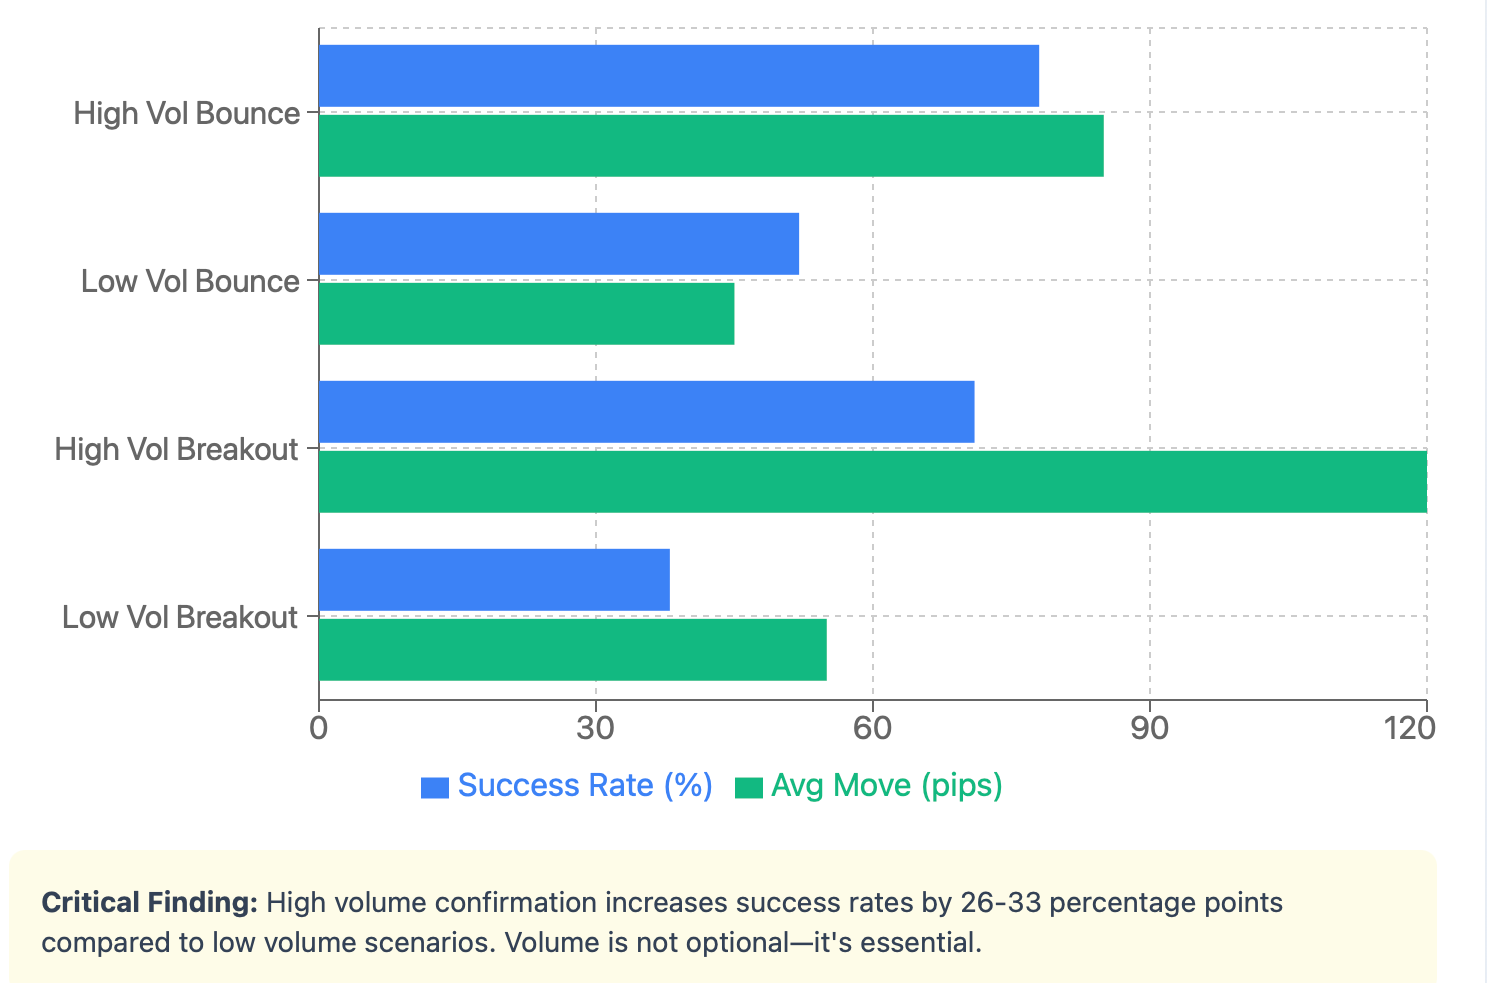
If the price bounces off a channel boundary while volumes are increasing, that indicates the level is much more likely to hold. However, if volume increases while price approaches a boundary and then breaks outside of that boundary, you likely have a legitimate breakout on your hands.
Practical Channel Trading Strategies
Price channels are highly effective in identifying higher-probability trade setups. Much of the appeal comes from the simplicity of trading channels: buy near support and sell near resistance, anticipate breakouts when price action pushes outside of channel boundaries.
Channel Bounce Strategy: This is the bread-and-butter strategy where one buys near the lower boundary of an uptrend channel or sells near the upper boundary of a downtrend channel with a stop-loss is in place just outside of the channel to protect against false signals.
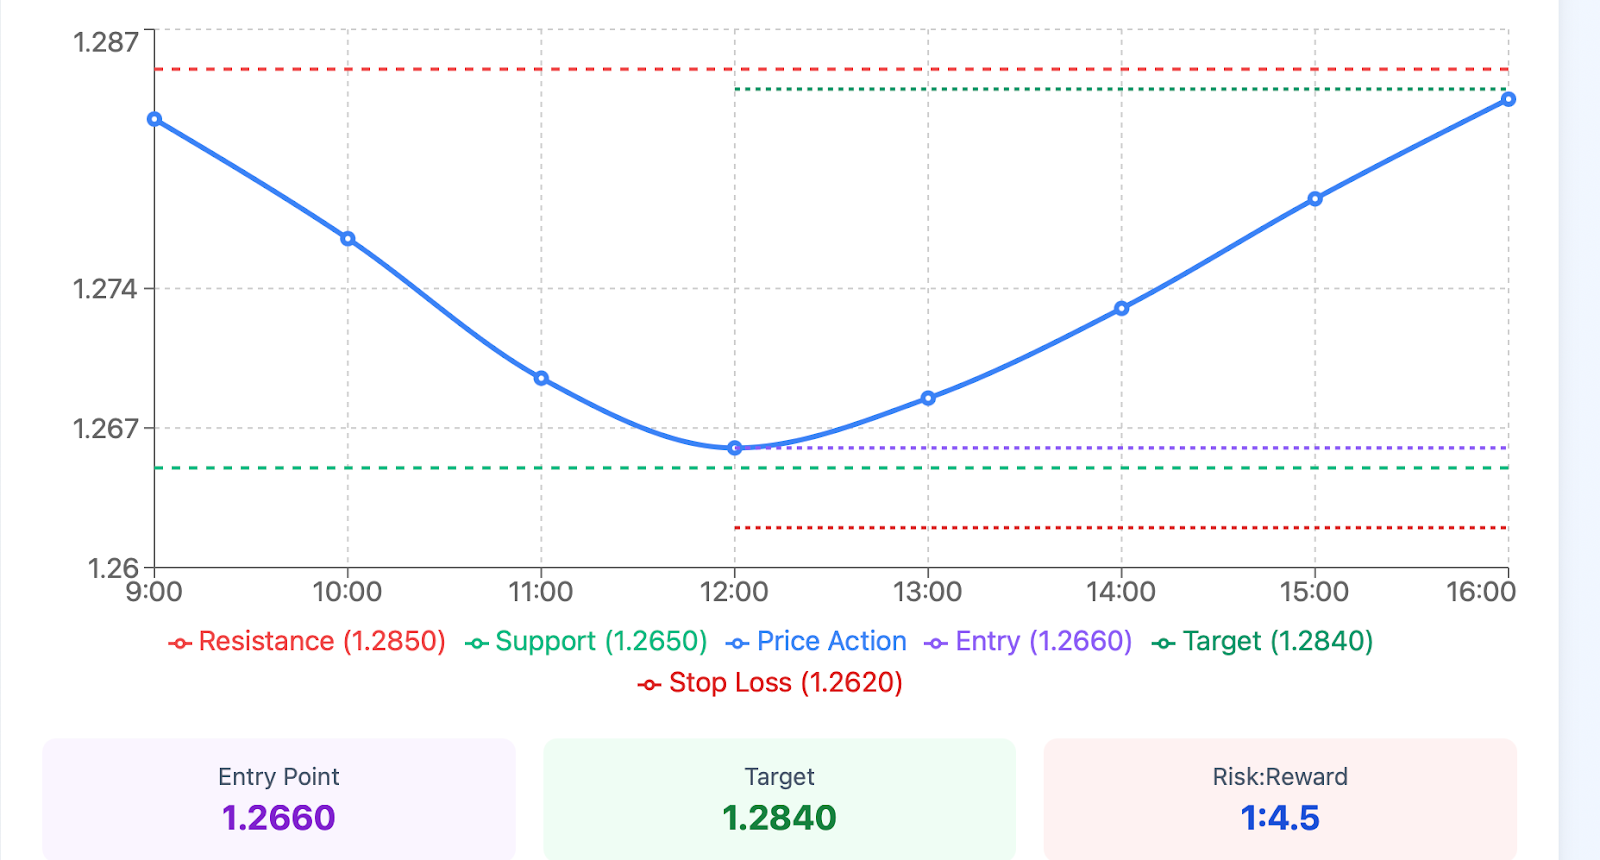
Let's go over an example with GBP/USD. You see a solid uptrend channel with the lower boundary around 1.2650 and upper boundary near 1.2850. When price drops to 1.2660 (near the lower boundary), you go long with a stop-loss at 1.2620, and a target at 1.2840 just below upper resistance.
Breakout Strategy: Occasionally price breaks out of channels with confidence indicating the trend potential is accelerating. These breakouts can produce phenomenal profit potential, but confirmation and validation are essential. A valid breakout typically involves prices breaking out of the channel boundary without just touching it, as well as increased volume during the breakout and price momentum when entering the next period. "False moves" occur frequently so many traders wait for prices to retest the breakout level before entering based on confirmation.
Mean Reversion in Horizontal Channels: Sidesways markets naturally create great mean reversion opportunities. If prices approach the upper boundary of a horizontal channel, you may be considering shorting towards the mean or lower boundary.
Using channels with other indicators increases the success rate considerably. The RSI can help you determine if asset prices are overbought near channel resistance levels, or oversold near channel support levels. A MACD divergence near the channel ends can indicate possible reversals. Using moving averages in the channel can provide dynamic support and resistance levels.
To refer back to our basketball analogy; if the game score consistently bounces between 60 and 80 points, you could "bet" when it hits 62 that it would rise or when it hits 78 that it would fall. However, if you notice the team's energy levels along with the score (like an RSI indicator), you would "bet" with more confidence.
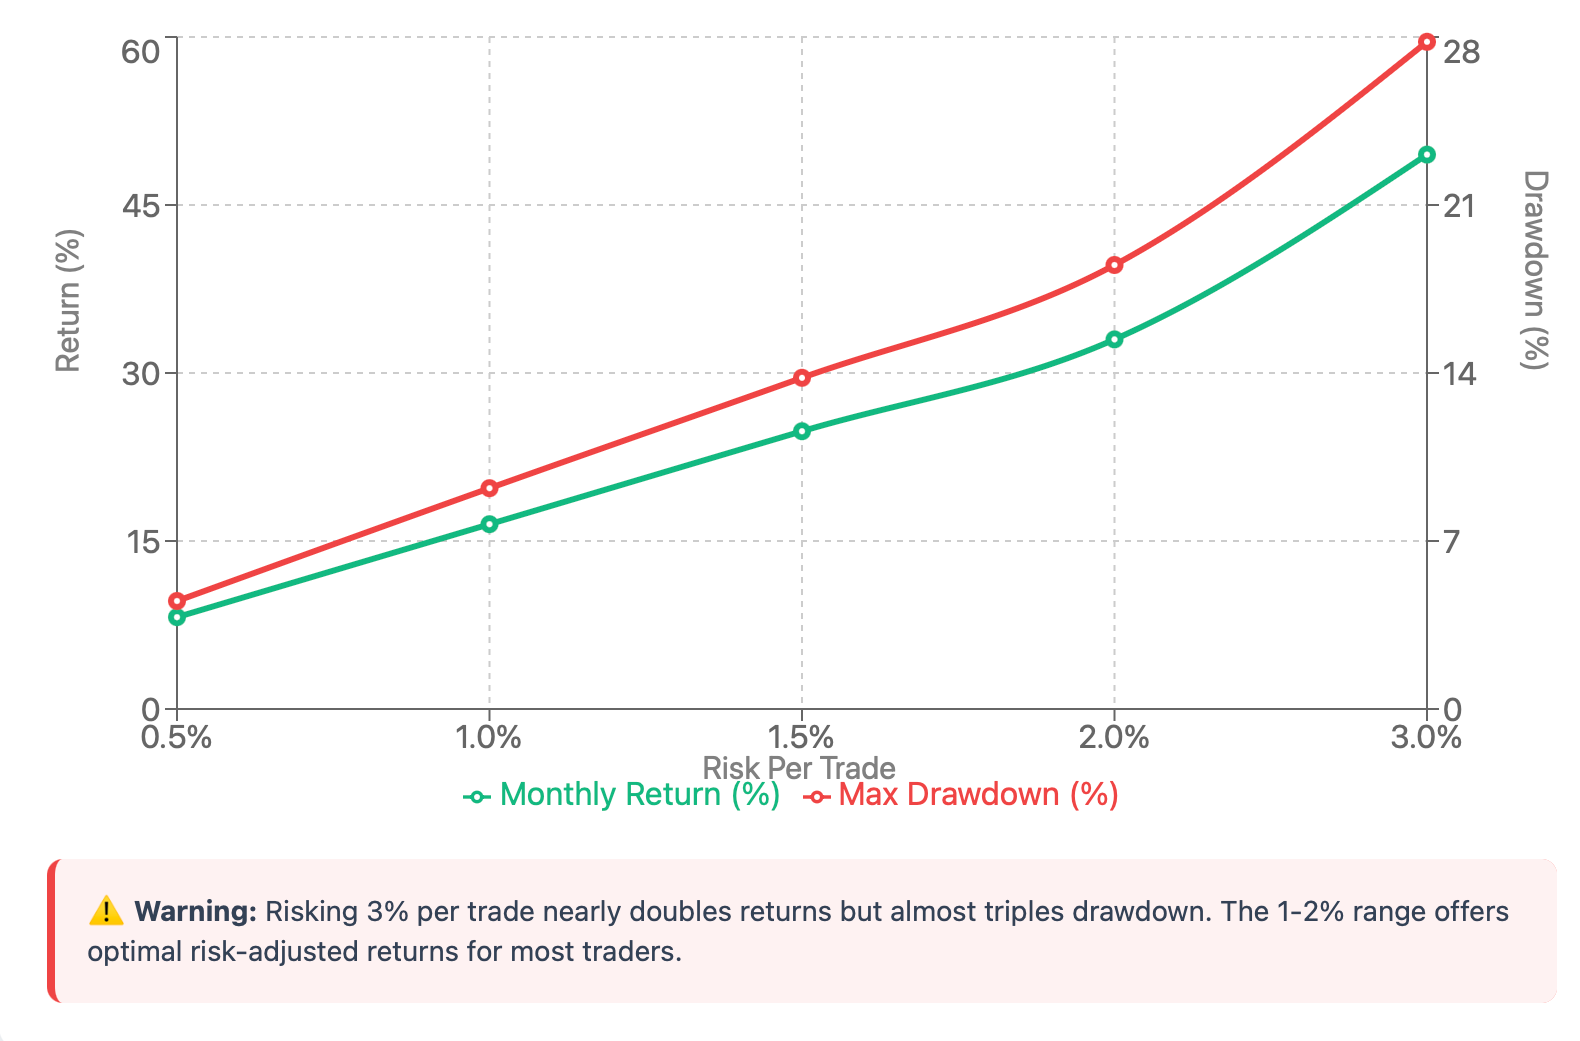
Once we begin trading channels, position sizing and risk management become paramount. You should never risk more than 1-2% of your account on any one trade, even if the setup is optimal. The reality is that channels can break you unexpectedly and protecting your capital is paramount to executing that one trade.
Common Mistakes and Avoiding Them
Even experienced traders will run headfirst into channel trading problems. The most serious potential mistake is overfitting channels, connecting every swing high and swing low. This creates unreliable channels that tend to fail on the first routine price movement.
Market noise creates a second obstacle. Not every small bounce warrants the use of a channel line. Stick to key levels where price has produced multiple reactions. A good guideline to remember: if you are squinting to see the pattern, it is likely not there.
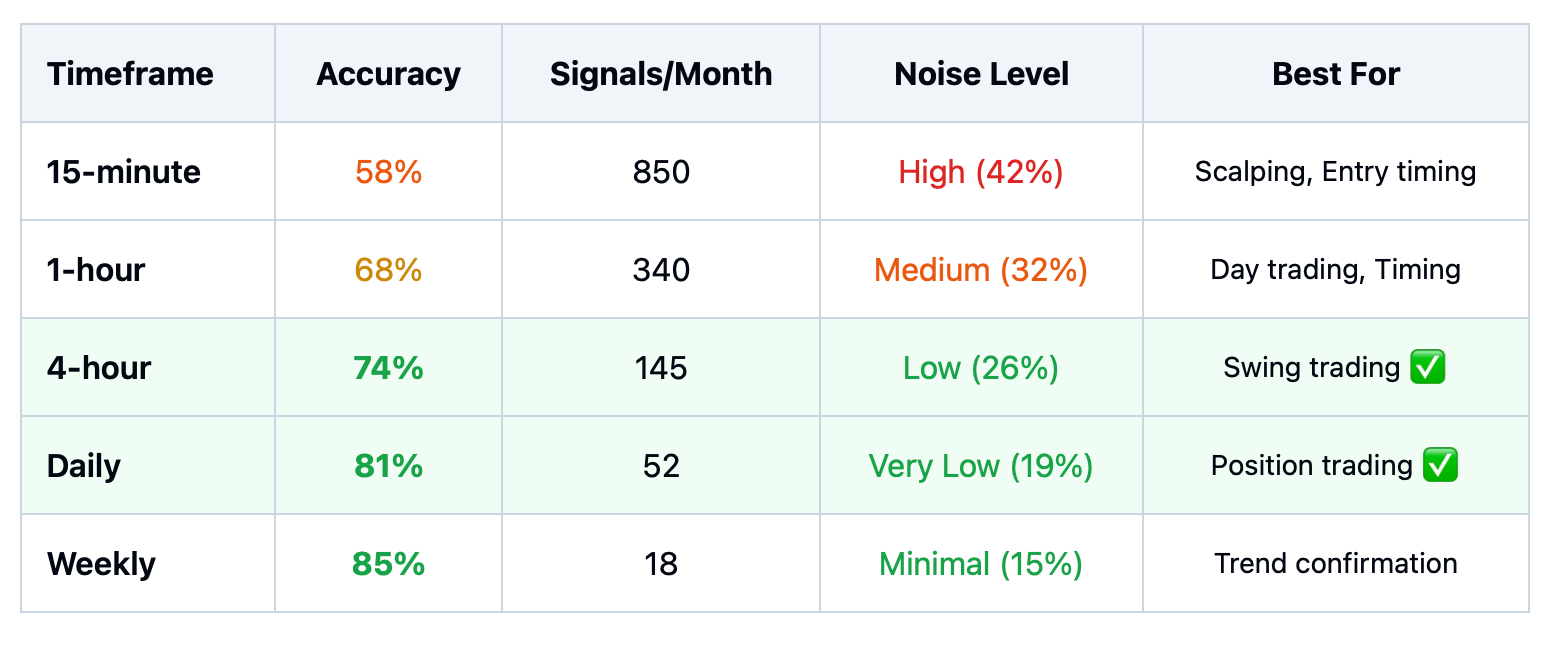
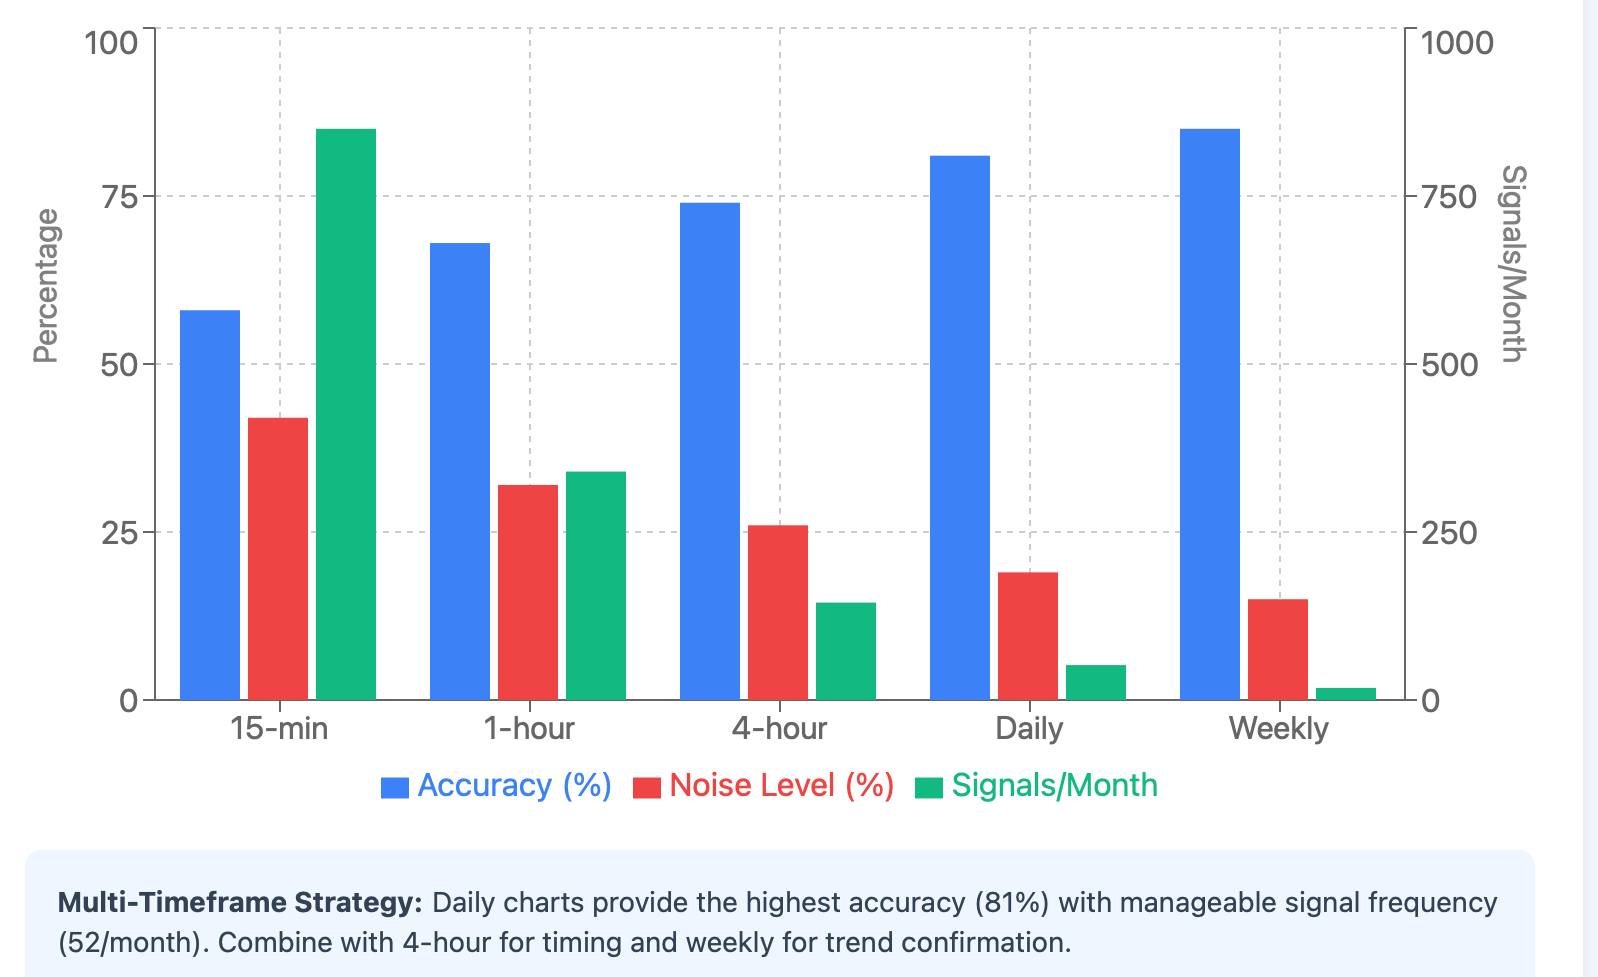
Single timeframe analysis will create blind spots. Your nice channel that you identified on your 1-hour chart will look completely different when you zoom out to the daily. Always validate your channels on multiple timeframes before risking real money.
For example, a chart of the AUD/USD showed many traders drawing an uptrend channel based on minor bounces over the course of a few days. This channel looked perfect on the 1 hour, however, when we zoomed out to the daily chart below, we realized that these were simply minor corrections in a larger downtrend. Many traders bought at this "support," only to watch the price break lower with conviction.
Relying on channels alone with no further confirmation will leave you leaning to your results. Markets do not always respect technical levels, especially in occurrences of high impact news and when sentiment shifts will occur suddenly. Be sure to consider the fundamentals and incorporate additional indicators into your channel analysis.
Channel volume analysis needs special consideration. A channel boundary that was touched with low volume has less meaning number than one that was tested with high volume. And any breakout that occurred with increasing volume is more likely to continue moving than one that occurred on very light trading.
Advanced Channel Strategies for Experienced Traders
Once you have got the basic channels down, several advanced strategies can be utilized to improve your edge.
Parallel Channel Systems create many sets of channels drawn parallel to capture price movement with different time horizons. Your main channel typically captures the main move, while a second channel allows for shorter moves during larger up or down trends.
Dynamic Channels take price channels and combine them with moving averages to create channels that adjust to market realities. For example, a 20-period moving average might be the centerline of your channel, and two parallel lines would be drawn above and below the moving average at a fixed distance.
Channel Slope Analysis provides guidance on assessing strength and sustainability of the trend. More steeply drawn channels typically suggest stronger momentum but less sustainability. Less sloped channels suggest steady and persistent trends that may last longer.
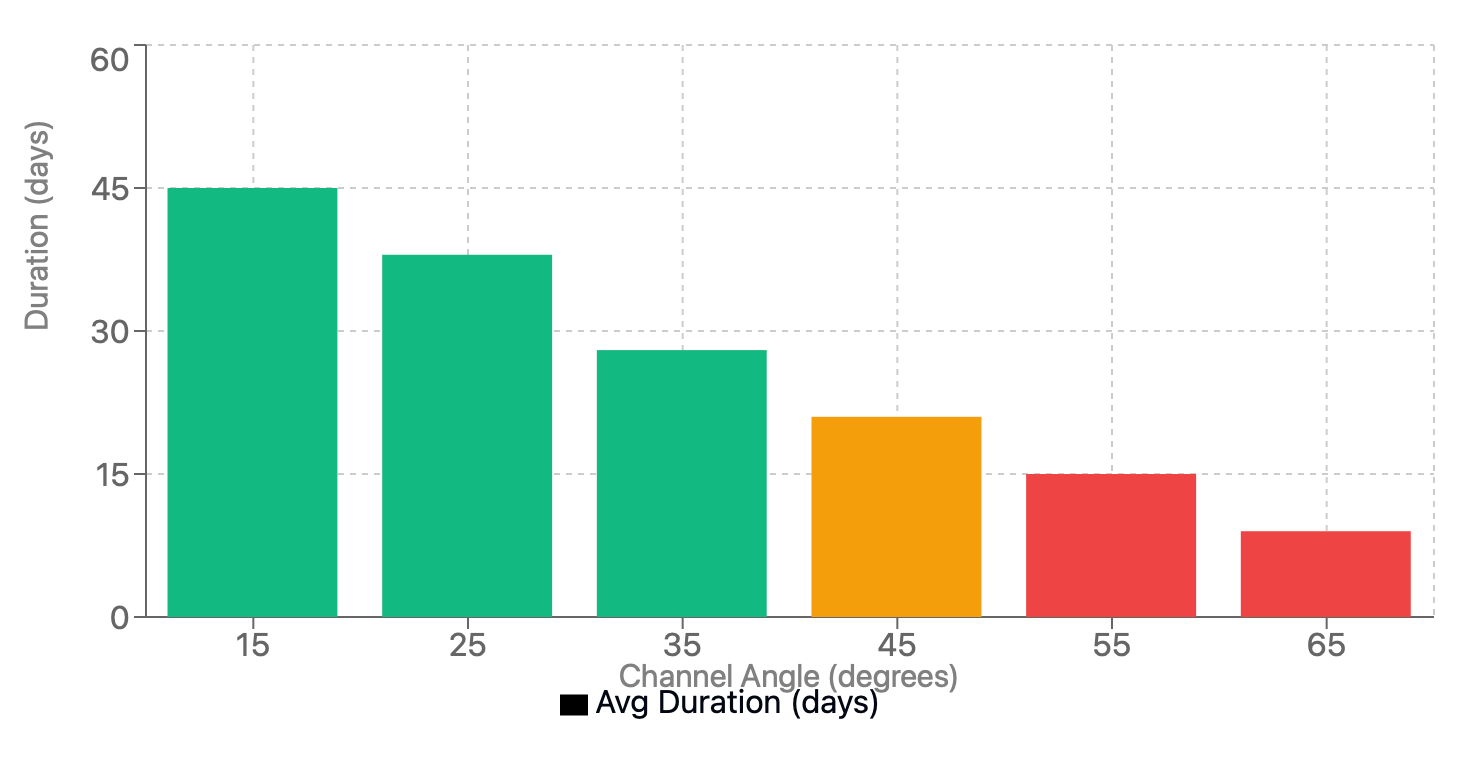
Multi-Channel Confluence happens when channels with different time frames come together. This information is available from the daily price movement as well as the hourly and 15-minute charts. A greater probability exists for a reversal or continuation at a level where two or more prevailing weekly channel boundaries align with horizontal daily channels. When two or more alignments occur it adds an additional layer of significance.
For the expansion of the concepts of channels, let's take EUR/JPY as an example of advanced channel application. On the daily chart for EUR/JPY, you identify your primary uptrend channel with a slope that is moderate at about 45 degrees. Inside this channel, you notice a steeper secondary channel reflecting the most recent price action. As prices touch the upper boundary of the secondary channel but remain inside the primary channel, you would expect a pullback to the lower boundary of the secondary channel.
The concept of Fibonacci Channel Integration layers additional sophistication to this model. By drawing your Fibonacci retracements inside of your price channels, you can see potential reversal levels that incorporate natural retracement levels with channel boundaries.
Channel momentum divergence is defined by prices making a new high or low inside of a channel, but your momentum indicators like RSI or MACD do not confirm that high or low is the key to a channel level. This divergence often precedes a break of the channel and a trend change.
Risk management becomes even more important with advanced techniques. The complexity of these two techniques sometimes can evoke overconfidence and may cause you to take a larger position size or ignore a stop loss. Stick to your risk rules regardless of how sophisticated your analysis becomes.
The Action Plan for Channel Trading: Putting It All Together
Price channels provide a real look into the behavior of market participants showing you both potential reversals and the direction of trends. They’re not magic, but they are useful when you use them correctly, and in combination with good risk management.
Start simple: practice drawing channels on historical charts without looking at future price action. This builds your ability to recognize patterns without the luxury of hindsight. Start with major currency pairs first; major currency pairs tend to obey technical levels better compared to exotic currencies.
Get used to the idea of multi-timeframe analysis. Look at daily charts to see the bigger picture, use hourly charts to monitor timing, and drill down to 15-minute charts for optimal entry points. Each timeframe tells part of the overall picture.
Use your channel analysis in combination with one other indicator. Volume analysis, for example, RSI, MACD, or even just moving averages, helps to confirm whether the pattern you see on the chart is either real (high likelihood) or “just noise.”
Keep a journal of your channel trades so you can start to determine what works and what doesn’t and why. Over time, as you accumulate experience, you will develop a natural feel for what gives you risk/reward trades that are acceptable to you.
Even the best channel traders are wrong sometimes – that is, it simply happens. The trick is to remain wrong small and right big. Your stop-losses protect you when you are wrong small, and proper sizing of positions and taking profit protect the right big.
There will always be opportunities in the foreign exchange market for those that can read its patterns. Price channels give you a systematic way to spot those opportunities and control your risk.
Are you ready to take your forex trading to the next level? Apply these price channel strategies in your demo account and see the difference systematic technical analysis makes.
Join our community of successful traders, and get access to exclusive market insights, real-time trade setups, and expert assistance from professional traders. Don't let another profitable trade opportunity go by, start mastering price channels to enhance your trading results even more.
Disclaimer: The content of the blog does not represent any position of Trade W, does not serve as any trading-related decision advice, and does not endorse any third-party.