

 Trade W
What Are Price Tiers in Forex Trading?
In the marketplace, one can think of price tiers as psychological checkpoints where prices tend to cluster and have some kind of reaction in that area. Price tiers are specific ranges/levels that market participants pay attention to, and whatever the price tier is can often cause fairly large moves in the market.
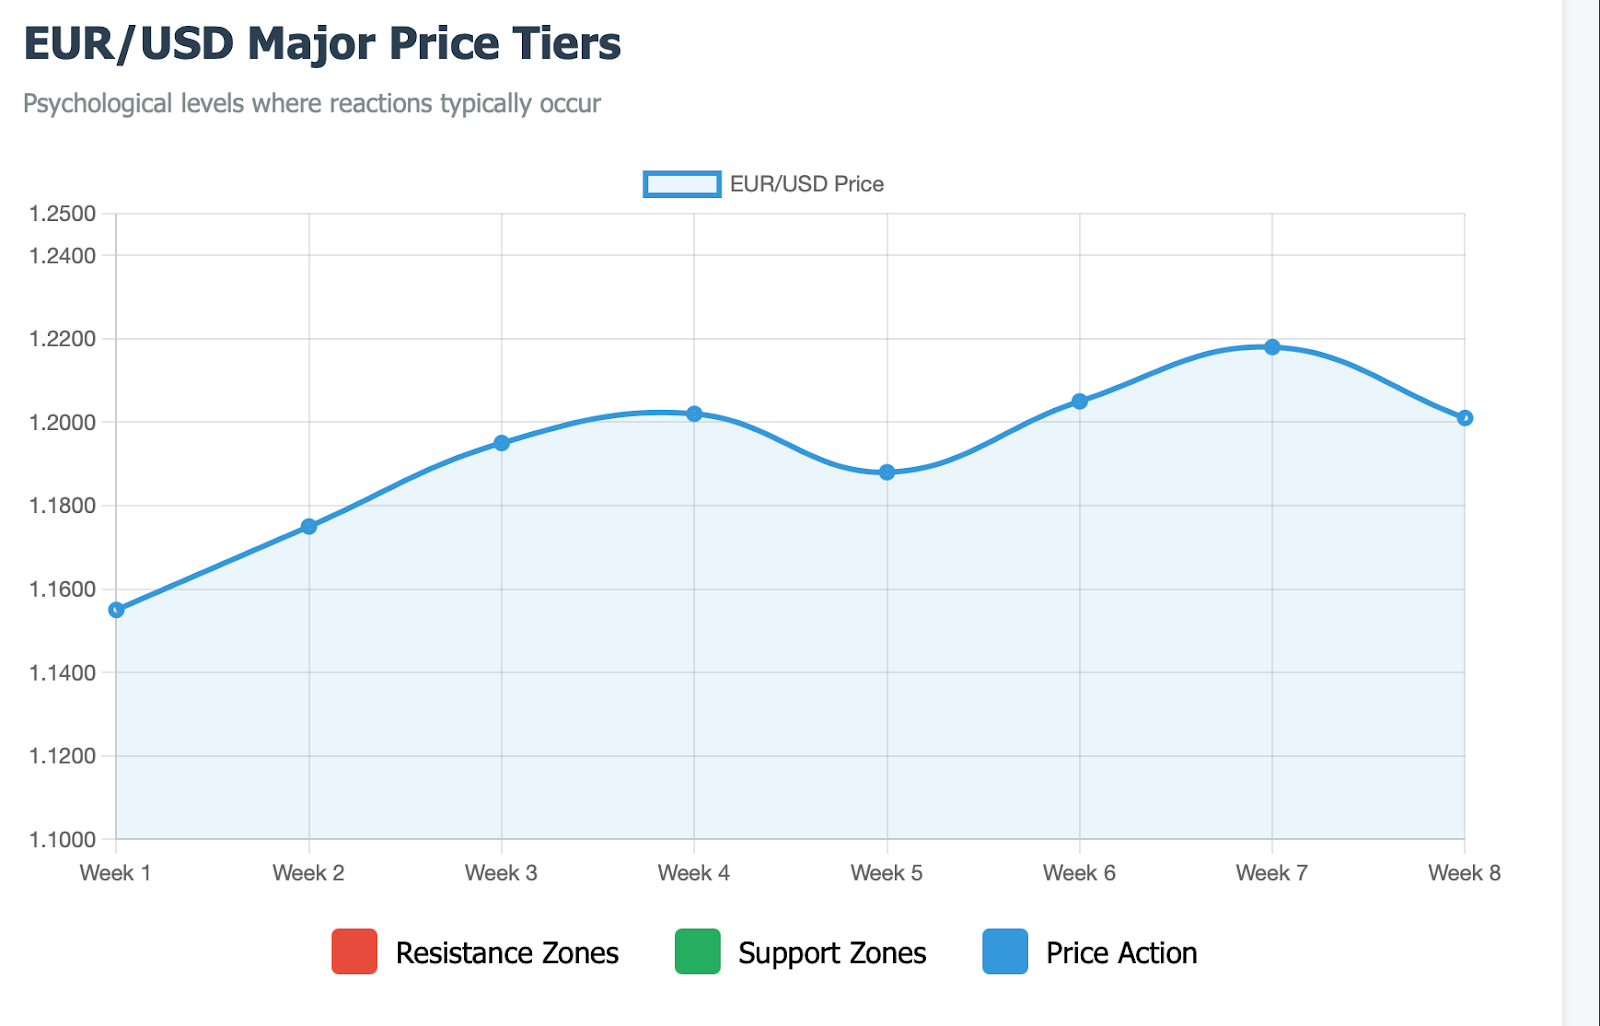
In Forex (or stocks or CFD's) those price level tiers are not just a random number. These are great zones where the pressure of buying and selling reaches an extreme and creates distinguishable support and resistance levels. For instance, when the EUR/USD approaches a major psychological price level of 1.2000, this is going to be a price level that traders globally will begin to take notice of with their trading decisions. Price tiers act as a self-fulfilling prophecy for this very wavelength.
To help explain things simply, picture yourself at a supermarket needing to make a quick decision on whether to purchase a selection of groceries. They are grouped into approximately three tiers: under $10, $10-$20, or greater than $20. You are automatically using those groupings for ease in making a quick decision in your anticipation of purchase. Forex traders do similar things. They utilize price tiers to think of currency prices more in these tiers or price brackets which allows them to notice areas of resistance, support, pullbacks, or breaks in the market.
Professional traders are interested in price tiers for three main reasons. First, price tiers help traders identify where buying interest (support) and selling pressure (resistance) are likely to develop. Similar price levels often appear on charts where the volume of trading is high and where there are many more active market participants.
Finally, just like support and resistance occur at similar prices, price tiers also reflect the market's conscious collective sentiment about a price level. Simply put, if a currency keeps forming bounces near 1.1500, it is communicating something about the psychology of collective traders.
Consider the EUR/USD as a practical example. Over the years, this currency pair has consistently bounced off support and resistance at round numbers like 1.1000, 1.1500, and 1.2000. There is nothing coincidental about pricing, as many thousands of traders are placing component orders, stop-losses, and profit-taking orders at consistent pricing.
Price tiers are not just mathematic concepts. They communicate behavior of human beings and the conscious collective decisions of all the participants trading in that market. Understanding that psychological element is the difference between a trader that finds and uses price tiers effectively and trades just draw lines on charts.
Why Price Tiers Matter in Forex Trading
Price tiers are a means of signaling where the market is likely to move next. Without them, you could trade without a clue and simply react to every price movement without broadening your focus.
Identifying potential trend reversals is probably the most apparent benefit. If a currency pair is in uptrend and suddenly reaches a key price tier, which is a place where the market has previously made a turn, the market is more likely to reverse or stall; this is your signal to either take some profit or tighten your stop-loss or get ready for a potential trading opportunity in the new direction.
Support and resistance analysis are considerably more potent when you factor in price tiers, as a tier that has held multiple times in the past is worth consideration over a random price level that was drawn on the chart. This is the place where bulls and bears have fought before; those fights affect future price behavior.
However, here is where things get intriguing: price tiers become more reliable when combined with a volume analysis. Volume Profile and other tools show you where the most trading took place. When a prominent price tier coincides with a high-volume zone, you’ve found a genuine level of importance to the marketplace.
The Gold (XAU/USD) example is an excellent illustration. The $2,000 per ounce level is not simply a round number; it’s a psychological barrier at which gold has reversed, broken out, and consolidated on a few occasions. Traders prepare for reactions at this level, which increases the likelihood that something will happen.
Think of it in basketball terms. When a basketball team is behind by about 20 points, that becomes a psychological threshold. The team that is behind often lays it all on the line and senses the need for a major effort. In the same way, when a currency pair approaches a substantial tier, traders are trying harder on both sides of the market.
You can observe the same psychological principle illustrated in the behavior of the USD Index at 100. That every one hundred round number has acted, over time, as support or resistance, with price movement accelerated for or against the dollar when the price was taken through that number. Why? Because central banks, institutional traders, and retail all get their charts marked at that level.
More attention being paid at a price tier means the level will have a greater impact; think of it as a neutral feedback loop. Traders are looking at specific levels because other traders are looking at the same levels, and when the masses, or significant participants in the market, are looking at similar price activity, it creates a psychological association with real patterns that you can trade and use to your advantage.
The bottom line? Price tiers take the abstract price movement and turn it into a defined place to potentially place a decision to act. They help answer the critical questions for traders: Where do I get in? Where do I get out? and where am I definitely wrong about the trade?
How to Identify Price Tiers in Forex
Identifying price levels is straightforward, but executing it properly requires a combination of processes. Let's review the simplest-but-most frequent methods traders look at.
Round Numbers: The Obvious Starting Point
Start with the easiest method - just look at round numbers! Human psychology inherently likes round numbers as we have all been trained to pay attention to nice, round figures. Numbers that end with 000, like 1.1000 or 1.2000, or 50.00 and 150.00, will naturally draw your attention because these are natural price points where orders will be clustered as magnets. What trader is not looking at USD/JPY at 150.00? It definitely functions as a key battleground, and USD/JPY is a pair that has been watched by traders around the world.
Online retailers clearly understand human psychological behavior when pricing items on sale for $9.99 instead of $10.00. Your brain, like everyone's else, does form a response to each cent, and a rounding mechanism takes place every time the price is $10.00 and you really are "saving" $0.01 by paying $9.99. In forex, the opposite happens. It is not the $0.01, but the round number itself that triggers the psychological response.
Historical Highs and Lows: Where Memory Matters
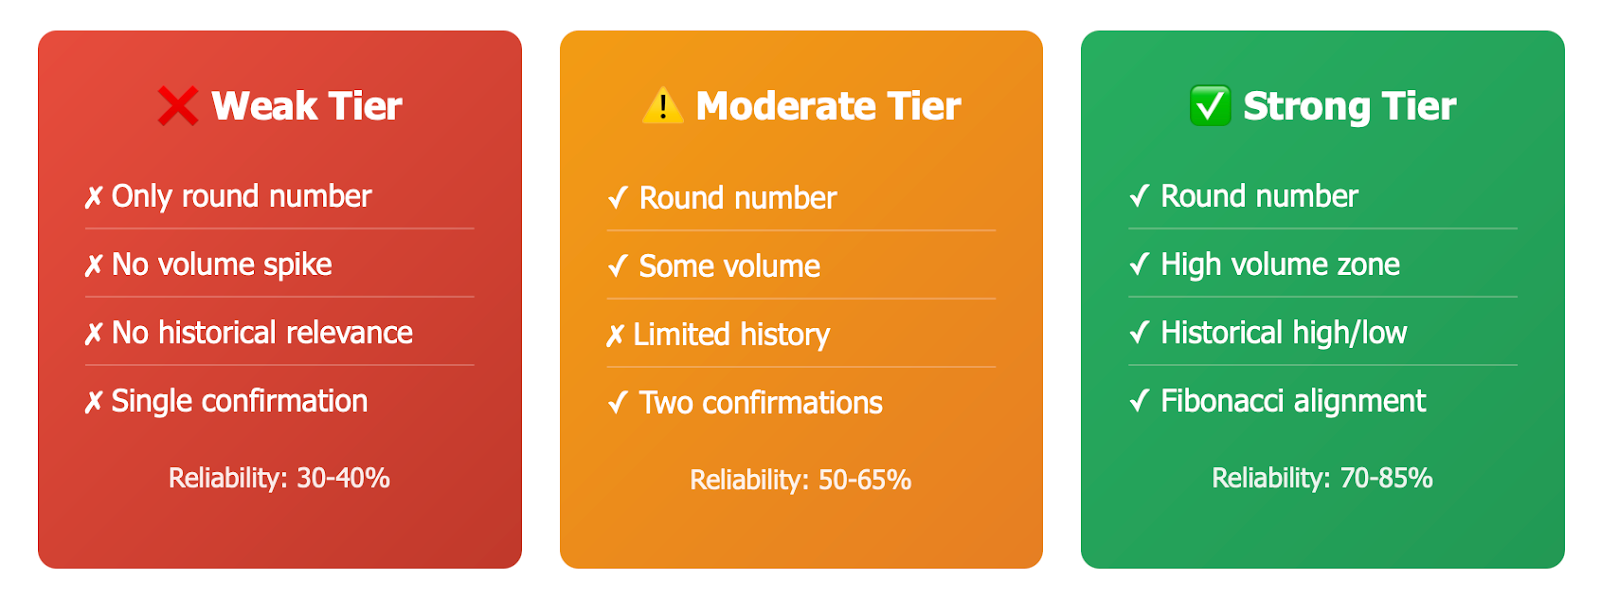
Next, scan your charts for historical highs and lows. Highs and lows had previously existed in price where the market may have reversed, and left a footprint in trader memory. If EUR/USD had a previous high of 1.2300 six months ago, that is signficantly relevant. Any traders who had positions to trade reversals (or let it run), will "remember" the previous highs and react, as others will also react by also reacting.
This technique is effective because the market tends to remember. A support level that held previously is likely to hold again. Similarly, a resistance level that worked in the past to halt a rally will likely work again until it does not (signaling a breakout).
High Volume Zone: Where the action occurs
This is where you can take your analysis to another level. Use Volume Profile or another similar tool to identify areas where the most trading activity happens. High Volume Zones are price points in the market where buyers and sellers have been highly engaged. When price returns to the high-volume zone, most of the time, traders that did not engage usually re-engage.
If you observe GBP/USD fluctuating around 1.3000 you will see this perfectly. If you check the volume data, you will see a significant amount of trading activity at or around this level. This is not by chance; this shows where there is conviction in the market.
Technical Indicators - Add to the Conviction
Finally, in addition to just price levels, you can add technical tools to confirm. For example, overlaying Bollinger Bands on to the chart shows you where price is stretched over or under its recent range usually aligns with tier levels. Additionally, Fibonacci Retracement levels in particular, 38.2%, 50% and 61.8% will also align with the natural price tier levels giving you additional confirmation for price action at cost/price levels.
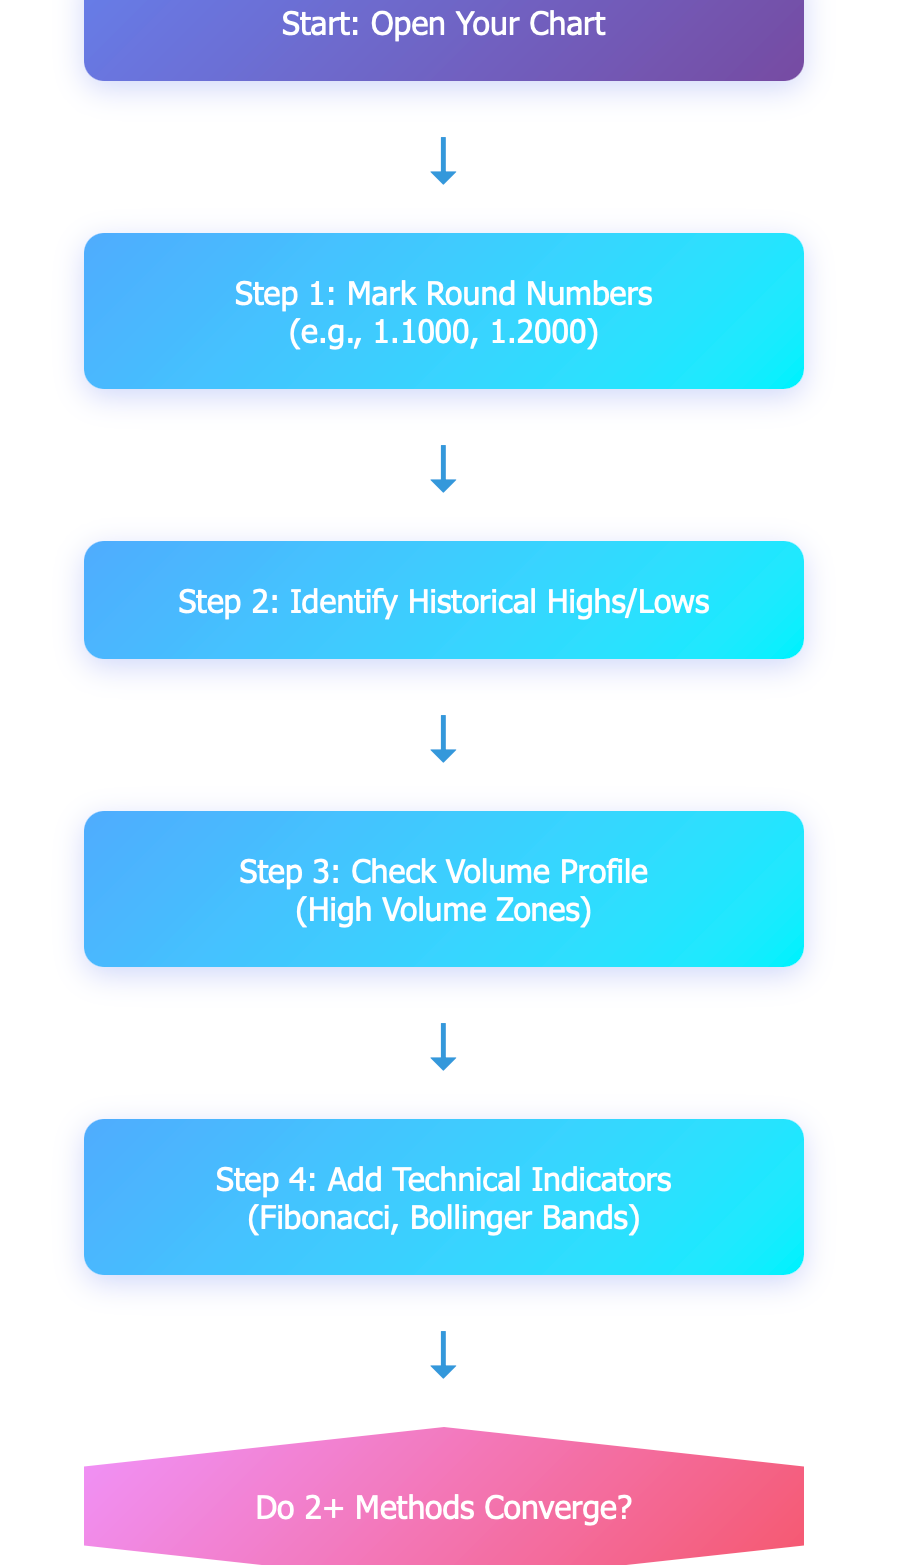

The magic happens when multiple methods converge on the same price level. When a round number aligns with a historical high and a Fibonacci level, you've located a level of price tier worthy of more investigation.
Don't ever use just one method. The most useful price tiers that we can rely on are the tiers of price that are aligned with historical price action, volume concentration, and/or some technical indicator. When you notice all three elements confirm a price tier, that is your signal that the market really cares about that level. I usually start simple with just the round number then add two ways to confirm the price tier (volume analysis, historical price action, and/or a technical indicator) as I gain comfort and experience.
Price Tiers Based in Forex Trading Strategies
It's one thing to know where price tiers exist, it's another to know how to capitalize them based on the strategies you use to keep track of market conditions. Below are three proven strategies.
Strategy 1: Support and Resistance Trading
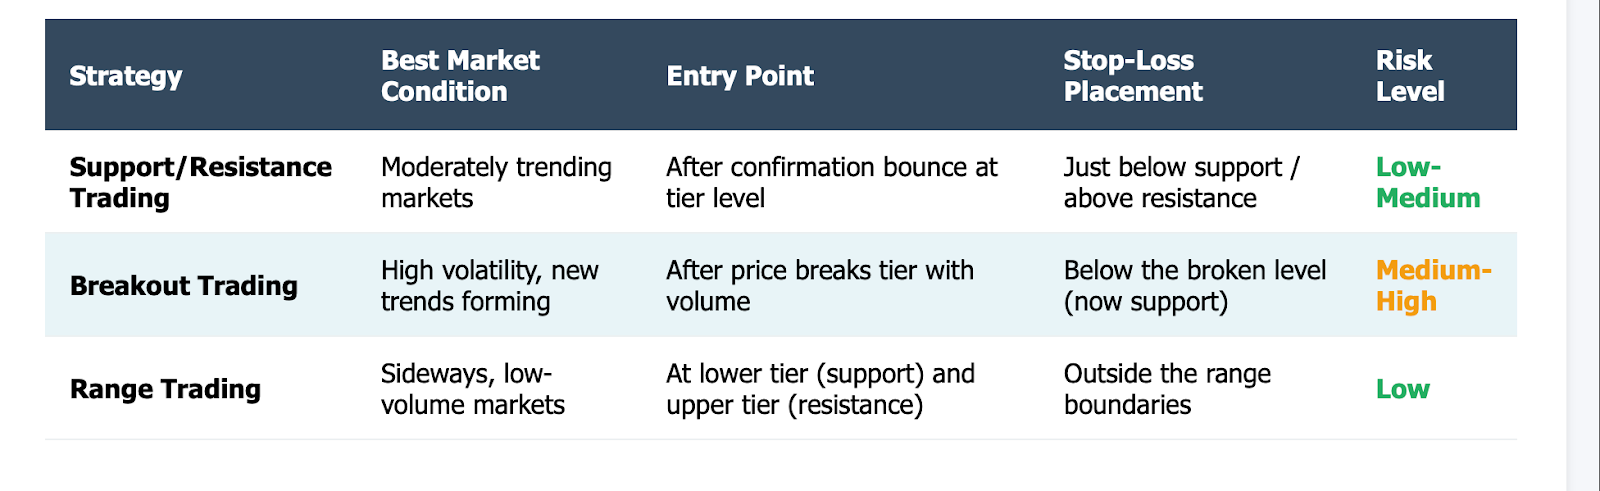
This is probably the bread and butter approach for most scalpers and other types of traders. You enter a trade near specified price tiers (which may range from swing highs and lows, to round numbers to price tails) anticipating that the support price tier will hold for when you buy (purchasing opportunity) the market bounce off the price level, and the same for resistance to stop the upswing when you sold.
The basic part of the strategy set up is to enter a position after price tier confirmation, so that you are not entering the trade a little earlier without any price level structure spins to base your trade decision.
Consider a situation where EUR/USD is coming up to the 1.2000 level from below. You don't just look to buy at 1.2000; instead, you will wait for clues that support is holding, whether through a bullish candlestick pattern, a reduction of selling momentum, or an outright bounce.
Once you see any of those signals, you go long and place your stop loss just below the level. The value of this method is that it is simple and offers a defined risk. You know for sure, out of several alternatives, which option you are wrong on (if the price plows through the level) and where to place your stop loss.
Strategy 2: Breakout Trading
Some price levels fade away, and sometimes they don't. When a significant level fades away, if it was the right price level, that usually is the beginning of a new trend. This is what breakout trading strategy is all about.
For example, EUR/USD has been sideways for some time below 1.2000 and has tested the 1.2000 area countless times during those weeks. Under which scenario does all price levels go away, and high volume, liquidity buyers emerge moving higher? All of that information suggests price has shifted in favor of higher prices and selling was overcome by buying. Once the price overhead breaks out above 1.2000 in increases volume, the breakout demonstrates uptrends other than full price has broken a level considering the total upside opportunities of 1.2300 or higher. You would go long or riding the wave at that point.
The EUR/USD moving above 1.2000 and heading to 1.2300 is just this type of scenario playing out. What was once a ceiling (or resistance) now becomes our new floor (or support). Breakout traders will then take advantage of this shift in market structure.
The risk? A false breakout. The price may trade above a tier (or level) for a period of time and then reverse back sharply, which is why we want to wait for volume, momentum, or follow-through before deploying capital.
Strategy 3: Range Trading
In markets that are not trending, they tend to trade within a range, bound by an upper price tier and a lower price tier. Range traders will take advantage of this by buying near the lower tier (support) and selling near the upper tier (resistance), and repeat this process as long as the parameters of the range holds.
For example, USD/CHF could be trading within the 0.8800 and 0.9000 price range for a number of weeks. Each time USD/CHF sells off to 0.8800 you would buy, and each time it rallies to 0.9000 you would sell. Essentially you are playing ping-pong between the two established price tiers.
The ideal state for this is in a low-volume environment where the market has a lack of directional conviction. The difficult aspect is when to know the price range is about to break, at which case you would adjust your strategy or step aside.
You can think of it similarly to advancing through levels of a video game or a scoring system. Each level indicates the score (i.e. price range) you need to achieve before you progress to the next level. In range trading, you do this over and over at that level (i.e. price range) to achieve points (profit) until the game (market) changes.
Applying Strategies to Market Conditions
Different strategies work best in differing environments. Support/resistance trading works well in moderately trending market conditions. Breakout trading is best applied when volatility increases and a new trend is established. Range trading works best in sideways, choppy markets.
The one thing that is common with all strategies? Risk management. Regardless of the strategy you decide to apply, always risk manage before you enter a trade. Use stop-losses systematically, and don’t risk more than you can take with one position. Price levels give you the parameters, but risk management keeps you in business.
Risk Management with Price Levels
Price levels are an excellent tool, but they will not predict the future. Markets are unpredictable, and risk management is not an option, it will be the difference between being successful in the long run and blowing up your account.
Establishing Stop-Losses at Strategic Levels
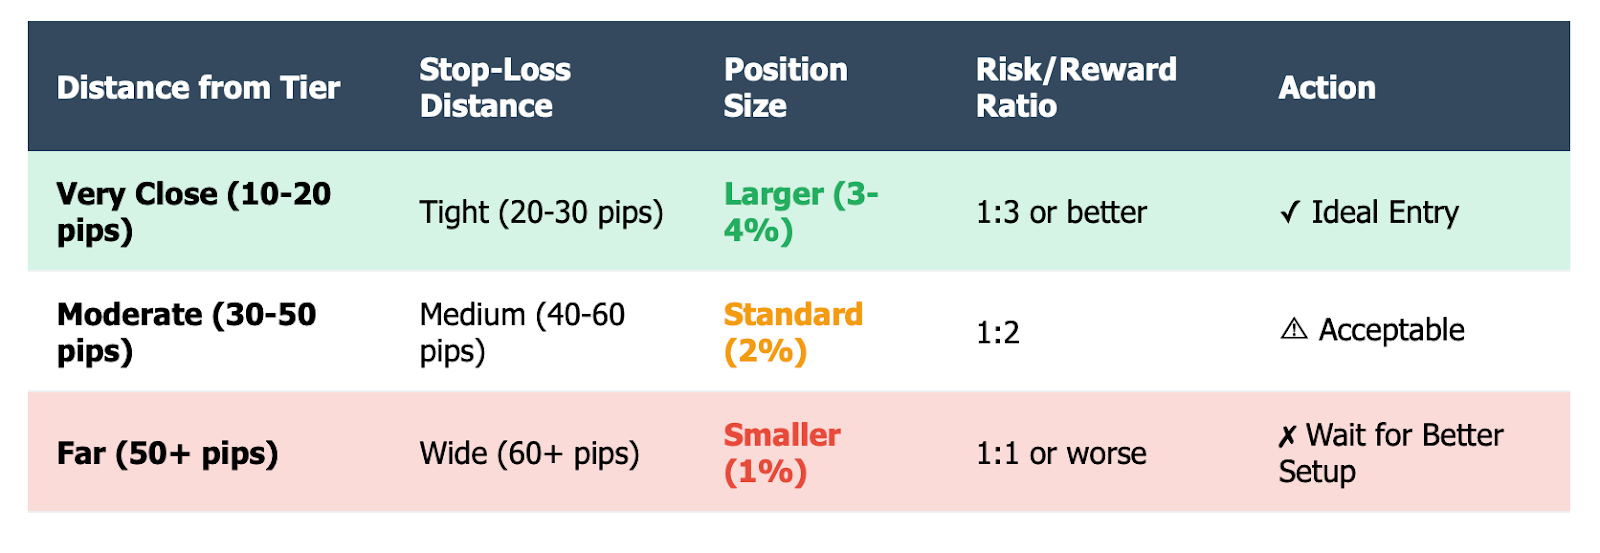
The most actionable application of price levels when managing risk is to place your stop-losses just outside of it. If you're long EUR/USD at 1.1550 but with support at 1.1500, your stop-loss could be placed at 1.1480 just below that level. This allows the trade to breathe while defining your worst-case loss.
Why set the stop-loss just below the level rather than exactly at the level? The market often makes a rapid spike through a level (stop hunts) before heading back in the direction of the original trade. By setting the stop-loss a bit past your defined level, you are providing protection against being faked out while still controlling your risk.
For instance, if you trade EUR/USD with a $10,000 account, and you're using a 2% rules (worst-case loss of $200 per trade), your stop-loss at 1.1480 allows you to calculate how many lots you can trade so that if you are stopped, you'll only lose $200. This kind of math is what separates the professionals from the gamblers.
Position Sizing Based on Tier Proximity
Here is a more advanced concept: adjust your position size according to how close you are to a major tier. If you are entering near a strong support level with your stop-loss nearby (tight risk), you can trade a larger position. If you are entering mid-range with a wider stop-loss, then reduce your position size in order to maintain the same dollar risk.
This dynamic method enhances your opportunity to benefit when the risk/reward is in your favor, while still allowing you to protect yourself when it is not. It is similar to increasing or decreasing the bet in a game board based on how likely you are to lose, bet bigger when the odds favor you.
Avoiding False Breakouts False breakouts are the enemy of tier based trading. Price pushes through a level, you enter the trade thinking a new trend is starting, then reverses quickly and stops you out for a loss. Painful.
Over the years, AUD/USD at around 0.7000 has generated many false breakouts. Traders who chase after these breakouts without waiting for confirmation get whipsawed again and again. Those who wait for confirmation are able to catch the real moves while avoiding the erroneous breakouts.
The Golden Rule
Remember that price tiers are simply tools to identify higher probability setups not guarantees. Even the strongest price tier can break unexpectedly due to a news event, action from a central bank, or sudden shift in market sentiment. Always have a plan for when you are wrong, and always put the protection of your capital first.
Think about it like a board game with a house rule where you can only lose a maximum of 3 rounds and you are out of the game. That limitation forces you to practice discipline. Your "house rule" for trading represents your risk management system, while price tiers help you enforce your risk management system by providing you with clear, logical areas that define your risk.
Case Studies: Price Tiers in Action
Theory is great, but there is nothing better than seeing how price tiers actually work in real markets. Here are some specific examples that demonstrate these concepts in action.
Case 1: The EUR/USD and 1.2000 Level
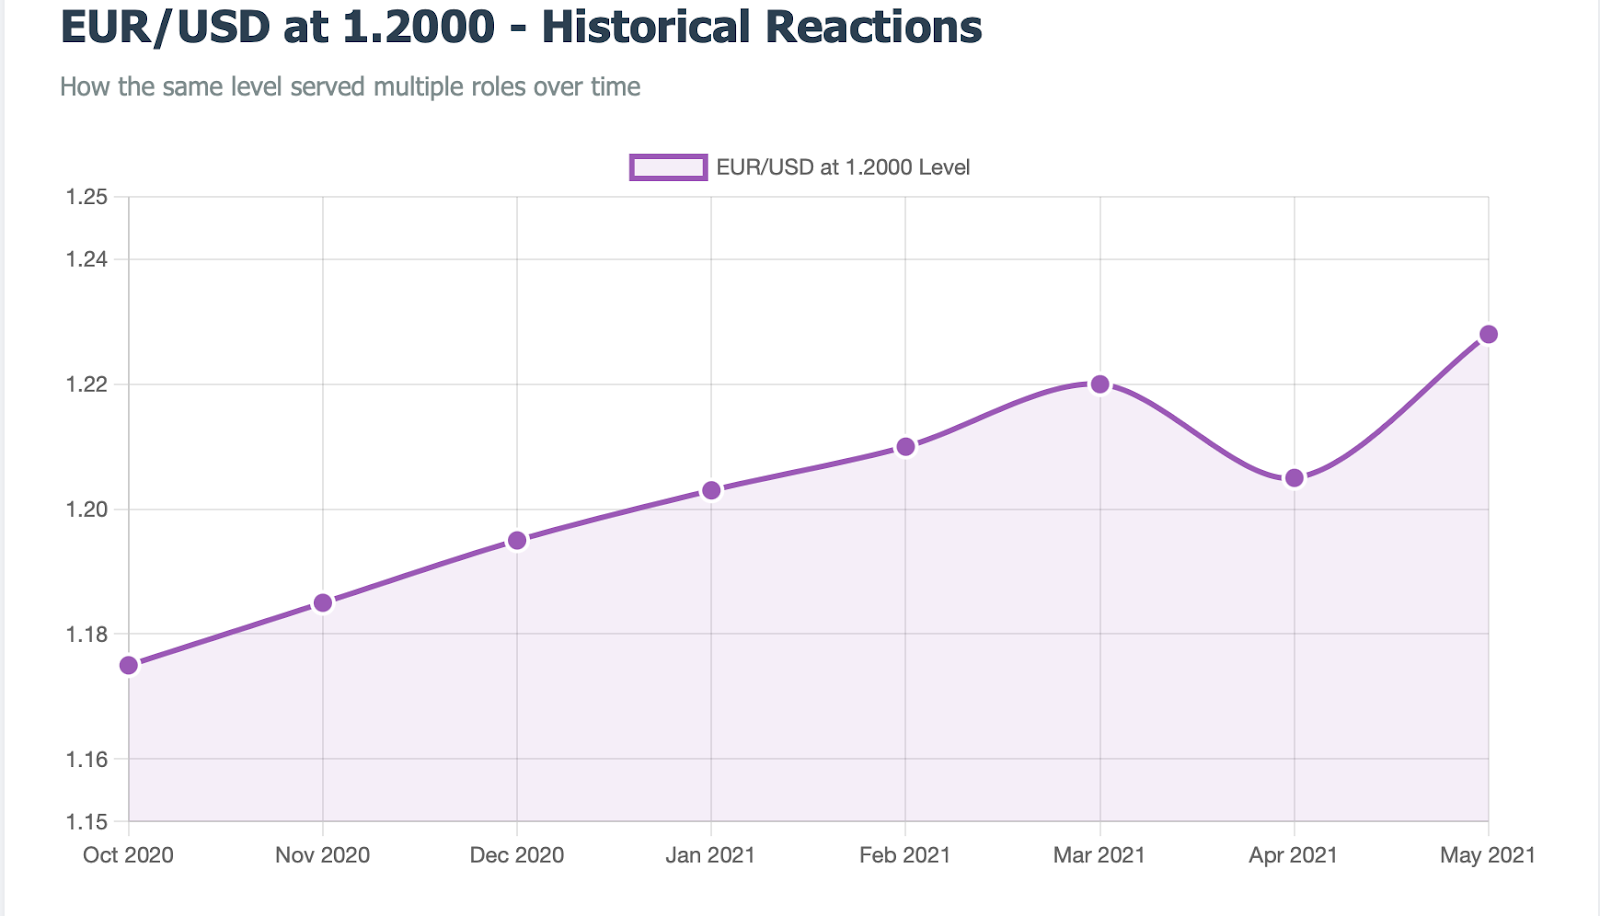
The 1.2000 level in the EUR/USD pair has served as a key psychological and technical level for years. In 2020 and 2021, the level acted as support and resistance multiple times, resulting in clear trading opportunities.
When the EUR/USD pair initially reached the 1.2000 level from below in late 2020, we saw intense selling pressure. Traders who noticed the level as resistance could have taken short positions and made a profit as the price dropped toward the 1.1800 level. Months later, when the pair broke above 1.2000 with conviction, the level acted as support; breakout traders who went long capitalized on the rally back to 1.2300.
What makes this case so valuable is that the level simultaneously served both roles, either stopping price advances or supporting them once broken. This role reversal typically occurs at considerable price levels and can double your trading opportunity in recognizing the shift.
Case 2: Gold at Its $2,000 Psychological Barrier
Gold (XAU/USD) at or around the $2,000/oz. also serves as a classic example. The round number has produced sizable reactions repeatedly since gold first traded up to the level in 2020.
Trading volume increases each time gold approaches $2,000. Why? Central banks, institutional investors, and retail traders all consider $2,000 important. When gold crossed above $2,000 decisively in 2020, it marked the beginning of a new bull phase. When gold pulled back to re-test $2,000 as a support level traders bought aggressively, confirming the significance.
The lesson is about convergence. When a round number also has historical significance and institutional participation all aggregate to the same tier, you have a level that has to be respected. Ignore it, and you do so at your own risk and to probably make a profit off of.
Thinking by Analogy
Think about exam scores: 60% is passing, an 80% is excellent. While only numbers, these create an influence on the behavior and motivation of students. A student at 59% will work frantically for one more point to pass, while a student at 79% will feel he or she is in excellent and not want to drop behind and work to progress further to excellent.
Currency markets have a similar behavior. 1.1999 EUR/USD is not the same psychologically as a 1.2001 EUR/USD. Even though they are only two pips apart, the round number creates threshold in perception that will influence thousands of traders in their decision other the same time, whether they know it or not.
The Pattern Behind the Cases
What is the commonality these scenarios share? All exhibit price tiers acting as focal points and market psychology is heightened. Price levels are not magic numbers where the market has to reverse or even shoot higher. Rather, price tiers are areas where traders pay special attention causing a market focus which tends to drive stronger buying or selling patterns.
By reviewing historical case studies, you are layering the pattern-detection capability, not only understanding where price tiers emerge, but also how and why markets behave in this manner around price tiers. This first-hand experience collectively is carried forward in future trading decisions, thus enhancing one’s ability to act as a successful trader and achieve better trading results.
Conclusion and Actionable Advice
In summary, price tiers provide structure to your learning about market behavior to aid in the decision making process surrounding your trading. They provide a structured area where market psychology intersects with technical analysis while providing definable levels to develop strategies.
Price tiers are specific price ranges where active trading aggregated, therefore roles as support and resistance. Price tiers emerge from various factors including: Hull number, previous highs and lows, previous volume movers, therefore technicals economic models. Once you identify your price tiers, you now have several options for establishing a trade either utilizing support/resistance, trend breakout and range bound depending on the market atmosphere. But most importantly, utilize price action to set your risk through circulating stop losses and position sizing.
The true power of price tiers comes from applying theory with practice. Don't just read about EUR/USD bouncing off 1.2000 - open your charts and find these levels! Mark these levels, see how price reacts to them, and develop an understanding of which tiers matter most in your markets.
If you're new to this, start simply. Track the round numbers of a single currency pair and see what happens as price approaches these levels. Do buyers come in as support? Does resistance hold? Once you are comfortable with this basic observation, add volume analysis and technical indicators to improve the determination you have for levels.
Price tiers are not fortunetellers; they are probability tools. A strong price tier increases the likelihood of a reaction; it does not ensure it. The markets often surprise us. This is why risk management cannot be separated from your tier analysis - it is built into every trade.
The successful traders who utilize price tiers are the ones who understand that they are a framework and not a formula. They integrate tier analysis with the larger market context, the economic fundamentals price movement, and conscious risk almost religiously. They know when to have faith in a given level and when to ignore it because the environment has shifted.
Begin to use price tiers in your trading beginning today. Simply mark them on your charts, backtest strategies around them, and most importantly, protect your trading capital in the process. With time and attention, the patterns will become evident to you, and those patterns can be the foundation of a systematic trading method.
Are you ready to incorporate price tiers into your trading endeavor? I encourage you to open your charts right now and mark three nearest round numbers in your most prominent currency pair and watch with excitement over the next week as the market principles behind the price tiers you have established become an influence.
Disclaimer: The content of the blog does not represent any position of Trade W, does not serve as any trading-related decision advice, and does not endorse any third-party.