

 Trade W
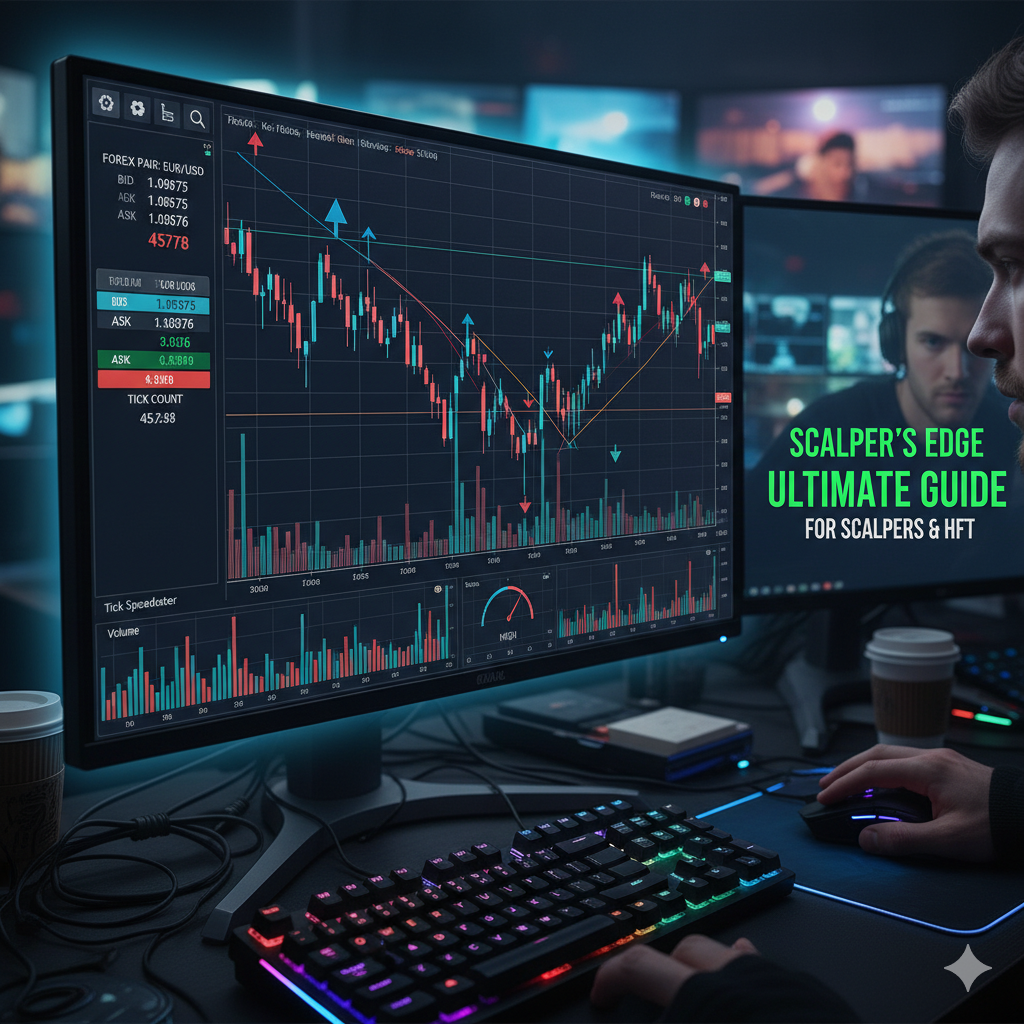
If you ever wanted to know what causes price movements in the forex market to happen so quickly, you've just seen tick movements in action. These price movements may seem small to you, but they are the very basis of today’s trading strategies.
What Is a Tick, Anyway?
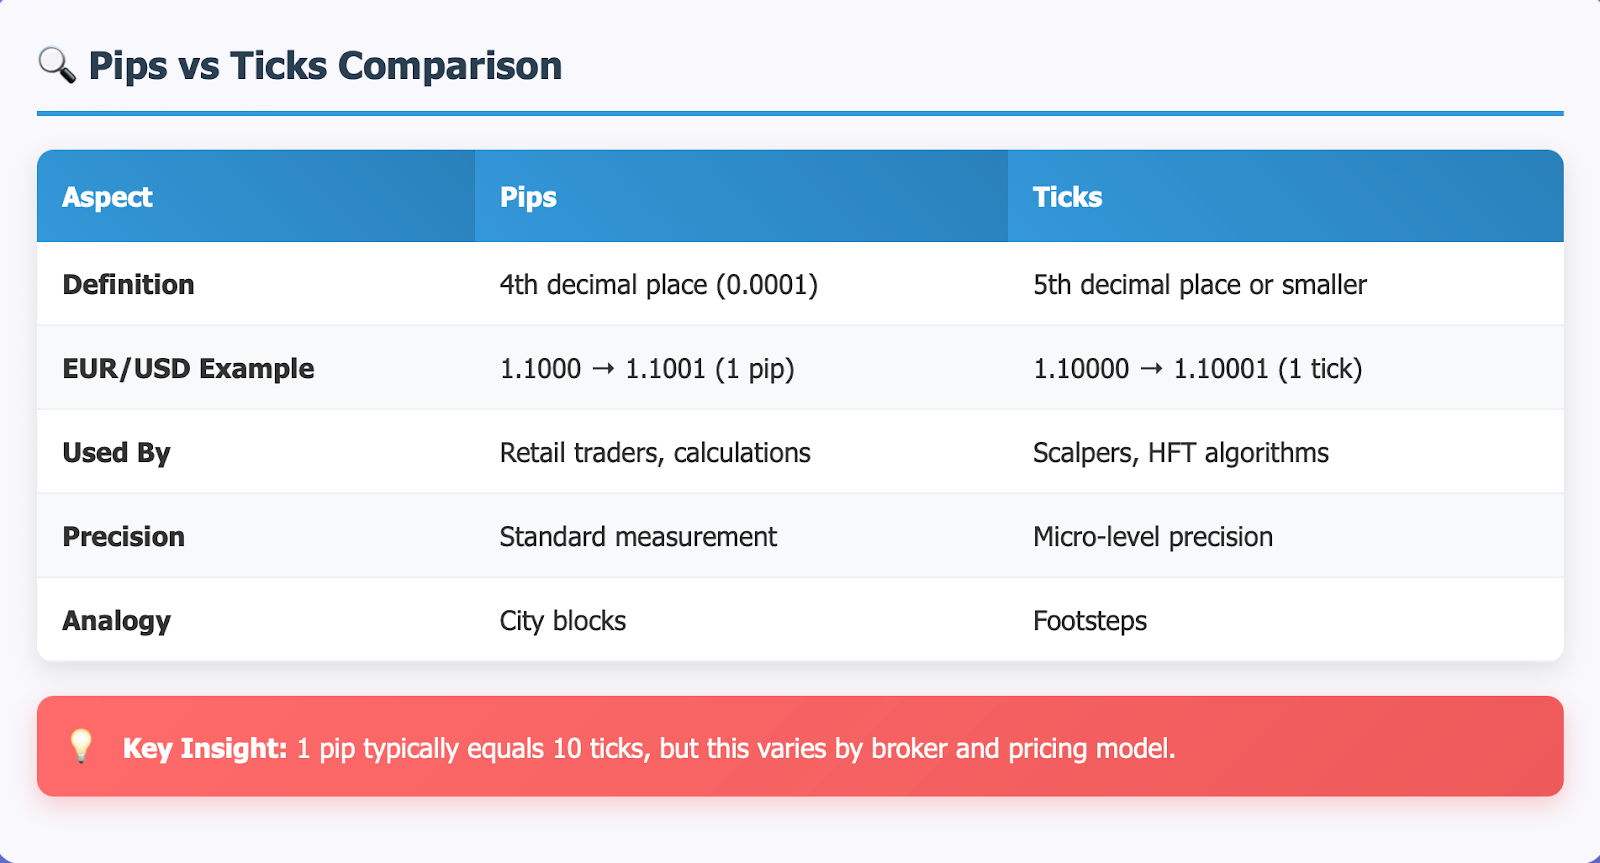
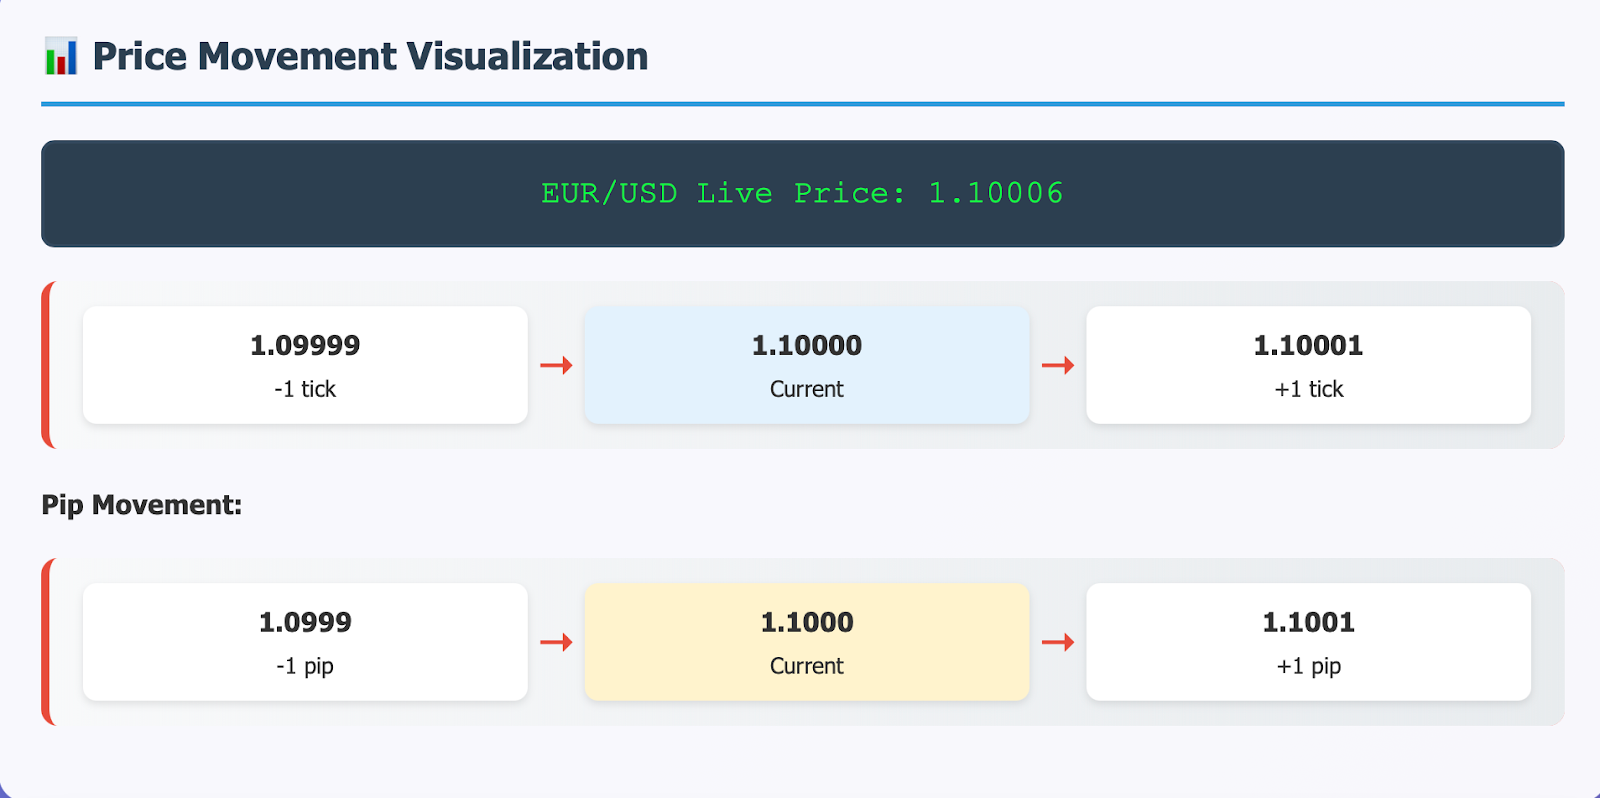
A tick is the least amount of price movement in a financial market. Think about it like this; a tick is like the least amount of movement a video game character can take – a tick is one small movement in either forward or backward prices. In forex trading, ticks are even smaller than pips, and then smallest way to measure prices in the most precise manner. For example, when the EUR/USD moves from 1.10000 to 1.10001, this would represent a change of one tick. Pips typically measure the fourth decimal place (0.0001), while ticks measure at the fifth decimal place or more, depending on the broker.
The difference is that pips are a standard trading measurement used by traders in calculations, while ticks are used more to measure incremental price movements simply. It is similar to comparing city blocks (pips) to footsteps (ticks). Both are measurements of how much distance has been covered, only the measurement and scale are incredibly different.
While many retail traders prefer to work with pips, it's simpler and easer, serious scalpers and algorithmic traders reside in the ticks world. These micro movements capture market behavior in ways longer timeframes can't.
Why Ticks are More Important Than Most Realize
You will find that every established scalper would likely tell you the same thing - the true understanding of ticks is what separates the amateurs from the professionals. If you're leaving a trade into a position for minutes or even seconds, that one tick can determine if the trade will be successful or not.
A high frequency trading algorithm will make thousands of decisions every second based on tick data. They are not using 1 minute or 5 minute charts, they're basing a decision off pure tick movement for the opportunity of trade lasting seconds or less. Tick data is everything when operating a tick based systems.
Even if you are not looking to plug in high level algorithms, having some tick awareness will enhance your trading in several ways. You will be able to tell when your order gets filled slightly off from where you had expected (slippage at the tick level) and your instinct on market timing will develop.
Consider it this way: looking at pip movements only is like listening to a discussion and only being able to hear every tenth word. You’ll get the gist of it, but you will miss important pieces of information that could alter your experience significantly.
Professional traders utilize tick data to identify micro support and resistance levels that are undetectable when using traditional charts. In each case, these levels will generally provide the best entry and exit points for quick scalps, especially during times of volatility.
Ticks, Spreads and Transaction Costs
Anytime you enter an order, you are facing the spread, which is the difference between the bid and ask price. Spreads are reported with pips as the unit of measure, but spreads are really made up of multiple ticks.
To illustrate, if the spread for EUR/USD is 1.2 pips, the spread is approximately 12 ticks (this depends on the pricing model used by your brokerage). Understanding this conversion greatly helps calculating transaction costs accurately, as studying ticks will allow you to calculate your trading costs down to the smallest unit of measurement.
Slippage occurs at the tick level (one pip could represent one or many ticks). High-impact news events often cause prices to jump nine or many ticks in the span of milliseconds, and all of the sudden you might find your market orders have filled nine ticks away from the displayed market price.
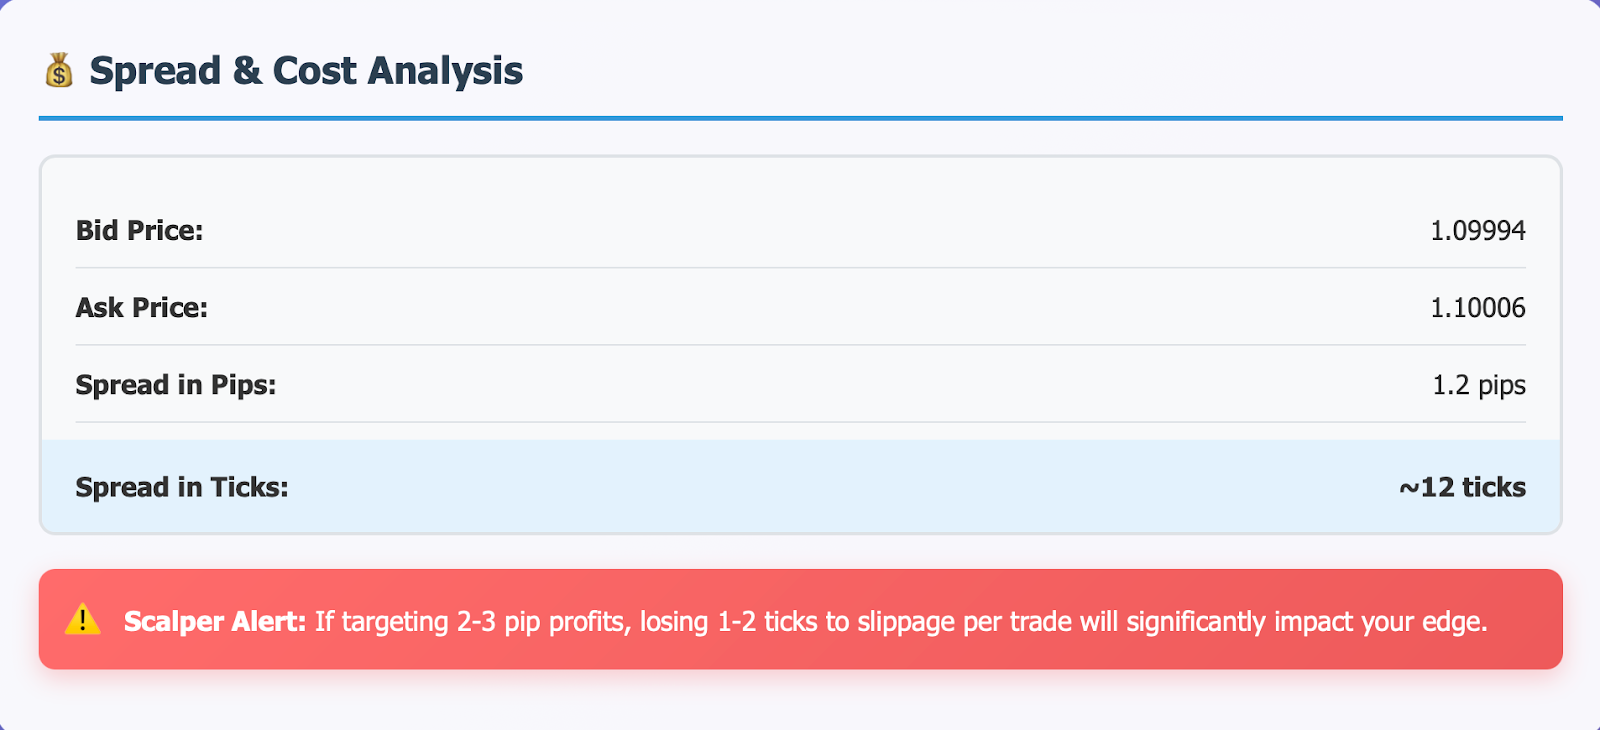
Astute traders incorporate tick-level costs into their trading approaches. If a scalper is looking to make 2-3 pip profits, losing 1-2 ticks to slippage on each transaction will cripple their edge. This is why many scalpers use limit orders instead of market orders because they don't want to risk missing out on a fast move.
So, what we see is that the most elite short-term traders handle each tick like it is pure gold. They realize that when you stack up slight tick advantages over hundreds of trades, you will come away with a large profit over time.
Understanding Tick Charts for Micro Market Analysis
Time-based charts represent activity based on every minute, hour, or day. Tick charts represent activity based on every X number of trades no matter what time it is occurring. This distinction is very important when we want to evaluate activity in the market.
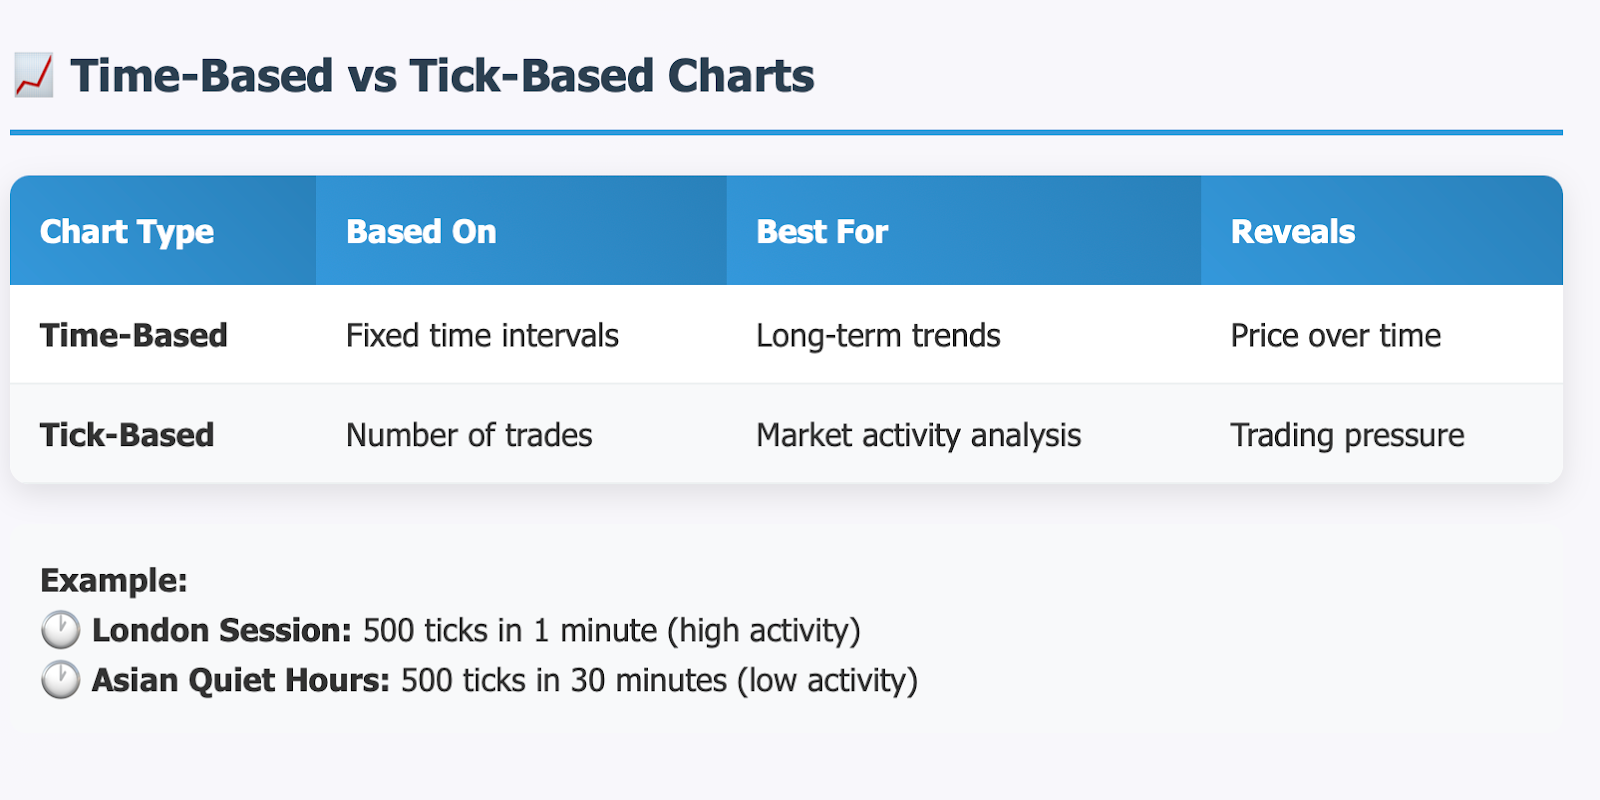
On a 1-minute chart, it is possible to see a flat line at first, then explosive moves in price that have occurred after trailing simply account for a ton of ticks fired in a very active or volatile situation. This is where the tick charts provide essential insights into trading activity during periods of anticipation – it gives the trader the ability to measure when legitimate buying and selling pressure builds up unbeknownst to the longer-term indicators.
Tick charts filter out the "noise" of time and aggregate it purely around the activity of the market. For example, during the overlap of the London session, you might see 500 ticks flash within one minute! During very quiet hours for Asia, those same 500 ticks might take 30 minutes to accumulate.
Common trading platforms such as MetaTrader 4/5 and TradingView provide tick chart possibilities, albeit you'll need to install plugins or purchase features to enhance your tick analysis. By contrast, many professional traders utilize more specialized software that offers a raw feed of tick data to create the most accurate assessment of market trends and patterns.
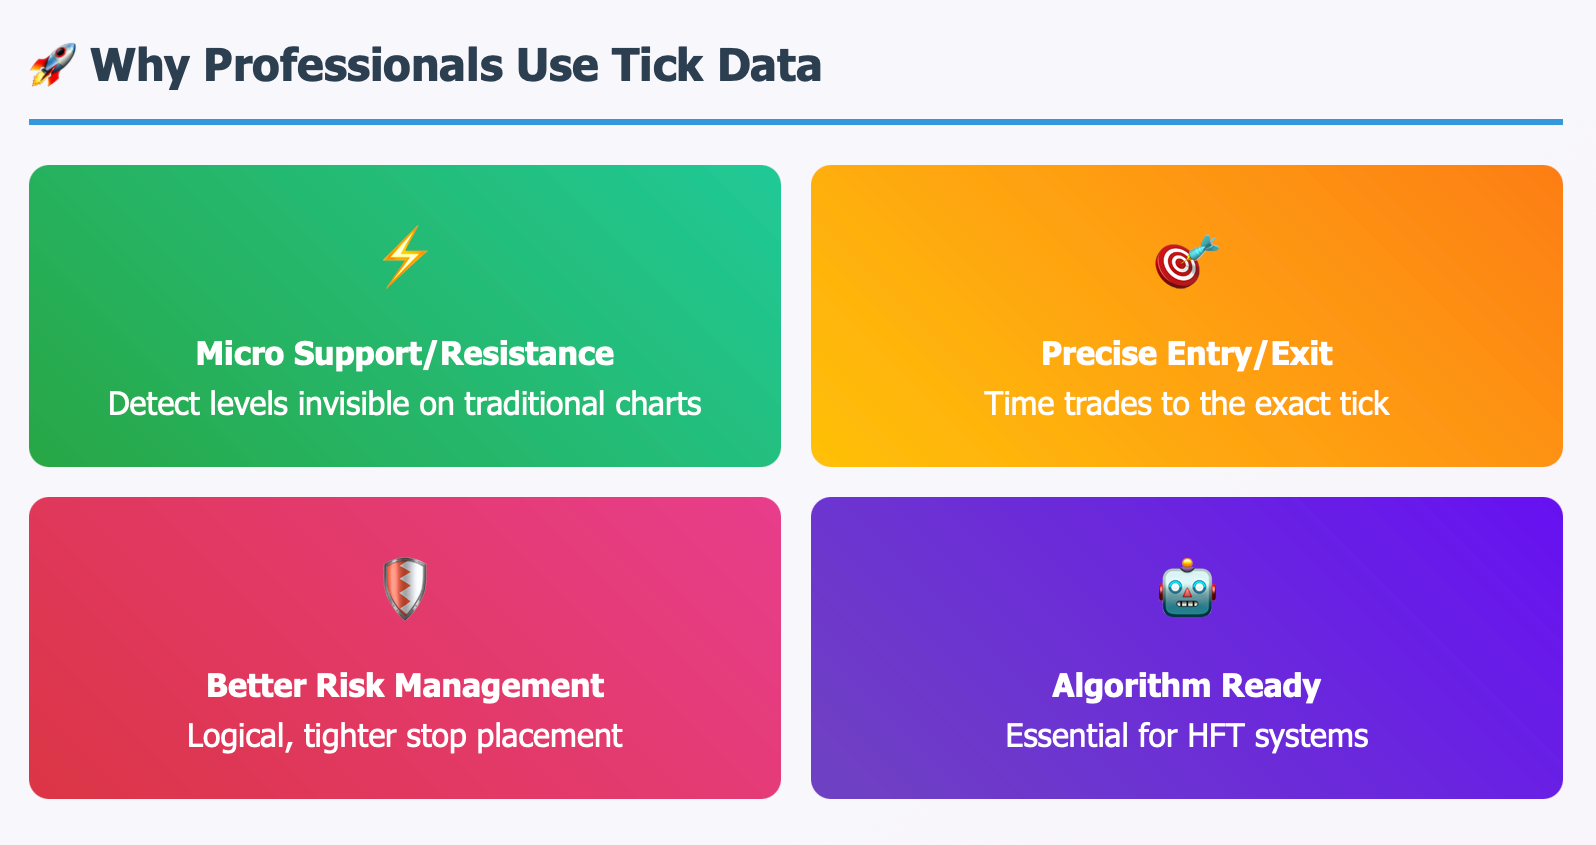
The primary benefit of tick charts is the visualization of patterns. Support and resistance levels, trend lines, and breakout patterns tend to illustrate with greater clarity on tick charts than time charts, because there is not an arbitrary amount of time that has passed but simply a record of trading.
Practical Utility of Tick Charts for Forex Traders.
Scalpers will use tick data to pinpoint the actual moment momentum shifts in their favor. Instead of relying on a full pip, they often recognize the first couple of ticks in the development of a breakout and will place their trade at that moment.
Algorithmic trading systems are very reliant on tick data to create a decision in a fraction of a second. These systems will study patterns in the sequence of ticks, along with volume, and the timing of each tick, to create an assessment of the short-term ticks with remarkable accuracy.
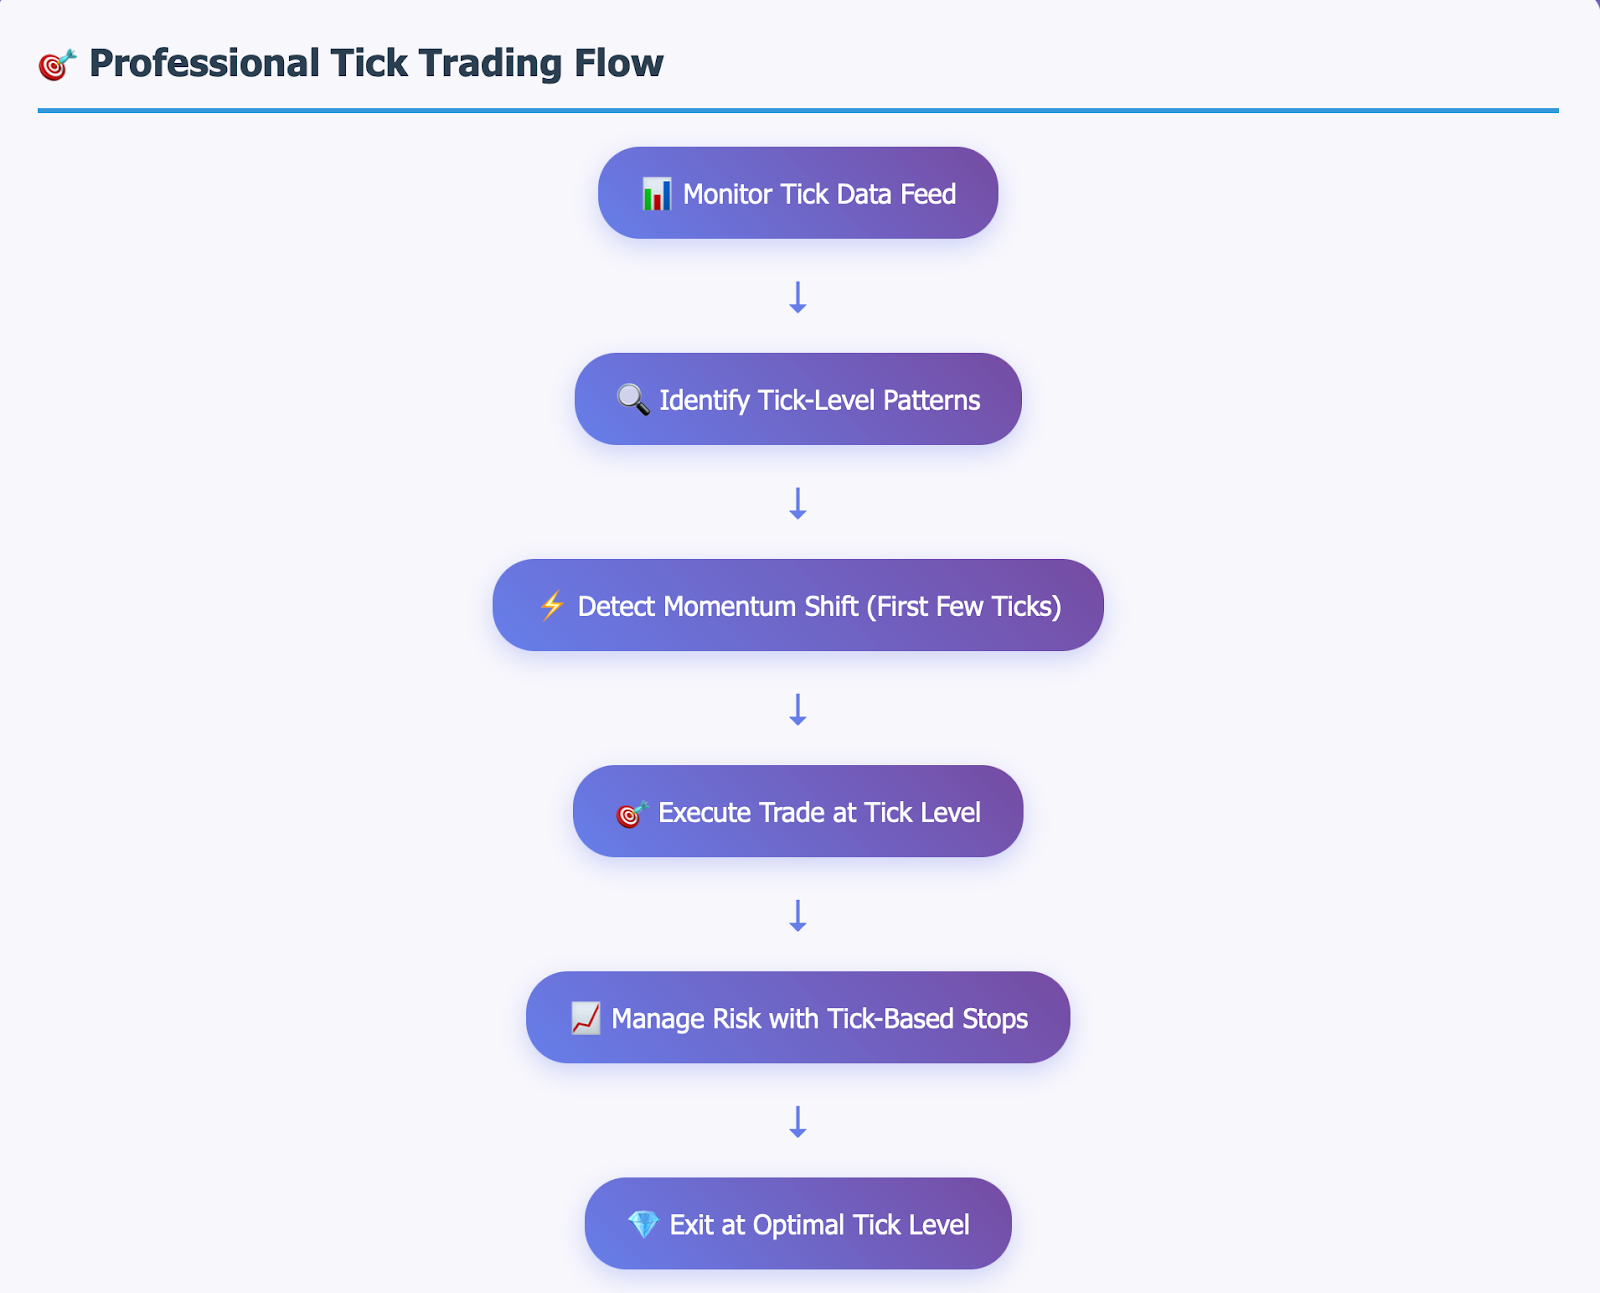
Even manual traders can take advantage of tick awareness. Observing how prices act at key levels on a tick-by-tick basis displays market sentiment that longer timeframes are not going to display. Will price immediately bounce from support, or will it push through a few ticks before reversing? These details are important to time entries and exits accurately.
Risk management increases as well when you understand ticks. Rather than using random pip based stops, stops can be placed based on actual price action at the tick level, and will typically result in more logical and tighter stop placement.
The primary error that traders make in regards to tick data is, word for word, overreacting to every tick that moves even slightly. Not every tick tells a story - not every tick represents an actual ethos shift; some of it is random market fluctuation, and price will indeed fluctuate randomly for some time. It is necessary to develop the skill to distinguish what ticks mean something from noise.
Read more: CFD Trading Exposed: Are Trade W’s Competitive Fees Worth the Risk?
Key Takeaways- Your tick trading foundation.
Ticks serve as the purest form of market movement data available to traders. While pips do afford convenience in terms of any required calculations (calculating 'a pip', profit/loss from entry, absolute pips to target, etc), ticks provide access to the mechanics of real-time price discovery.
Understanding the latency between ticks, spreads, and trading cost provides immense leverage for managing risk and entries. Every successful scalper, and algorithmic trader, operates from an understanding of this foundation.
Tick charts and tick data analysis provide trading opportunities that simply aren't available on traditional time-based charts. The goal is to learn how to differentiate real patterns from general market noise.
Are you ready to look at your trading activity at the tick level?
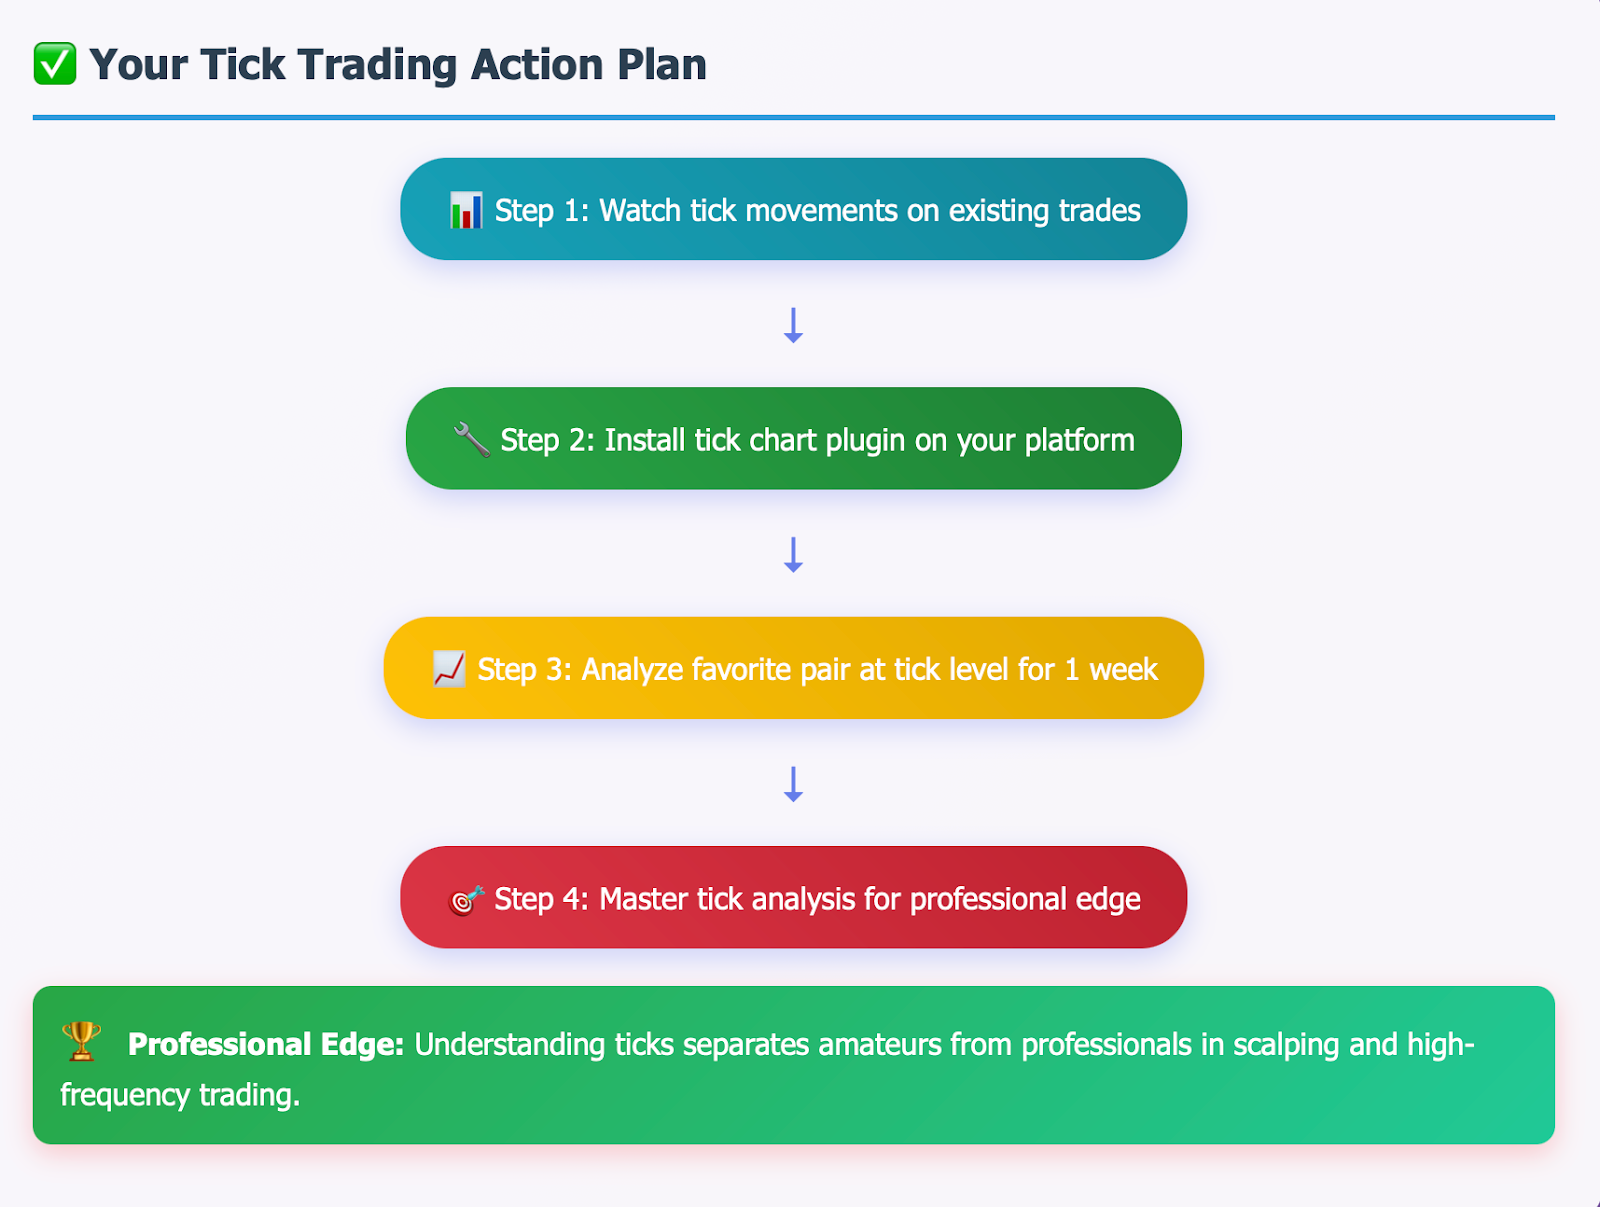
Start by watching the ticks move on your existing trades; you will be amazed by what you observe with tradewill.com
Download a tick chart plug-in for your trade desk, and for a week analyze your favorite currency pair at the tick level.
When you master tick analysis, you will be part of the group of traders that see opportunities that the crowd simply overlooks.
Disclaimer: The content of the blog does not represent any position of Trade W, does not serve as any trading-related decision advice, and does not endorse any third-party.