

 Trade W
The forex market is fast. Prices move up and down in seconds. Traders need a way to measure these movements and how far prices could potentially travel in a day.
Enter ADR - Average Daily Range. ADR is a simple statistic that tells traders how much the price moves across the day. Specifically, it measures the average distance between the daily high and daily low price taken over a number of specified days.
Even the smartest forex traders will use the ADR measure to set potential profit targets, establish stop losses, and manage risk. You'll learn everything there is to know about ADR, including what ADR is, how to calculate ADR, what to do with ADR in your trading, and how to apply it in your trading plans.
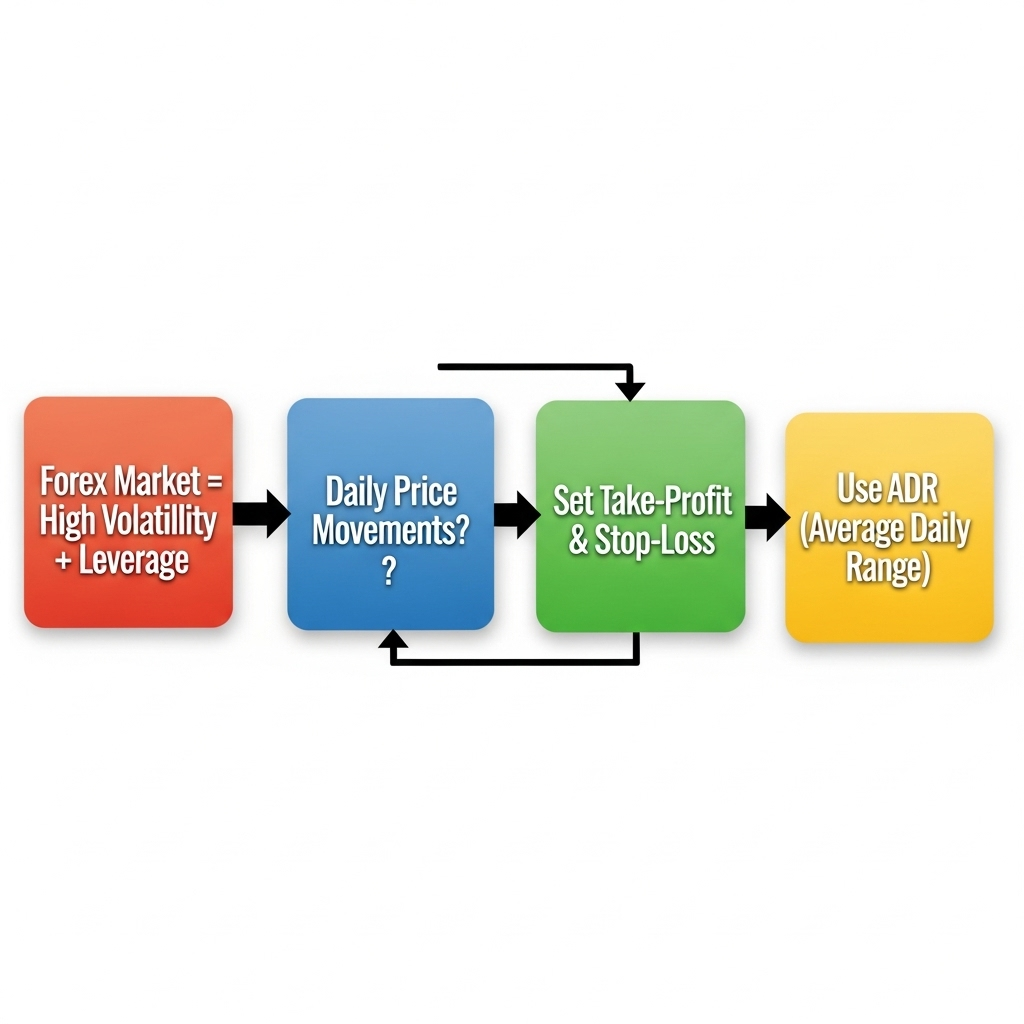
This article organizes these learning goals into clear headings and sections to maximize your learning. We will first cover some basic definitions so we have enough knowledge to do some calculations eventually. Then we will explore and perform calculations with our data. We will then examine some trading strategies with ADR. We will also locate ADR among other similar indicators and evaluate its worth potentially. Finally, after reading this article, you will know exactly how to go about adding values of ADR into your results when you trade forex.
What is ADR?
ADR, or Average Daily Range, is a measurement of the average price movement of a currency pair on an average day. Traders generally take the ADR reading for a particular currency pair over a number of periods or days. The most common timeframes traders will look at are 14 periods or 20 periods.
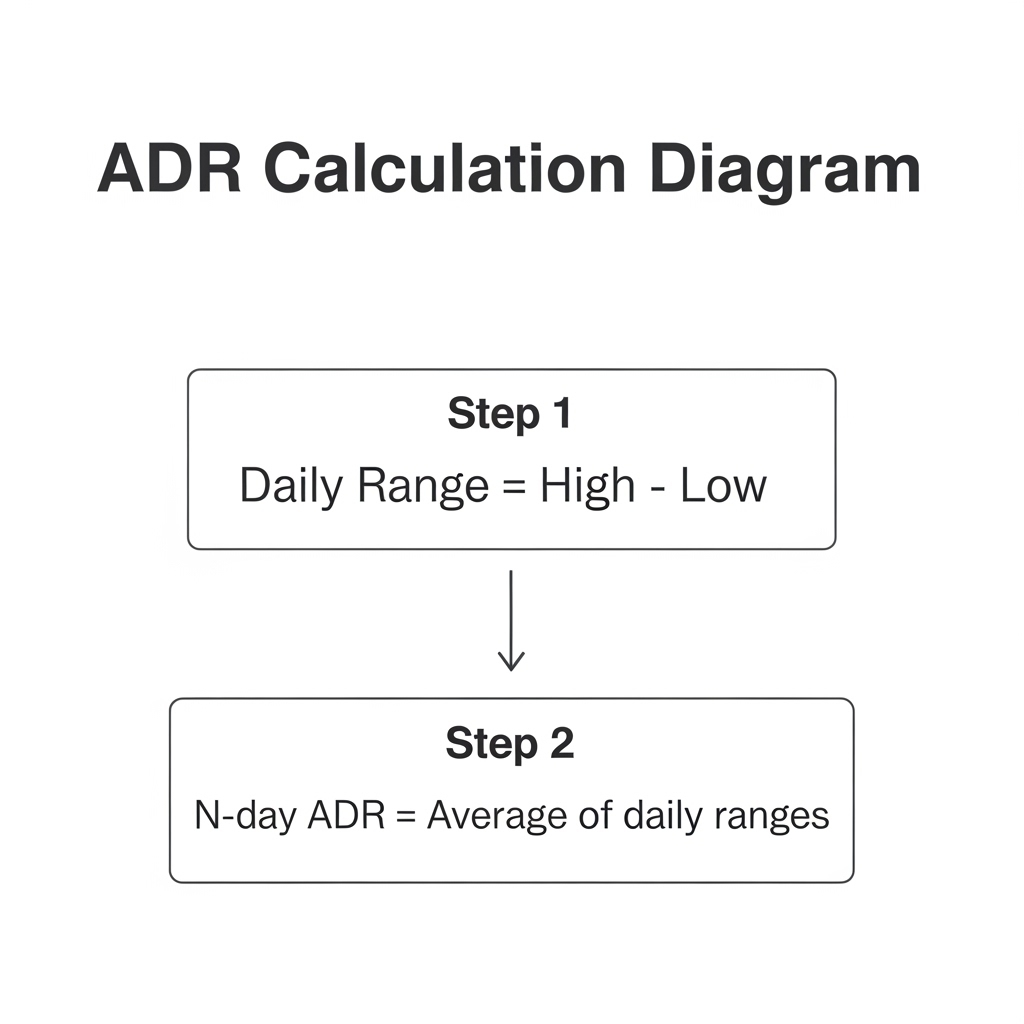
The calculation for ADR is fairly straightforward:
Daily Range = Daily High - Daily Low
ADR = Sum of Daily Ranges ÷ Number of days
Imagine EUR/USD has the following daily ranges over a 5 day period:
Day 1: 85 pips
Day 2: 92 pips
Day 3: 78 pips
Day 4: 88 pips
Day 5: 82 pips
Your 5 day ADR = (85 + 92 + 78 + 88 + 82) ÷ 5 = 85 pips
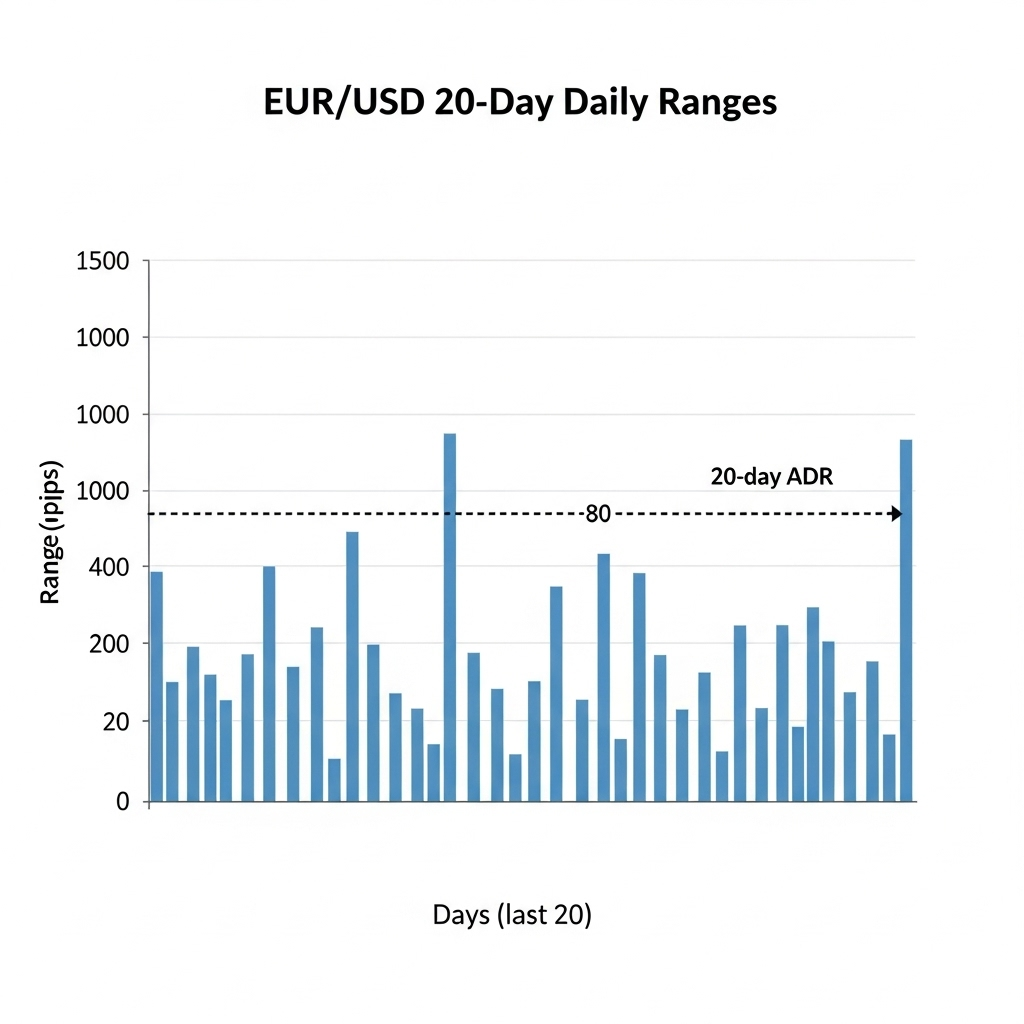
This means EUR/USD moves, on average, 85 pips per day. Traders will then use this figure to project a workable basis for their expectations regarding a realistic price movement. Using this information traders will better understand that the currency pair may move about 85 pips in either direction.
You can think of ADR as keeping track of your daily step count. As you walk, each day is different in total for number of steps. but if you continue day after day, eventually you have an average of steps. If you average 8,000 steps when you wake up tomorrow you expect the same amount of steps (on average) the next walking day. ADR behaves the same with regard to currency price.
ADR is directly linked to volatility. High ADR is high volatility, low ADR is low volatility. Price fluctuations among highly volatile currency pairs present opportunities to trade, while it also represents risk. Less volatile currency pairs are safer and less risky, but there is less potential to profit.
Before professional traders enter trades, they check ADR. They also view it to size positions, set stop losses, and take profits. If a trader knows how many pips EUR/USD typically moves during the day, they have a better understanding of what is normal for it.
Why Is ADR Important for Traders
ADR is important for traders in several different ways. First, ADR helps traders set reasonable targets. If EUR/USD has an ADR of 80 pips, trying to target 200 pips might not be realistic for one day. Targeting 60-70 pips makes sense, and you know it can realistically move that much.
Second, you can use ADR to help you with stop losses. If a pair has an ADR of 100 pips, a 20-pip stop loss might be hit by normal price noise. A 40-pip stop loss gives the trade a little room to wiggle.
Third, ADR helps determine position sizing. If you are trading a higher ADR pair, you need to have a smaller position size. If you are trading a lower ADR pair, it can handle a larger position. Keeping risk consistent across trades is important.
To put this in perspective, think about how much a game typically scores. A basketball game usually ends up in the range of 80-120 points. You wouldn't expect a game to be 200 points; that would also be stupid. ADR is the same; it tells you the price's normal range.
Many professional traders rely on an indicator called‚ Average Daily Range or ADR, for pair correlation strategies. For example, the EUR/USD and USD/CHF currency pairs are often stronger inversely correlated pairs. When the EUR/USD price moves 60 pips up, and its ADR is 80, there will have been 20 pips left for the USD/CHF to move lower.
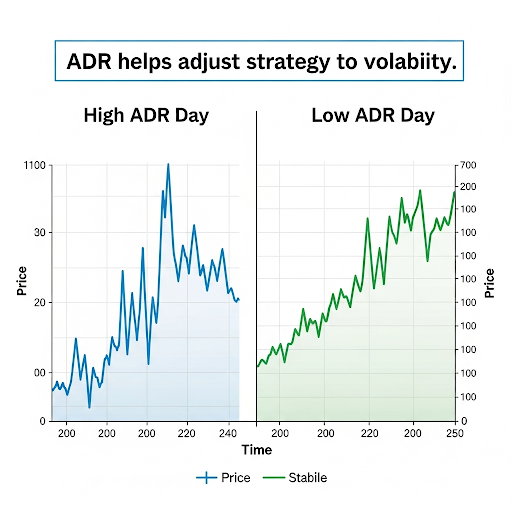
The ADR can also give traders a very good indication of the timing of trades. Periods of high ADR seem to be more aligned with aggressive day trading strategies. Conversely, low ADR periods require a sustained patience, and the ability to think longer-term about the market and market continuity to avoid missing a profitable trade or trends. Traders should alter their strategy based on where the ADR currently is.
The market affects ADR in big ways. During major news events, ADR can expand instantly. During quiet times, ADR may contract. Smart traders observe when ADR expands and contracts and make the necessary changes to their strategies.
Risk management can improve vastly by knowing and tracking ADR levels. For example; if daily ADR levels are high, the trader will avoid over-leveraging and leave smaller position sizes to allow for price movement. Conversely, if daily ADR is low, traders can increase their position sizes while leaving room for price movement. This will increase returns and profits over time using ADR.
Calculating the ADR is relatively easy if you have access to the historical price data. All you require is the daily high and low price data from your defined time frame. Most traders prefer either a 14-day period or 20-day period.
Here is a step-by-step breakdown:
10-simple steps to calculate the ADR.
- Gather daily high and low prices for the last 14 days (or defined period)
- Calculate the range for each day (high - low)
- Adding all the 14 daily ranges together
- Divide the range sum by 14
Let's use a real world example with EUR/USD:
Day 1: High 1.0850, Low 1.0780 = 70 pips
Day 2: High 1.0820, Low 1.0745 = 75 pips
Day 3: High 1.0795, Low 1.0720 = 75 pips
Day 4: High 1.0810, Low 1.0730 = 80 pips
Day 5: High 1.0795, Low 1.0715 = 80 pips
Day 6: High 1.0780, Low 1.0705 = 75 pips
Day 7: High 1.0825, Low 1.0750 = 75 pips
Day 8: High 1.0840, Low 1.0760 = 80 pips
Day 9: High 1.0815, Low 1.0740 = 75 pips
Day 10: High 1.0835, Low 1.0755 = 80 pips
Day 11: High 1.0820, Low 1.0745 = 75 pips
Day 12: High 1.0845, Low 1.0765 = 80 pips
Day 13: High 1.0830, Low 1.0750 = 80 pips
Day 14: High 1.0825, Low 1.0750 = 75 pips
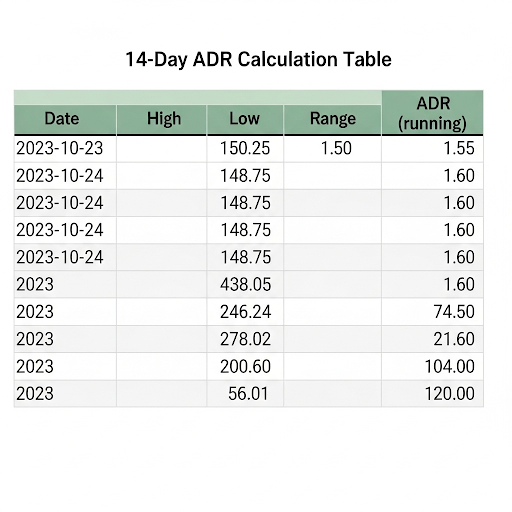
Total: 1,075 pips
14-day ADR: 1,075 ÷ 14 = 76.8 pips
This tells us that EUR/USD moves about 77 pips per day on average.
There are several useful tools that simplify ADR calculations. MetaTrader platforms have ADR indicators embedded within them. TradingView, for example, has built-in ADR displays, also Excel spreadsheet type approaches are ideal for this type of calculation.
When you are calculating the ADR think of it similarly to calculating an expense report at the end of every month. Everyday you write down how much you spent, you add it all up, and divide it by days spent. Speed of daily spending, like price movement, average daily spending, like ADR, is a simple calculation.
Professional traders often calculate the ADR over a few different time periods; more routinely tracking 5-day, 14-day, or 20-day ADR's, giving them a picture of volatility in short-term, and medium-term.
You should routinely update your ADR calculations. Daily updates have the best chance of small, current volatility. Weekly updates, especially for swing traders, work just as well. Monthly updates work for longer-term position traders.
How to use the ADR in trading strategies
The ADR begins as a simple statistics trading tool, and when use correctly, it can very useful to the, well, the smart trader.
Setting profit targets
If GBP/USD has a 85 pip ADR, you could target 70 - 80 pips as a legitimate target, whereas a target of 150 pips isn't likely to be valid as a legitimate target at the same time. When making targets or setting expectations, traders are not only significant of the ADR data that is provided, as well as the average price movement on GBP/USD on faster time frames.
Using Stop Losses
The ADR is meant to indicate the distance you should be setting the stop loss. All else being equal, a 25-pip stop loss should be fine for a 50-pip ADR pair. However, that same stop loss would get obliterated on a 120-pip ADR pair. We want to have the stop loss correspond to the pairs normal volatility.
Breakout Trading
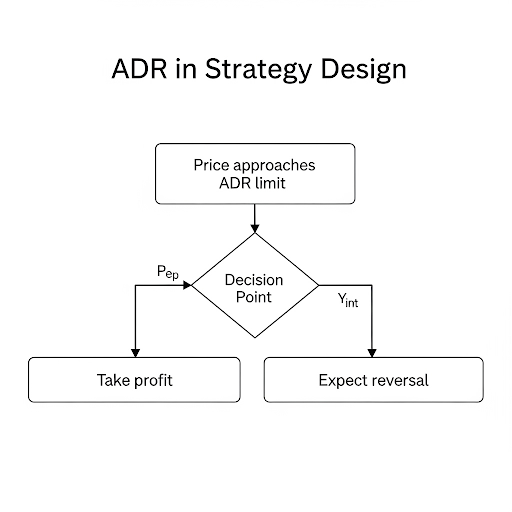
Where things get interesting is when price gets close to the ADR limits. At that point, prices might reverse sharply or break-out and continue trending. Traders will be looking for trade signals around the ADR boundaries.
Position Sizing
The higher the ADR of the pair, the smaller the position size; the lower the ADR of the pair, the larger the position size. This will provide a dollar risk that is similar from trade to trade, resulting in less fluctuation in your account balance.
Intraday Timing
There tends to be money to be made trading high ADR pairs in the early morning once the market opens. Late in the day however, you may find that you are trying to catch an exhausting move. The ADR will assist traders with knowing when they will be most profitable regarding entry/exit timing.
EUR/USD opens at 1.0800 with a 75-pip ADR. The pair rallies to 1.0865 (65 up). Youare getting close to the ADR limit. You are going to want to think about taking profits or preparing for a possible reversal.
Range Trading
The ADR can help traders define the range boundaries during periods of low volatility. A lot of times, traders will see price bounce off the ADR limits and stay in the range. Specifically, traders do this by buying near the bottom and selling near the top of the range.
Trend Following
Strong trends can overwhelm the ADR limit. When prices force themselves beyond established price ranges early in the day, it signals continuation. Traders want to get on the ride and will use prudent risk management.
Professional traders use ADR and combine it with other indicators. Along with using a moving average for trend direction, they use RSI for overbought/oversold readings in market conditions. ADR provides the highest volatility information for each of these signals.
Risk management using ADR to help gauge the volatility of a particular stock can improve dramatically. Traders can avoid fighting stronger trends that typically exceed ADR at the beginning of the day.
Traders are able to exit and take profit positions when they reach a normal daily range. If traders are using ADR as their means of managing risk, they can determine position size based on volatility.
ADR vs Other Volatility Indicators
ADR is not a singular volatility measure. There are other indicators that serve a similar purpose and knowing the difference allows traders to pick the right indicator.
ADR vs ATR (Average True Range)
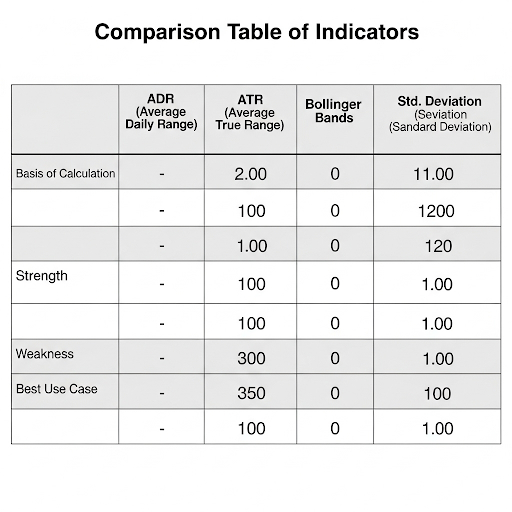
ATR includes the gaps in its calculation in comparison to ADR measuring high-to-low ranges within single days. ATR depicts volatility more completely. ADR focuses only on intraday directional movement.
You can use ADR as a day trading strategy. You can utilize ATR for swing trading and longer term positions. Many traders may use both ADR and ATR together to form a broader picture of volatility.
ADR versus Bollinger Bands
Bollinger Bands show dynamic volatility around a moving average. ADR shows static average ranges. Bollinger Bands react to current market conditions more rapidly. ADR provides consistent historical context.
Bollinger Bands indicate periods of expansion and contraction. ADR helps players set consistent profit and stop levels, regardless of the type of market they are in.
ADR versus Standard Deviation
Standard deviation measures how far prices are dispersed from the average. ADR shows simple daily ranges. Standard deviation is a mathematically complicated concept. ADR is much simpler to understand and apply.
Professional traders often lean toward using standard deviation so they can analyze in more detail. Mildly experienced traders seem to get more use from ADR as it can be applied to everyday decisions.
ADR versus VIX-Style Indicators
The VIX measures how much implied volatility traders think the market is going to have derived from options prices. ADR measures realized volatility derived from the actual price movement of currencies. VIX measures what volatility is expected in the future. ADR describes the volatility that has already occurred.
Currency pairs do not have implied volatility measures available in the same way that stocks do. ADR solves that problem by providing a measurement of volatility that is, relatively speaking, available to forex traders.
Combining Indicators
Smart traders do not rely on one indicator. Smart traders combine ADR with indicators that compliment it. ADR gives the context of volatility. The other indicators give the entry and exit signals.
A common combination might be:
- ADR as a measure of volatility
- Moving averages to indicate trend direction
- RSI to indicate momentum
- Support/resistance levels to indicate entry/exit
Having a multi-indicator method reduces false signals and produces better trading outcomes. ADR is the basis for position sizing and risk management.
ADR Differences between Currency Pairs
Currency pairs have very different ADR aspects. When trading it is essential to be aware of the differences.
ADR Ranges in Major Pairs
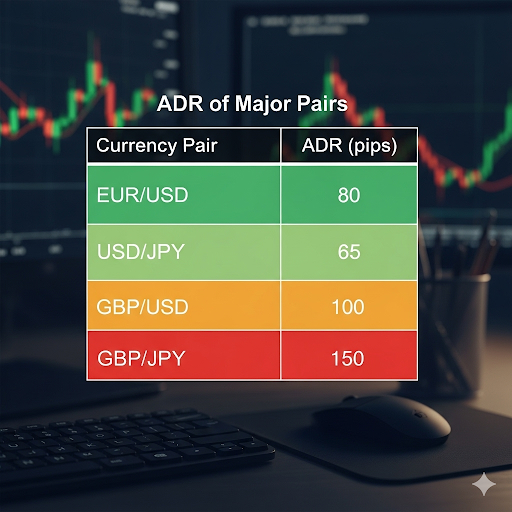
The EUR/USD ranges from 60 to 90 pips in a day. The USD/JPY typically trades 50 to 80 pips per day. The GBP/USD typically trades 80 to 120 pips in a day. Awareness of the aspects in ADR can significantly impact your trading methods.
Pairs with High Volatility
The GBP/JPY, EUR/JPY, and GBP/CHF typically offer higher ADR values. These pairs can add potential profits that can be made, but will have much larger stops when trading. You will need to make sure your position size is smaller to be able to risk properly.
Pairs with Low Volatility
The USD/CHF, EUR/CHF, and USD/CAD usually have low ADR values. These price movements represent largely continuous price action for a forex pair with a smaller movement range compared to other pairs. These pairs allow the trader to use larger position sizes when using tighter stops and smaller daily price ranges.
Safe Haven Pairs
The JPY and CHF pairs do not like to be watched under stress. The ADR value over the recent periods can double during the risk off time of the market. The ADR of calm days prior to prior trading action become different in terms of normal risk.
Commodity Dirty Pairs
The AUD, NZD, and CAD pairs are a unique pair of trades that typically offer movements around underlying commodities hours. The price volatility of the underlying commodities are driving the ADR of these pairs and will tend to tend to move the CAD pairs higher when the price of oil is traded higher.
Adjustments to Trading Strategies
Pairs with high ADR are generally more suitable for breakout trading strategies. Traders create plans to assume breakout trades once the market moves strongly outside of normal ranges, taking advantage of momentum, while still implementing risk management.
Pairs with low ADR are generally better suited for trading within a range. Traders buy support and sell resistance while remaining within what could be considered normal daily ranges, obtaining smaller profits more often.
Different currency pairs can be viewed in the same sense as different sports. Basketball games tend to have a higher scored games. Soccer games tend to have lower scored games. You develop your expectations as well as your strategies based on the particular sport. Currency pairs are similar.
Cross-Pair Relationships
Certain pairs move in conjunction to each other. Oftentimes, as the EURUSD moves, the GBPUSD will move alongside it. Conversely, as the EUR/USD is moving, the USD/CHF will be moving counter to that data. Grasping different pairs and their relationships to one another can help when managing a portfolio for risk.
Maybe a trader does not wish to trade correlated pairs at the same time and just because these pairs move similarly/interconnectedly, they do not want to be over-exposed, (in the same currency for trade entries). The ADR can help determine when a previously normal correlation may be off the rails or poorly correlated.
Limitations and considerations of ADR
ADR offers traders many things but it has important limitations. Certainly, good traders understand the restrictions with ADR and plan accordingly.
Historical Nature
One of the obvious limitations of ADR is the fact that it relies on past ranges to make predictions about the future. As previously mentioned, markets move in flux. Just because yesterday's average was this does not guarantee the range for today. Further, when major news occurs, the blind spot is quickly destroyed.
Market Condition Changes
Expect lower ADR values during low volatility episodes and higher ADR values during high volatility episodes. When the market shifts from one set of conditions to another, decisions made off of stale ADR data are highly detrimental.
News Event Impact
Central bank meetings, economic releases, and political events can push prices many pips beyond ADR boundaries. The volatility calculations for the ADR are moot during these news events.
Seasonal Trends
Summer months typically present lower forex volatility. Likewise, December trading can be oddly quiet. Holiday sessions vary and so should the ADR calculation. All of these aspects to forex trading matter and traders must reflect them in their decision-making.
Time Zone changes
The forex market is 24 hours, yes, but volatility in forex varies by session. An easy example is most London trading day sessions exhibit higher volatility than an Asian session. When measuring ADR, it is important to factor in the context of when volatility occurred.
False Breakouts
Some prices flow through the ADR limit only to reverse back the other way quickly. False breakouts trigger stop losses unreasonably, and therefore traders need other confirmation before acting on an ADR signal.
Currency Specific Factors
Central bank policies shape individual currencies differently. A scheduled economic release could impact some pairs and have little or no impact on other pairs. The ADR alone does not measure fundamental factors.
Practical Ways
- Try using multiple ADR periods simultaneously. For example, use a 5-day, 14-day, and a 20-day concurrent to compare. The trader in this case receives better context of current volatility.
- Combine ADR with other analysis methods. Technical indicators, fundamental analysis and market sentiment provide additional context.
- Update ADR calculations often. Daily updates will keep volatility measurements current. Weekly updates will aid in noticing changing market conditions.
- Keep an eye on economic calendars for high-impact events.
- If there are major news releases on the horizon, adjust business and continually consider whether you remain in the applicable markets with all of the uncertainty.
- Use ADR as a guideline for position sizing and trade planning, not as a rigid rule.
- Daily market conditions are constantly changing, and the importance of flexibility and having the ability to adapt and change is more important than aligning with a single sample of historical average volatility.
Conclusion
The Calculated ADR provides much transformation to forex trading, moving from instinctive guesswork to informed decision-making. This metric provides important context of volatility for every trading decision.
By understanding how to calculate ADR traders will be empowered to make further alterations to their own analysis. A trader may be able to reflect contrasting characteristics of the market by analysing ADR over different time periods. Updating ADR will also lead to better context for recurring volatility measurement relevance.
The transformation in regards to sector approaches and applications of ADR can provide traders with updates throughout their trading processes. Position sizing becomes more scientific, stop losses are aligned with market volatility, profit targets are realistic and risk management is improved immensely.
Successful traders continue to incorporate ADR into their tools as well as other methods of analysis. No one indicator or method of analysis can provide comprehensive insight into the market. ADR will provide a basis of volatility metrics to support incorporate into more comprehensive trading strategies.
Begin to incorporate ATR (Average True Range) in your trading right now! Calculate the ATR values for your most liked currency pairs. Observe what happens to prices near the ATR limits and adjust your stops and profit limits as needed.
The more you use it, the more second nature the ATR becomes. Start small with practice; either paper trade or with small positions. Get comfortable and gain confidence through applied experience before bumping up your positions sizes, ATR usage is an invaluable trading skill.
Most professional trading platforms include built-in ATR indicators. Use them to help analyze trades. Automated ATR calculations save a lot of time, and time to analyze trades is money, and prevents costly calculation errors.
You will not become proficient at using ATR overnight. It will take consistent application over time to develop. Traders who are patient when learning ATR and who learn the different characteristics of price volatility will be able to achieve superior long-term results when trading.
Your trading advantage is based on an understanding of market behavior. ATR is that understanding in a clear usable form. Use that understanding to create more consistent and profitable trading strategies.
Are you ready to take your forex trading to the next level? Start tracking ATR today. You future forex trading profit will welcome you. Start with a demo account with tradewill.com
Disclaimer: The content of the blog does not represent any position of Trade W, does not serve as any trading-related decision advice, and does not endorse any third-party.