

 Trade W
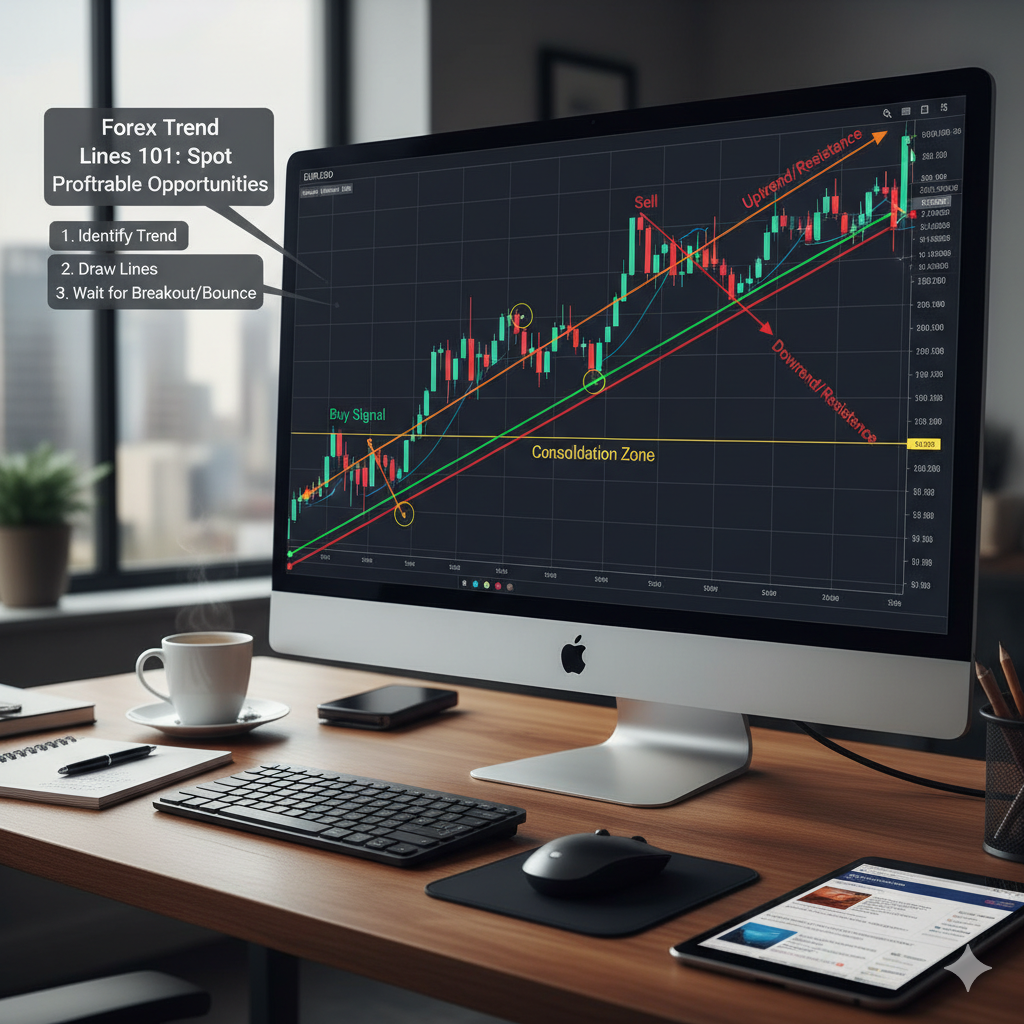
Why Trend Lines Are a Must-Know Tool in Forex Trading
As you view a forex chart, you see EUR/USD moving all around, just like a pinball machine. The prices go up, then down, then sideways. You want to trade, but when should you buy or sell?
That is where trend lines come in to help you.
Trend lines are one of the most frequently used tools in technical analysis, and for good reason. They help the trader to see the intended movement further out, which allows them to understand market structure and forecast potential entry and exit points. Trend lines are like a roadmap that illustrate where the market has been, and where it may potentially go next.
Let’s just say this at the outset: trend lines are not magic crystal balls that provide a peek into the future. Markets are inherently random, and due to that, even the best drawn trend lines will fail. However, if utilized correctly, they can help you clearly structure your thought process and allow you to trade with increased confidence, as opposed to guessing.
It should be noted traders can use trend lines to trade any of the major pairs, commodities like gold, or even cryptocurrencies. The significance is trend lines can be used for basically any market and timeframe, which makes them one of, if not the most versatile tool in your trading toolbox.
What Is a Trend Line? Definition and Types Explained
A trend line is a purely straight line that connects two or more price points to demonstrate the direction of market movement. You are quite literally drawing a line connecting dots, however, instead of forming whatever that picture may be, you are disclosing the momentum of the market.
There are three varieties of trend lines:
Uptrend Line: This is a line that connects a series of higher lows indicating that buyers are stepping up at progressively higher prices. This can be thought of as climbing stairs; each stair higher than the last. This acts as support that suggests that the market wants to go up.
Downtrend Line: This line connects a series of lower highs indicating that sellers are becoming more aggressive at lower price points. Picture sliding down the slide at the playground; your momentum is consistently downward. This line acts as resistance as it suggests the market wants to go down.
Sideways Trend Line: This is the line that connects highs and lows that stay around the same level and indicate that the market is undecided. It can be compared to walking on a flat road; you are moving but not necessarily higher or lower.
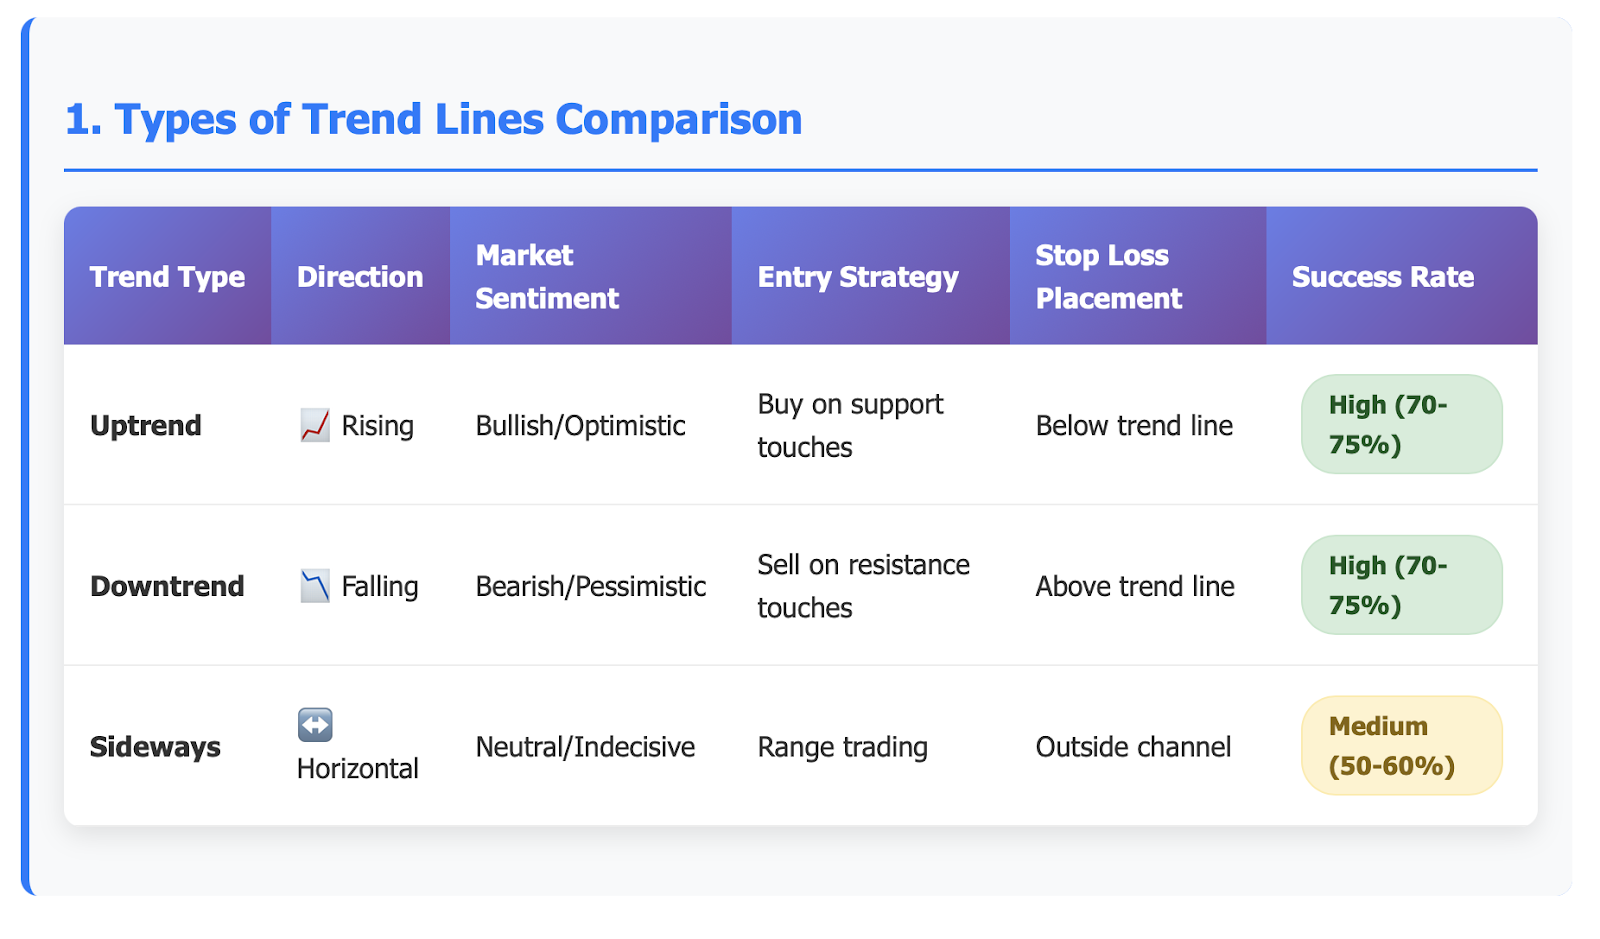
The fundamental point to understand is that trend lines depict market sentiment in a graphical representation. When a market is in an upward direction, it suggests optimism and buying activity. Conversely, in a downward direction, it reflects pessimism and selling activity. A sideways trend indicates indecision or that buyers and sellers are reaching a point of equivalence.
If you take a look at a weekly Gold (XAU/USD) chart, you may view all types of price movement over time. The market will not move in straight lines indefinitely! Trends will spike, consolidate, and turn, or trend-lines will help you identify the potential to change.
How to make Trend Lines the Correct Way (Step by Step Directions)
Drawing trend lines seems easy but there is a correct way and an improper way to do it. If not done properly, it will lead you to make trading decisions based on false conclusions.
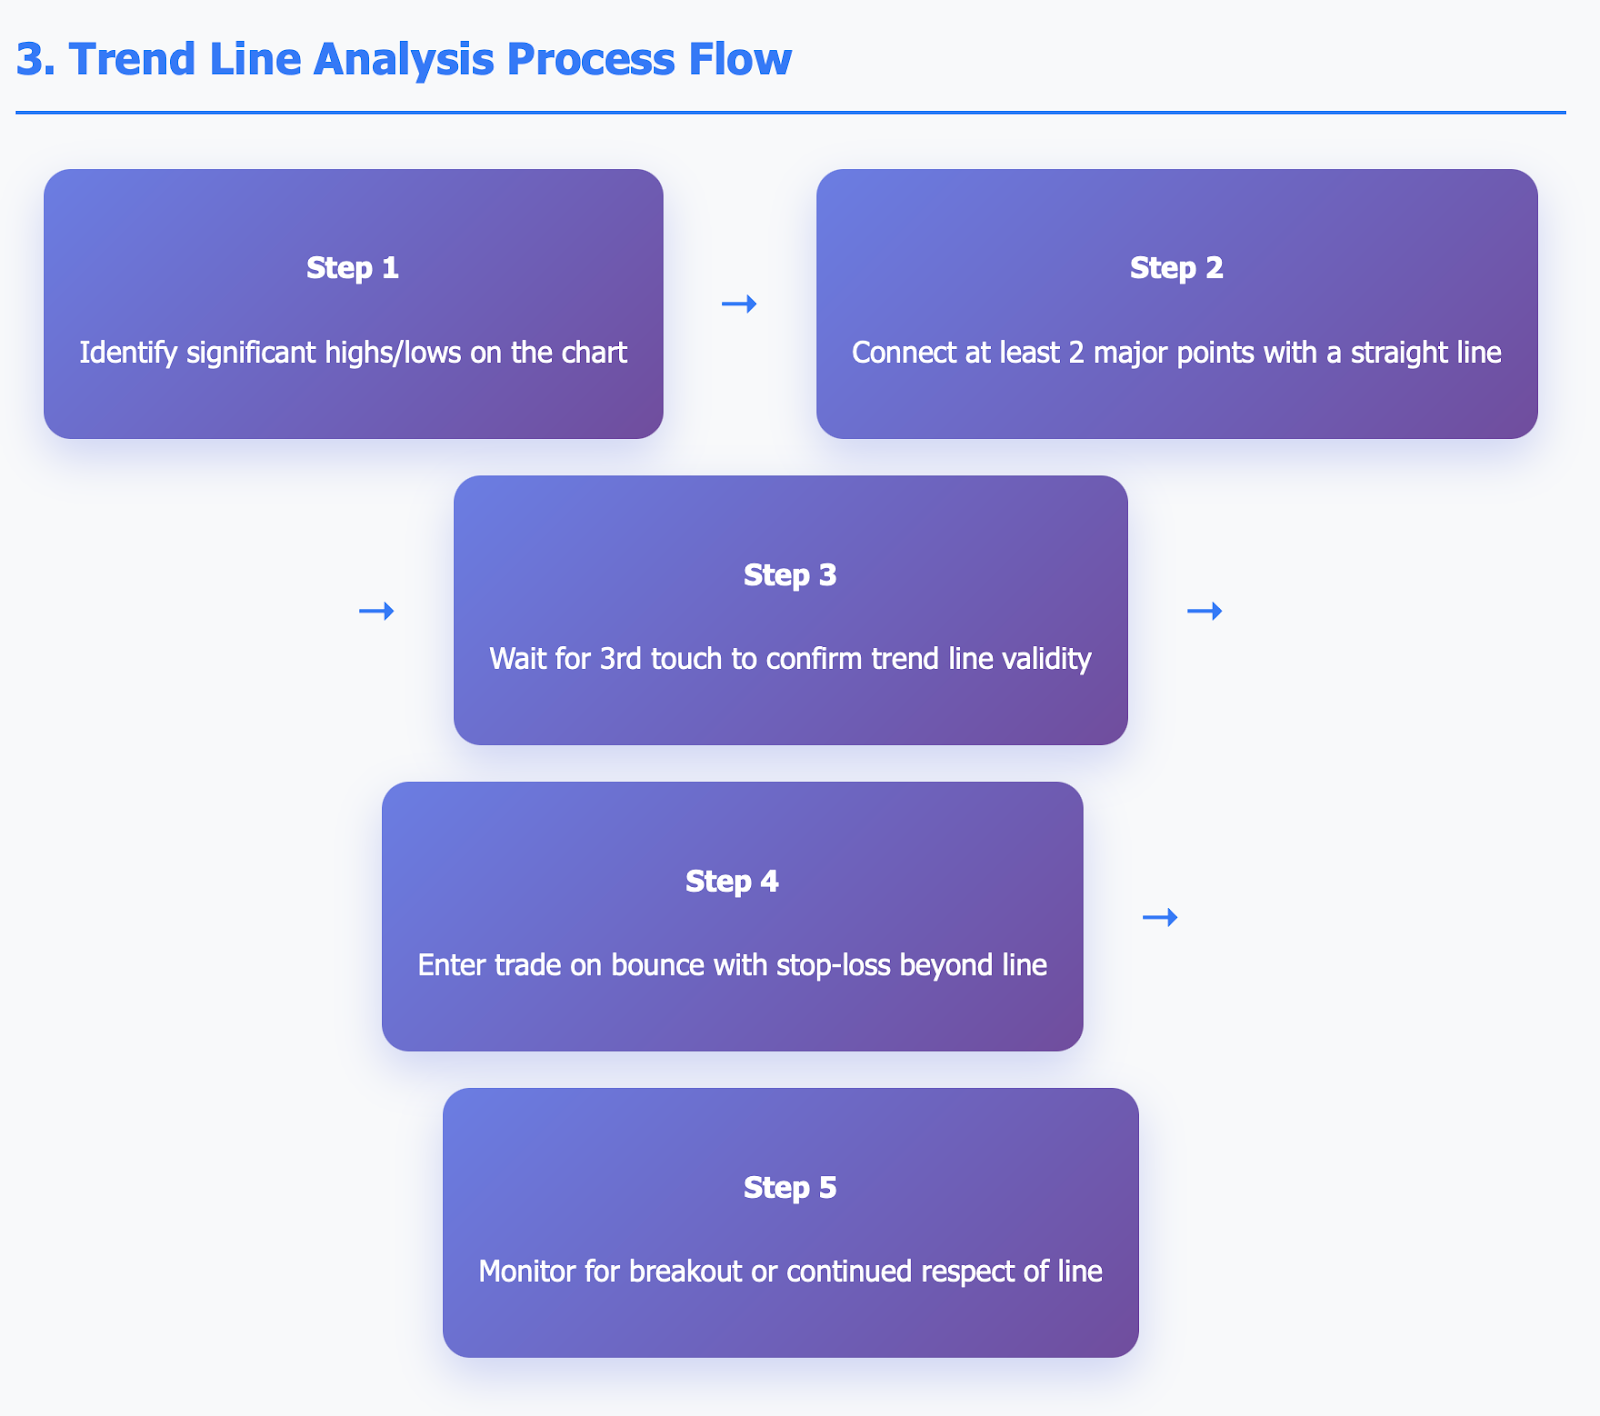
You need at least two valid points to establish a trend line, but three or more touches will see it become very reliable. You cannot have an adequate support structure (a trendline) without proper support points (or anchors). To go a step farther, if your trend line has isolated at least one other point again, when price is on it, it is sold significantly more reliable, structurally.
For an uptrend line: you will connect the lowest low, followed by the next most significant low/low incidence. If price once again touches this trend-line (for a third time) and bounces back up once again, you likely have a strong uptrend line.
For downward trend lines, connect the highest high with the next major high. A third touch with a subsequent down move will provide confirmation that your line is significant.
Common mistakes of beginners are to just pick two random points when drawing the line. Make sure you are connecting significant highs or lows and not simply some random high, which could just be a filling, or small movement. It is also always better to use a closing price if the trade is available rather than just focusing on the wicks, or the thin lines above and below the candle, representing where price fluctuates during the time period.
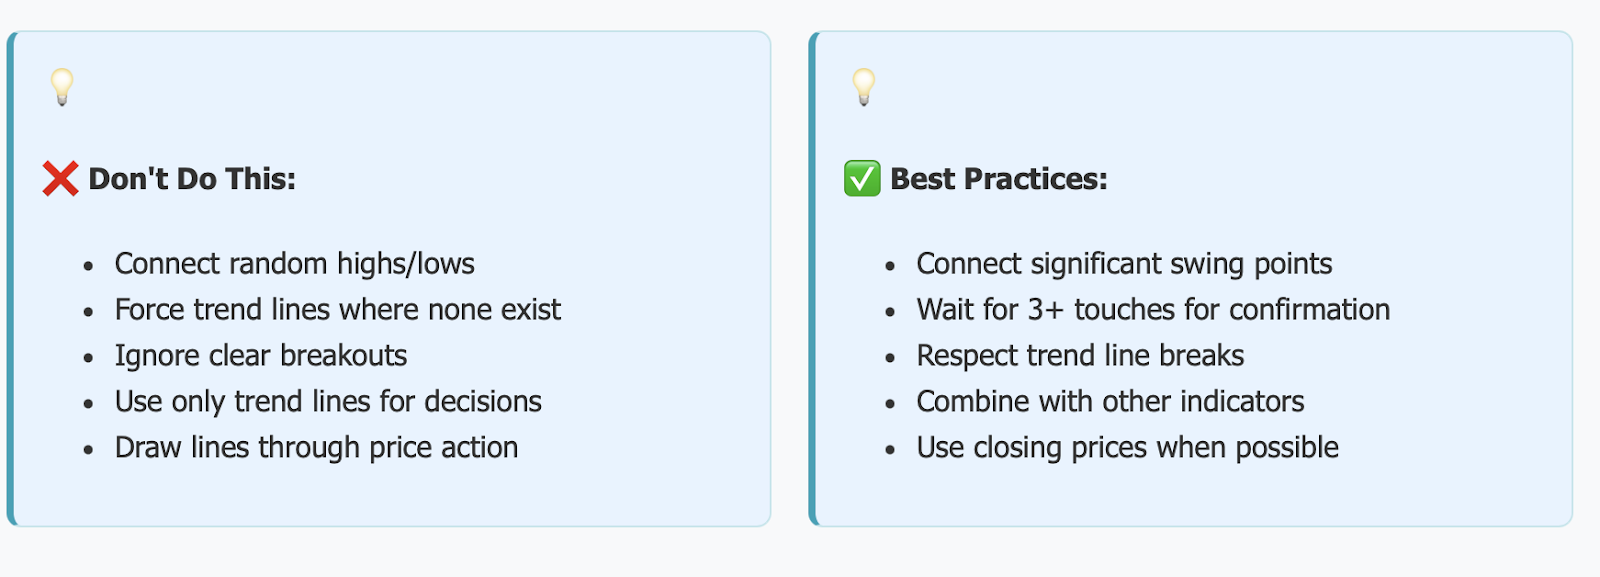
Pro tip: You should also consider drawing trend channels by drawing a parallel line to your trend line. This will create a channel that can provide other possible points of reversal.
An example reviewer may look at it during the Brexit volatility on the GBP/USD. Professional traders who drew trend lines connecting the major lows in the trend would be able to see the strong support area, meanwhile those who connected two random points should find out quickly that they were getting taken out all the time.
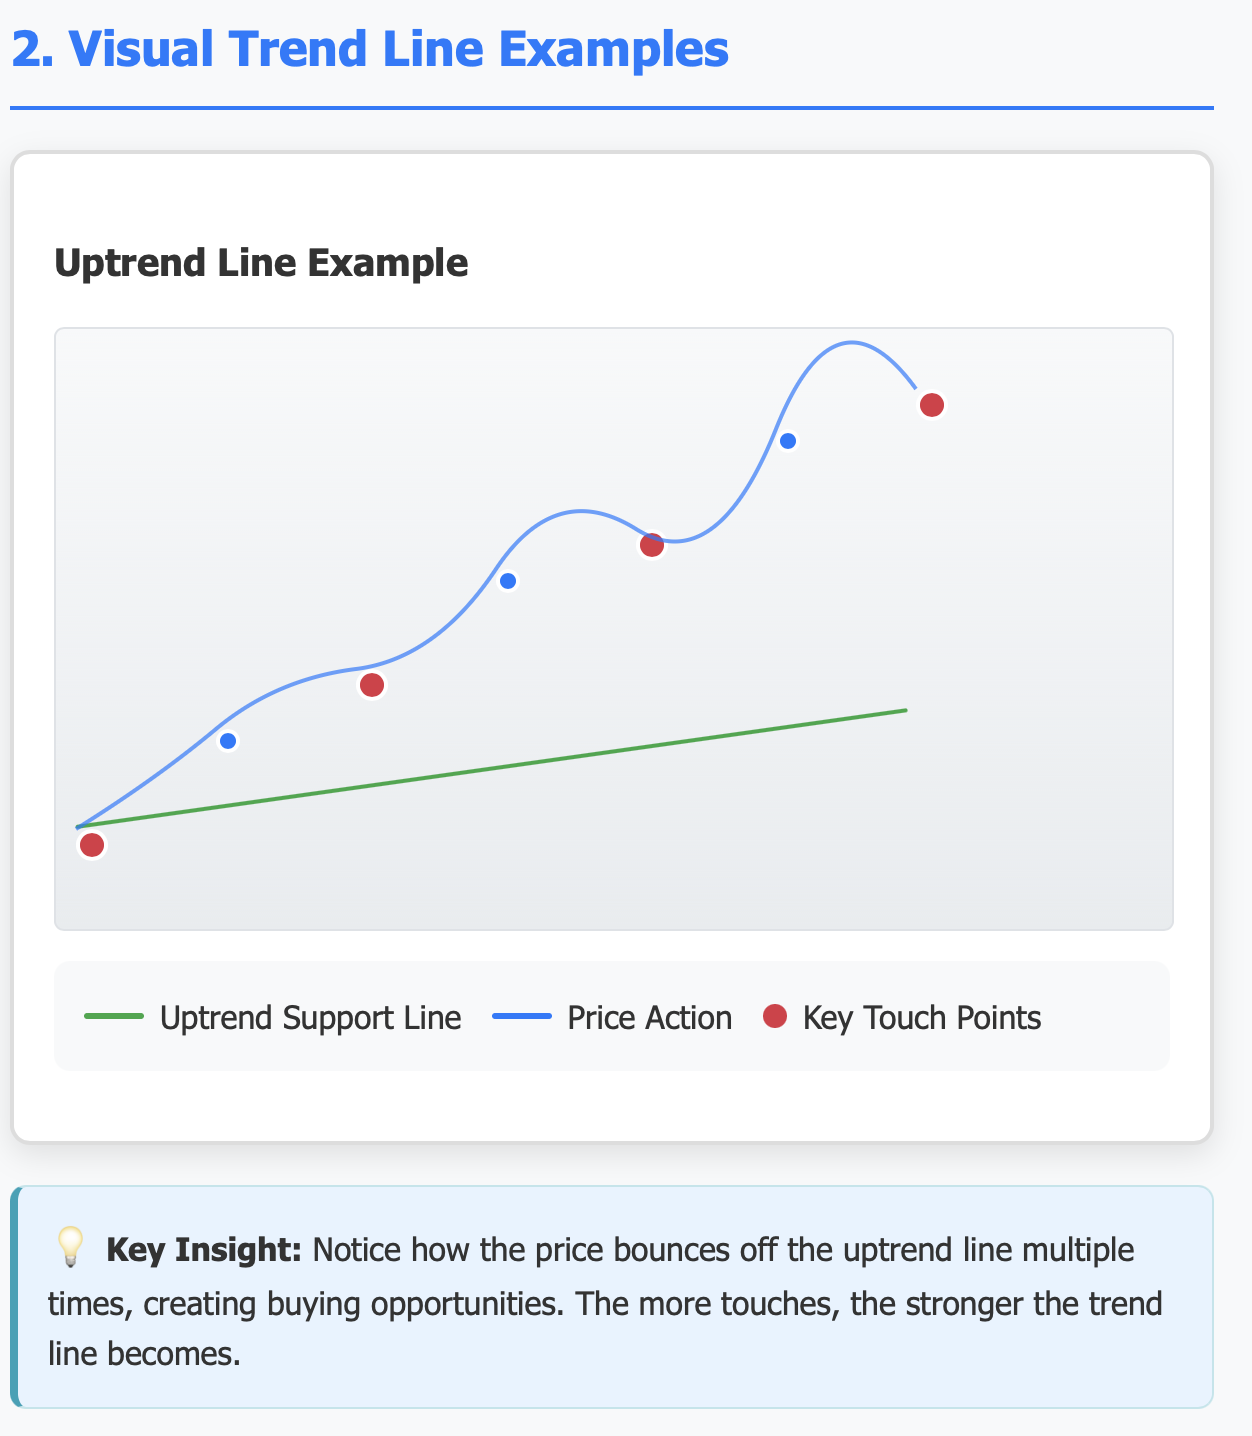
Remember: the more times a price connects to your trend line without breaking, the more significant that line or area becomes. Time also matters. A trend line that connects for several months on daily chart is much more significant than just a week or few days.
How to Use Trend Lines in Forex Trading (Practical Applications)
Once you understand how to draw trend lines, we can talk about trading using trend lines! A trend line can change from a nice line on a chart, to a representation of potential profits, or maybe even losses.
Trend Lines as Support and Resistance
An uptrend line will act as a safety net. If prices retrace back to touching this line, they will often bounce back higher. When traders see a price on an uptrend touching the line, they often see this as a buying opportunity and will put their stop-loss just below the trend line in the event it breaks the trend.
A downtrend line works in the same way but, instead of a safety net, it works like a ceiling. When prices move to the highest high, the prices will typically get pushed back down. When they touch the trend line, it's an opportunity to sell with a stop-loss just above the trend line.
Breakouts
Trend lines can break, and when they do, it often signifies a change of direction. If a downtrend line breaks to the downside with conviction and volume, the bulls may be losing control of the market. A downtrend could begin peeking around the corner.
For example, if the USD/JPY has been respecting an uptrend line for weeks, and then suddenly breaks below the uptrend line with a large red candle, it might be time to start looking for selling opportunities instead of buying opportunities.
Utilizing Technical Indicators
Smart traders do not simply rely on trend lines. They also complement trend lines with tools such as the RSI, MACD, or moving averages. If you have a trend line that states a price action, "buy," and your RSI is indicating the market is oversold, then this is a stronger indication than having each tool on its own.
Think of this in the context of crossing a busy street. You aren't simply looking one way or the other, you are looking both ways. In the same way, you want to be more certain about the trend line direction rather than expecting it to have a higher probability because it is a trend indicator, then use both the trend line and possible tools, so you have the signals lined up.
Stop-Loss Placement
Trend lines give you a natural area to place a stop loss. If you are buying on an uptrend line, you want to place the stop just below the trend line. If the price action breaks the trend line, then your stop loss indicates that your original analysis was wrong, and it is time to exit the trade.
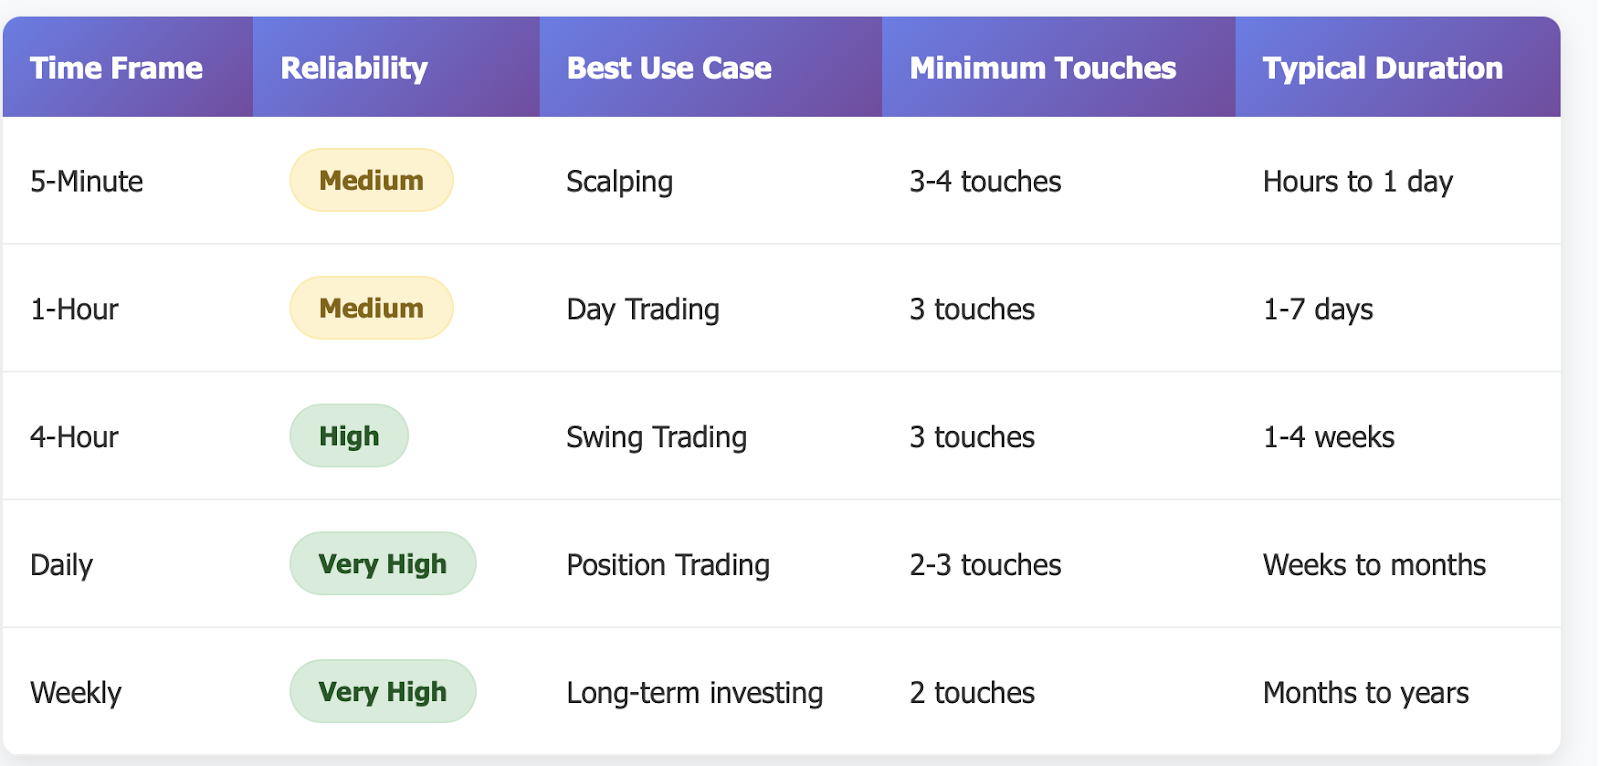
What is nice about trading trend lines is the universal application. They work whether you are day trading trends using 5-minute bar charts or setting trends using a daily bar chart as a swing trader. The principle does not change: identify the trend, trade with the trend, and manage your risk.
Limitations and Mistakes in Trend Line Trading
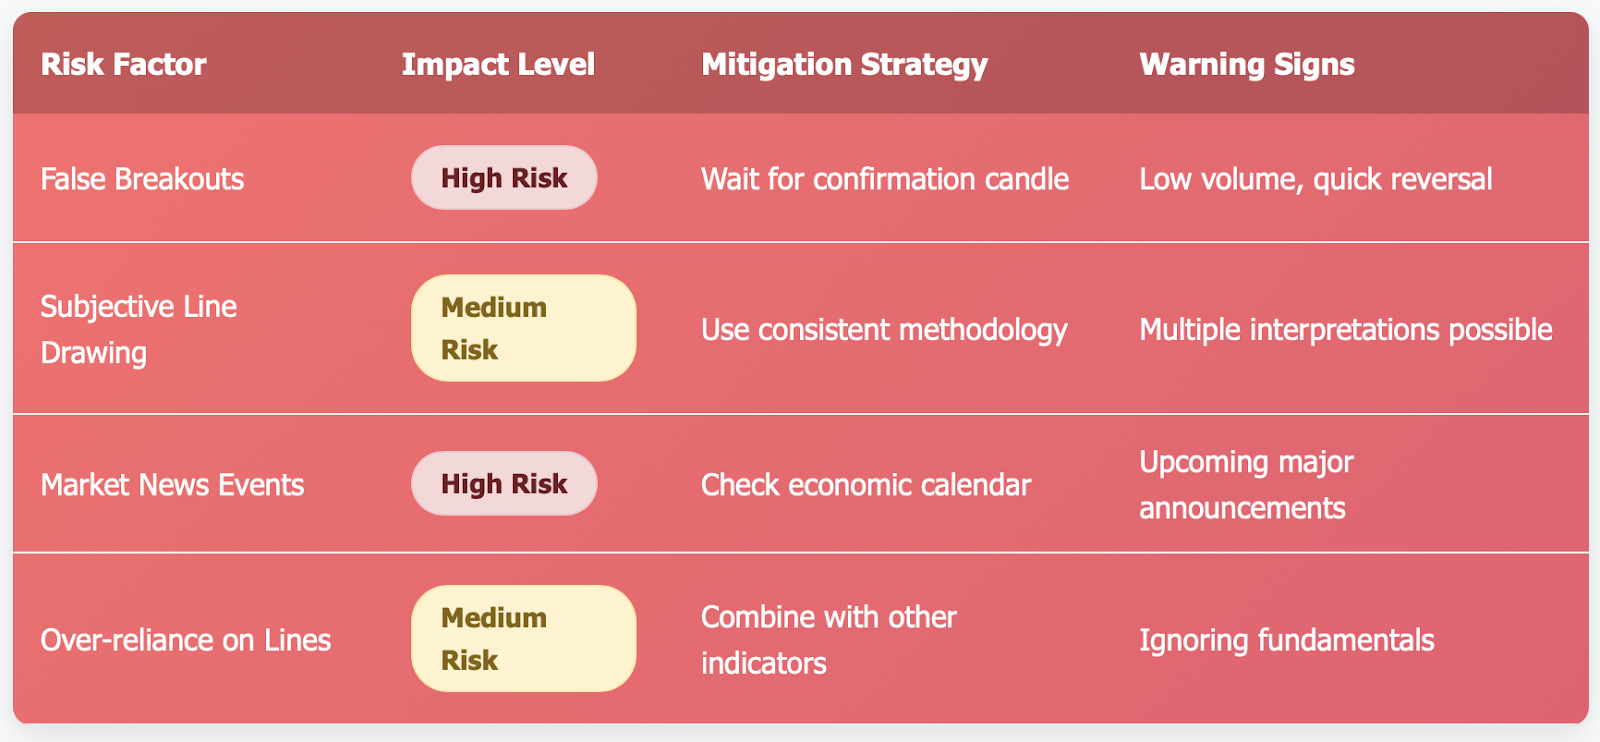
Let's face it - trend lines aren't perfect. Knowing the limitations of trend lines will help you avoid expensive mistakes and be a better trend line user.
The Subjectivity Problem
If you asked five different traders to draw trend lines on the same chart, you would likely get five different trend lines. One trader draws the line based on connecting the absolute lows of the price action, and another trader draws the trend line with closing price action in mind. This subjectivity means that your trend line is not necessarily the "right" trend line, and that's okay. Just be consistent with how you draw your trend lines.
The Brutality of False Breakouts
Imagine this: EUR/USD breaks below a major uptrend line, so you sell the EUR/USD expecting price to continue down. Instead, as soon as price breaks below the trend line, price rockets back through the trend line to the upside, and you get stopped out for a loss. This is a false breakout, and these happen more often than you would like to admit.
At times, our market will fake momentum to test trend lines before it resumes price action in the original direction. This is similar to a player faking left to go right - that first fake is normally enough to cause the defenders (or the traders) to make the wrong decision.
The COVID-19 reality check
The pandemic that struck in 2020 demonstrated how fast the market can change. Many trend lines that held durability for months or even years broke down because fear and uncertainty took control over the market. Traders that used trend lines and didn't take into account the fundamentals of the situation, like forced economic shutdowns and central bank management of interest rates, found themselves on the wrong side of some substantial moves.
The over-rely trap
Some traders become so locked into the trend lines they disregard all other considerations, be it economic news, market sentiment indicators, other trend lines or technical indicators. This is like trying to drive a car for several miles and only watching the rear view mirror. You need to know the entire situation to make quality trading decisions.
The Time Horizon Conundrum
A trend line may be perfect on a daily timeframe chart but have zero relevance on a 4-hourchart. Each timeframe can tell its own story and you need to be aware of which one you will be trading and stick with that.
Trend lines are meant to assist you in making better determinations, not as guarantees of future price moves. Use them as part of an entire trading plan including risk management, an analysis of fundamentals that can impact the price of currency pair, or any other technical tools.
Case Studies: Examining Trendline Analysis in Forex and CFD Secondary Markets
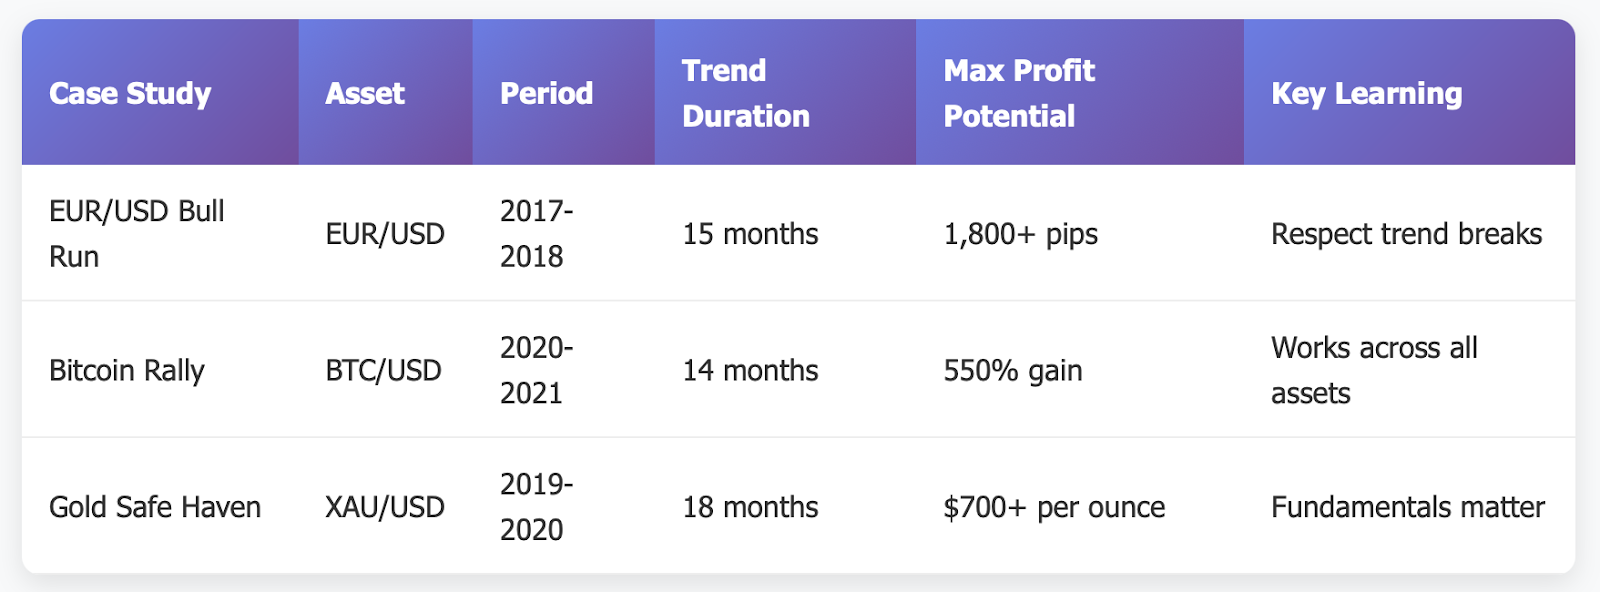
Let's take a moment to review some real-life examples of how trend lines actually played out in the major Forex secondary markets. These case studies illustrate the power of trend line analysis and sometimes its limitations.
Case Study 1: EUR/USD Bull Run (2017-2018)
During 2017 and early 2018, the EUR/USD currency pair formed one of the cleanest up trend lines of recent history. The start of this bull run was formed initially from a low in January 2017 at approximately 1.0340 and the currency pair found support along the trending line as it connected most of the higher lows into an overall trend.
Traders who recognized this trend line early could have viewed each touch as a chance to buy. The line provided support in March 2017, July 2017, and November 2017, with each bounce creating an opportunity to enter a long position with a clearly defined risk management strategy - stops were placed below the trend line.
The trend line finally "broke" in April 2018 in approximately the 1.2250 area, which signified the end of the bullish run. Traders that respected that break and changed their outlook to bearish avoided large losses, as EUR/USD subsequently traded down to 1.1300 in the coming weeks/months.
The point here is that solid trend lines offer multiple opportunities to enter trades, but you must respect when they break.
Case Study 2: Bitcoin's Historical Bull Market (2020- 2021)
The bullish run for Bitcoin has been remarkable, with the price moving from $10,000 to $65,000 during such a relatively short time period. An outstanding example of a trend line holding support during a bull market was seen throughout 2020 and some of 2021, where BTC/USD created a major uptrend line connecting the low from March 2020 and each subsequent higher low created.
Each time Bitcoin experienced some type of retracement back to this trend line, which happened in July 2020, September 2020, January 2021, Bitcoin bounced sharply higher. Traders that bought these retracements using the trend line as their stop-loss level enjoyed massive returns.
The trend line remained intact until May 2021, at which point Bitcoin broke beneath the trend line due to the general crypto collapse. The break was a warning sign of additional weakness to come, with a final drop to approximately $30,000 on Bitcoin.
Key Takeaway: Trend lines help show how prices behave across all assets, including cryptocurrencies, but they are not fool-proof to fundamental shifts in direction to price events.
Case Study 3: Gold's Safe Haven Rally (2019 - 2020)
Gold (XAU/USD) made a picture-perfect trend line from its August 2018 low through early 2020. The trend line illustrated gold's safe haven characteristics during times of unknowns around trade negotiations to binaries during the COVID-19 period.
The trend line held support multiple times, resulting in a price bounce during periods of stress on the markets as investors felt the need to hedge their equity positions with gold. Professionals use this trend line (price-based strategy) to instigate positions in gold in addition to the fundamental reasons providing justification for these trades based on global risk events.
When gold finally broke above long-term resistance in 202 include 0,000 as it already had the upside momentum direction through the trend line. Eventually, gold peaked above $2,000 per ounce.
Primary message: Trend lines work best in conjunction with the basic thematic realities of the market.
The examples above demonstrate that trend lines are not merely abstract ideas but real-world tools that real traders use to make real money. The examples also underscore the importance of respecting trend line breaks and not fighting the market when conditions change.
Conclusion
Trend lines are the compass for traders; they help us navigate by providing direction and possible turning points; however, like any compass, trend lines work best when used in conjunction with additional navigation tools and sound judgment.
Remember trend lines: they help identify market direction; they provide natural support and resistance levels; and they provide logical levels for entries and exits. This is true in all time frames and in all markets, including major forex pairs, softs and commodities, and cryptocurrencies.
The key to success with trend lines is patience and discipline; do not try forcing trend lines where they are not supposed to fit, or ignoring definite breaks just because you were hoping for the trend to continue. Remember the market does not care about your wishes, only supply versus demand.
Always pair trend lines with sound risk management. Use stop-losses, keep position sizes in line with your account size, and never lose what you cannot afford to lose. Even the best trend lines can fail, especially during major news events and changing market conditions.
Practice makes perfect. Start with the clear trend lines to be assessed directly on daily charts and then drill down to shorter timeframes as you feel more knowledgeable. It is best to look for trend lines that have three touches or so, and especially observe how price behaves when moving towards it.
Most importantly, learn! Markets change, and successful traders with them. Trend lines are easy but only one tool in your toolbox; reach mastery, but do not lean solely on trend lines.
Are you ready to put your trend line knowledge to the test?
Then open a free demo account at Tradewill.com and practice without risk! Master trend line analysis in a safe environment before trading live. Your future profitable self will commend you for taking necessary learning time.
Disclaimer: The content of the blog does not represent any position of Trade W, does not serve as any trading-related decision advice, and does not endorse any third-party.