

 Trade W

Trading forex without grasping trendlines is similar to driving without a GPS system. You may make it there eventually, but it’s likely you will get lost and take wrong turns and run out of time. Trendlines are one of the most basic concepts in a trader's toolkit, however many beginners either don't acknowledge their potential or draw them wrong.
In this article, we will cover everything you need to know about forex trendlines, from the basics to advanced techniques that professional traders utilize every day of the week.
What is a Trendline?
Before we can understand trendlines in forex, we must first grasp and understand the definition.
Simply put, a trendline is a straight line that connects consecutive highs or lows on a price chart. A good way to understand what a trendline is, is to picture drawing a line under a staircase the determine what direction the staircase is heading. These lines are used by traders to examine the overall price direction and assist them in determining the best time to enter or exit a trade.
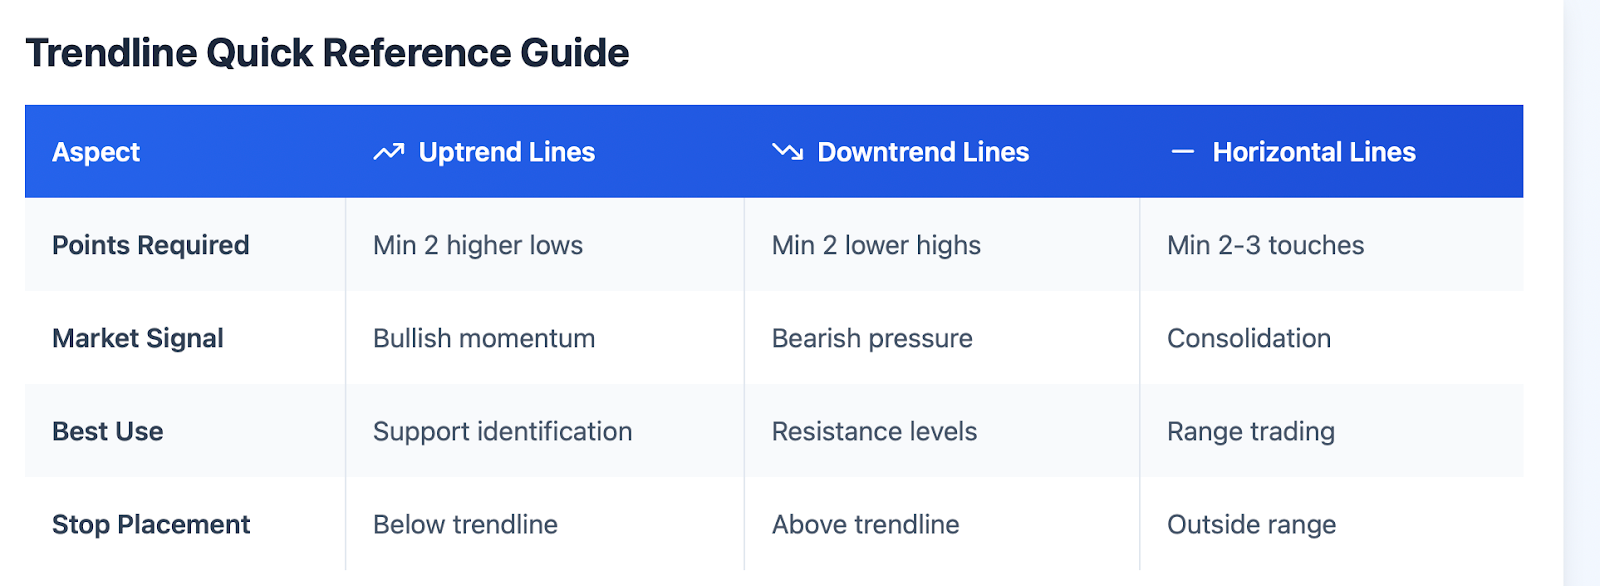
Trendlines can be grouped into three categories:
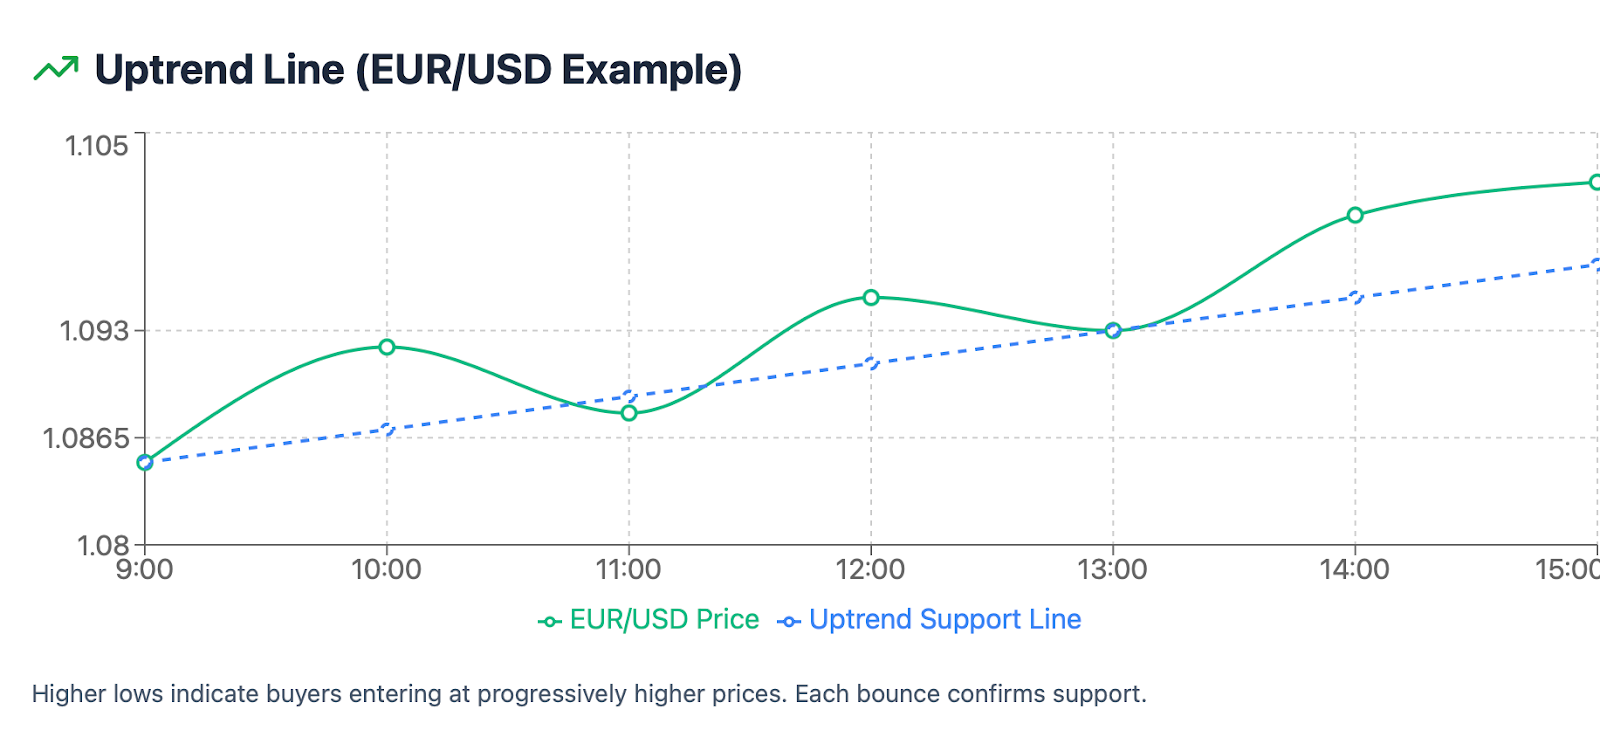
An uptrend line connects a series of higher lows; this connects deeper lows with highs and indicates buyers are entering the market at a higher price than the previous price. When the EUR/USD was pressing higher for most of the first six months of 2019, traders could draw an uptrend trendline based on the higher lows indicating bullish momentum.
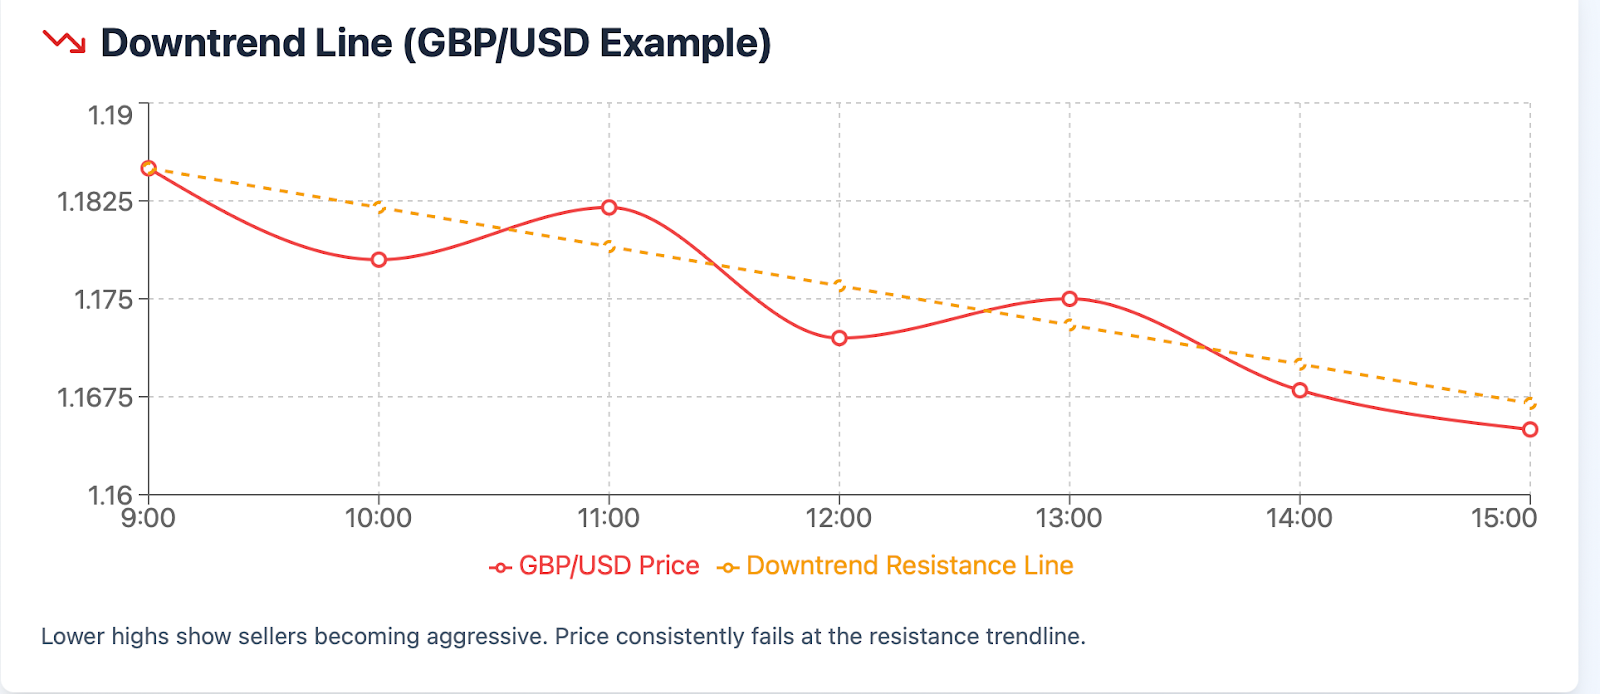
Downtrend lines are a line that connects a series of lower highs indicating sellers are getting much more aggressive on the downside. For an analogy, think of a basketball team who has scored 80 points or higher in their last ten games, and now, their scoring streak is coming to an end with slightly lower final scores each game.
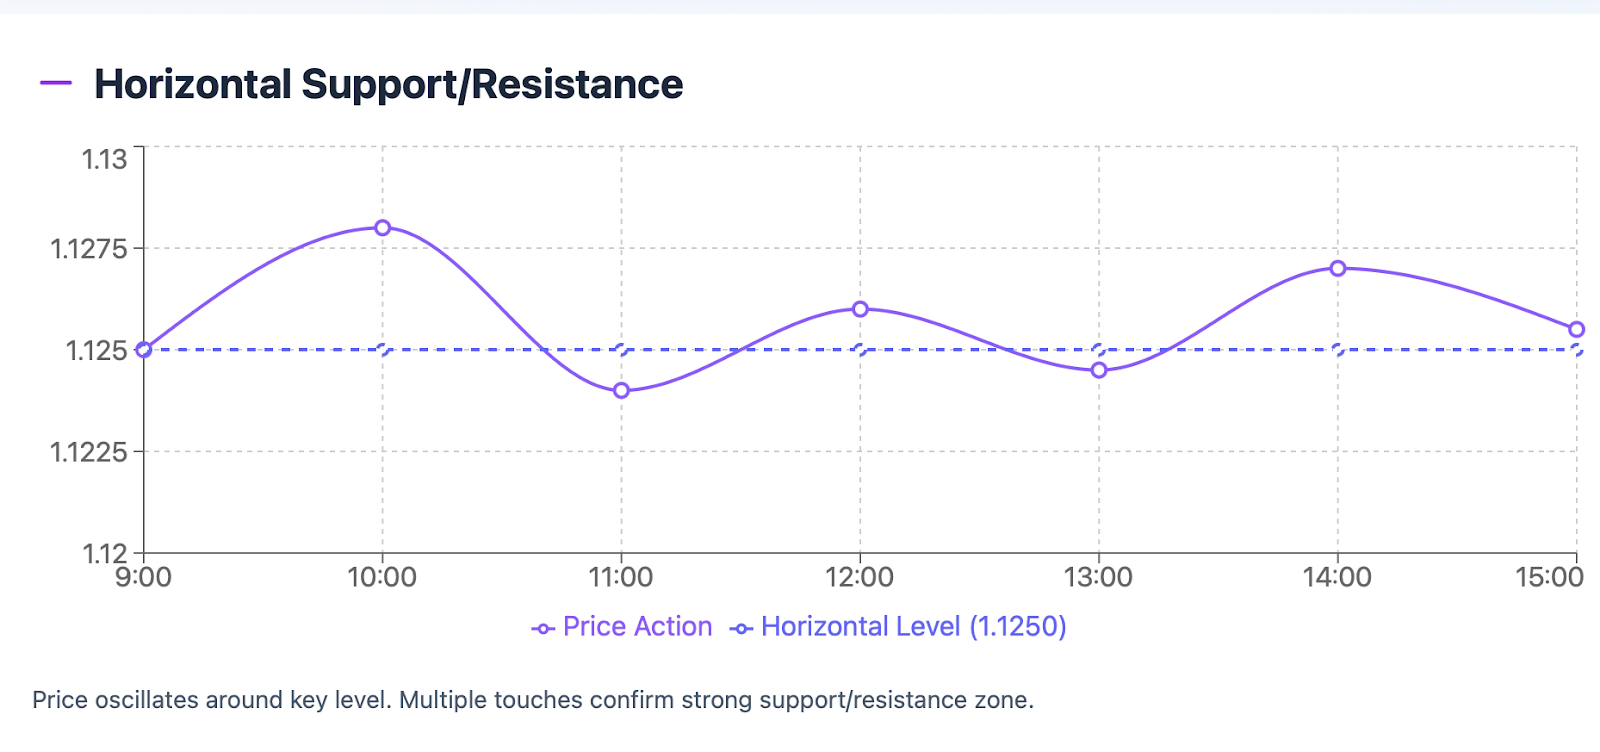
Horizontal lines are simple lines that mark important support or resistance levels where price typically bounces or stalls for various reasons.
Trendlines are different than other technical tools (moving averages, channels, etc) because they are simply static lines based on actual price points that are not calculated averages.
They serve as a clear point of reference in visual form for the price direction of the trend and offer traders the needed information to make their trading decision with entry and stop-loss levels.
Draw a Trendline: A Simple How-To
It's not rocket science to draw a good trendline, but it is a matter of following some simple principles.
Uptrend lines: Simply find at least two important low points and connect them with a straight line. You will then extend that line short-term or into the future, to see where price could find support. As mentioned before, the important part is identifying lows that are important and not just referencing too many small moves lower in the market.
Downtrend lines: Simply connect at least two important high points from the market where you want to see a downtrend line in the future, and extend the line forward. This is where the price would likely face some resistance in the future as the market continues to move in the upward direction.
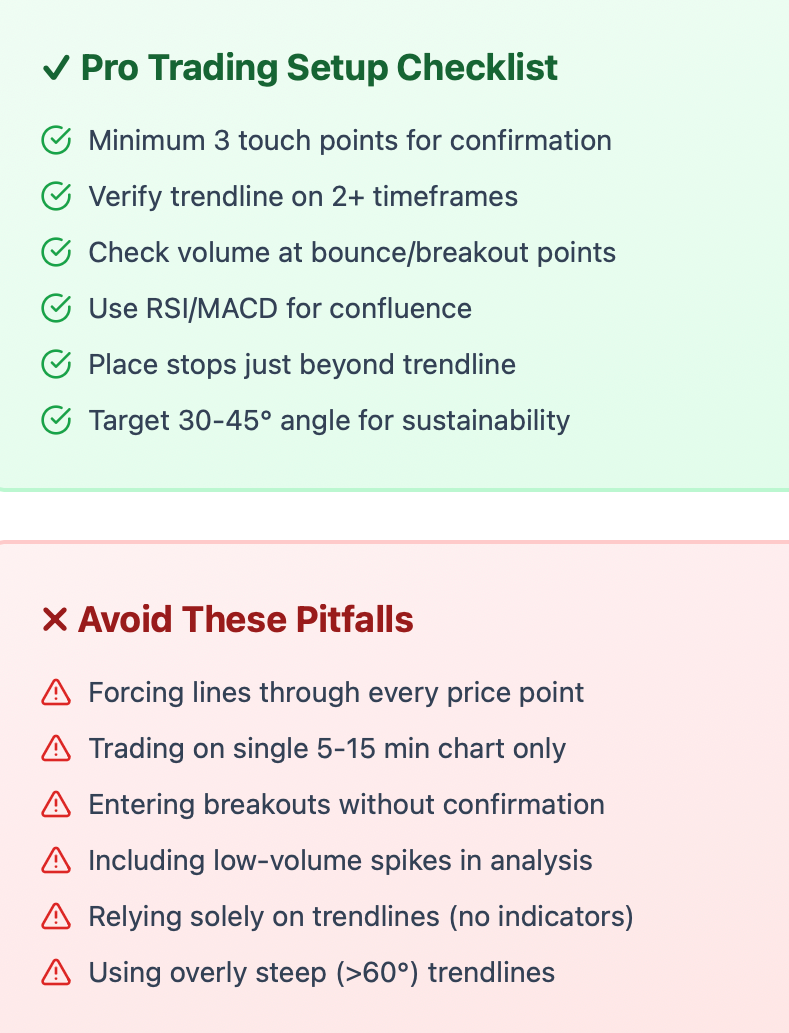
The golden rule: You need at least two points to draw a line, but three will confirm it. Don't draw a connection between every high and every low - just ignore extreme outliers that quite obviously do not fit with the overall pattern.
When you add multi-timeframe analysis into the mix, you will get even more information. A trendline may be very well formed and look very strong on a 15-minute chart, but may be meaningless when viewed on a daily chart.
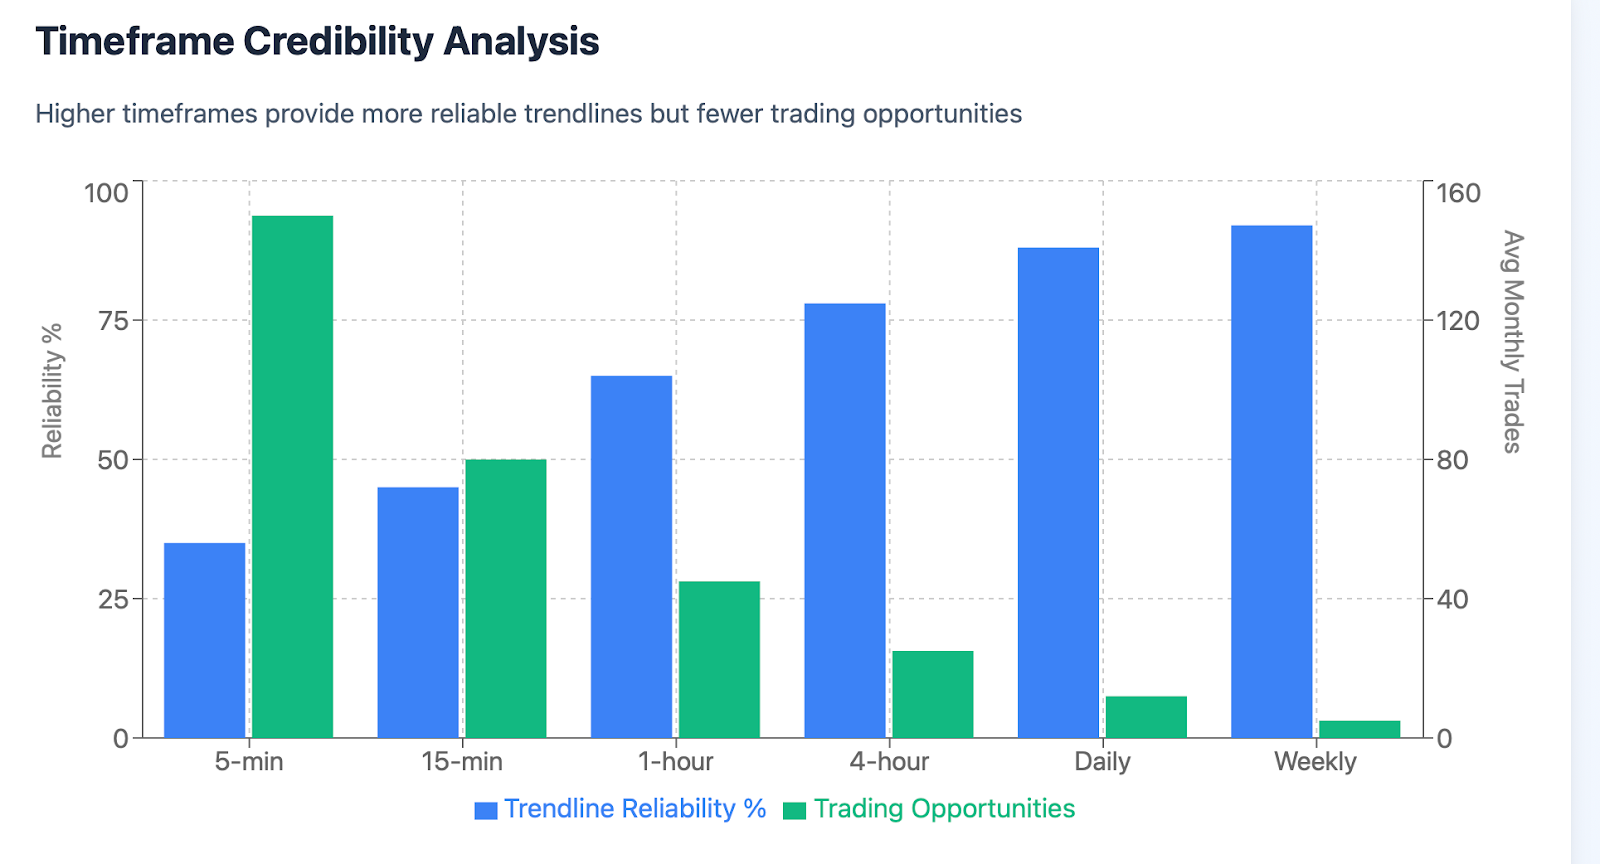
Professional traders will often look at multiple timeframes to see what trendlines offer more credibility. For instance, a USD/JPY trendline that holds on both a 4-hour chart and a daily chart is more important than a trendline that shows on a shorter timeframe.
Pro tip: Confluence your trendlines with volume analysis. In other words, if price bounces off a trendline with a lot of volume, this will provide a stronger signal than if it had bounced off on low volume.
Now comes the fun part - being able to use trendlines to make money. Trendlines serve many purposes in your trading strategy:
The most obvious use is trend identification. If price is making higher lows along an uptrend line, the bulls are in control. If price is making lower highs along a downtrend line, the bears are in control.
Trendlines clearly define the support and resistance levels. An uptrend line usually will serve as dynamic support and the price will often bounce off (or to) it multiple times before either breaking through that support or continuing higher. The same can be true for downtrends in reverse, where a downtrend line serves as resistance.
Entry strategies would derive value from thinking of trendline again. Some traders buy when the price bounces off a trendline - uptrend line that is - while other wait for the price to clearly break and close above a downtrend line to signal a possible reversal in price direction.
There is also logic in your stop placement when thinking of trendlines. If you are buying in anticipation of a bounce of an uptrend line your stop should be placed just below the trendline you are trading against. If the trend line has been broken, you definitely want to be out.
Breakout signals are also often where traders have experienced the most explosive trading opportunities. Think of GBP/USD at the end of 2020 when it broke above the multi-month downtrend line and sparked an explosive rally - traders were likely waiting for this breakout to happen to position their buys.
The key is to think of trendlines in combination with other indicators. RSI will define whether the price is overbought at the downtrend line, while MACD confirms the momentum on a trendline breakout. Volume indicates whether the bounce or breakout was real or if it would be best to not take that trade.
Common Trendline Mistakes to Avoid
Even experience traders fall into these trendline traps:
Overfitting is the largest mistake. Do not attempt to connect each and every high and low with perfectly straight lines. Markets are messy and forcing trendlines through every price point creates confusion rather than clarity.
Overlooking market noise results in false signals. That random spike higher during low volume Asian trading probably has no business being a part of your trendline analysis. Pay attention to established moves during active trading hours.
Single timeframe tunnel vision ignores the larger picture. A breakout on a 5 minute chart means nothing if the daily chart has a strong opposing trendline quoted in the analysis still intact.
Trendlines as the only consideration without other indicators to confirm sign you up for disappointment. That perfect trendline bounce is probably a bull trap if volume is diminishing and momentum indicators are showing bearish signals.
AUD/USD false breakouts are legendary among forex traders. The pair loves to go through key trendlines only to reverse on the trader, leaving the breakout trader on the wrong side of the trade. Always wait for a confirmation candle, also consider smaller position sizes on initial breakout trades.
Advanced Trendline Techniques
Professional traders utilize many advanced ways of using trendlines that beginner traders overlook:
Parallel channels accompany an upper and lower trendline to create trading ranges. When you draw your main trendline, you then create a parallel trendline at the opposite extreme. The EUR/JPY currency pair often moves within these channels for months before breaking out, which signals an opportunity to either buy or sell (and likely other options as well).
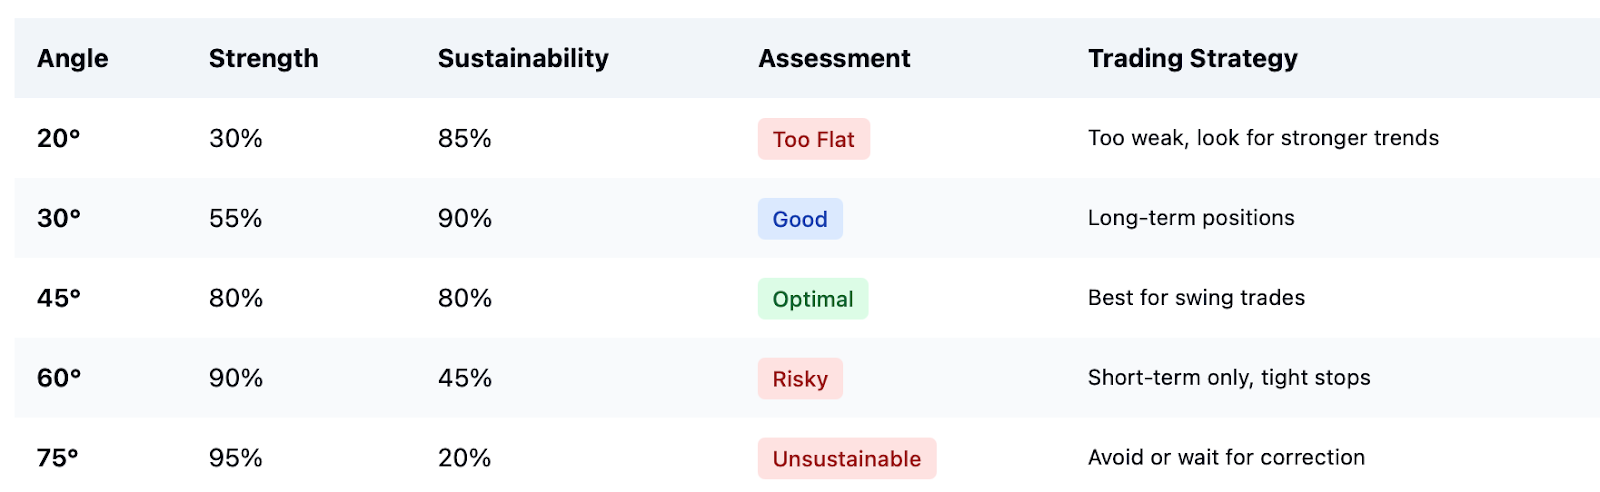
Another concept to consider is slope analysis. Steeper slope indicates stronger momentum and is more likely to break the trend. A gentler slope indicates more sustainable momentum, meaning it may last longer. A trendline angled at about 45 degrees balance strength and sustainability.
Dynamic trendlines incorporate traditional/uptrending trendlines with the levels of a moving average. There are simply traders that will draw a trendline incorporating levels of moving averages just to determine a more fluid support and resistance zone.
Multi-trendline convergence can directly correlate to important trend reversals. When you observe multi-trendline convergence at the same price level across different timeframes, this area becomes of huge significance to future price movement.
People don't realize that trendline angle can contribute to trendline failure. An angle that is too steep (greater than 60 degrees) often fails and breaks quickly, while a trendline with a flat angle (less than 30 degrees) usually does not offer valuable support or resistance for traders.
There are advanced techniques that can only be perfected with practice and experience, and depend on the appropriate risk measures being used, but if universally used, can dramatically improve trading accuracy.
Mastering Trendlines: Your Path Forward
Trendlines are crucial to successful forex trading, but they are not the complete solution. The smartest traders pair trendline analysis with multi-timeframe analysis, volume analysis, and momentum indicators for a complete and powerful trading strategy.
Begin by practicing drawing trendlines on historical charts. Look for clear trends and check how your lines predicted price action to the best of your abilities. Next, start demo trading with trendlines, so you can practice your trendline strategies without risking real money.
No trading indicator or technique is correct all of the time. Trendlines can fail, breakout trends can break down, and support can crack. Risk management and position sizing are the important aspect to any successful trading, because it does not matter where you go wrong, if it obliterates your account.
Focus on quality over quantity. It is better to identify a few trendline setups with high probability weeks than to feel obligated to trade every trendline interaction you see.
Are you ready to take your forex analysis skills to the next level? Start practicing trendline analysis now, and you will see your market timing improve tremendously.
Join thousands of other successful traders who have mastered this important skill, and start to develop your own profitable trading strategy.
Disclaimer: The content of the blog does not represent any position of Trade W, does not serve as any trading-related decision advice, and does not endorse any third-party.