

 Trade W
Why Volume is Critical in Forex Trading
Volume quantifies the number of trades or value exchanged in the market. Think of volume as the heartbeat of trading activity. High volume indicates that trading activity is occurring. Low volume indicates there is little activity occurring.
Volume is a crucial measure of market activity and reliability of trends. Professional traders pay close attention to volume, because it often reveals market sentiment. Price moves that are accompanied by strong volume are often likely to continue. Price moves that are accompanied by weak volume are often likely to be false moves.
For example, think about the EUR/USD breaking a significant support level. If the EUR/USD breaks that support level on high volume, then the trader can confidently trust the move as strong. If the price breaks that level with little to no volume - the trader likely cannot trust the move as being strong.
Think of it this way - the more kids that are playing soccer on the playground indicates it is a popular game; fewer kids playing indicates it is less popular. Volume is similar in trading.
Recent movements in the USD index surrounding decisions by the Federal reserve indicate this perfectly. When the Federal reserve makes an announcement with respect to interest rate changes, the volume will spike drastically. This is very useful when determining if the market's sentiment move is true or simply temporary.
Volume demonstrates basically both, price movement and tacit market sentiment. It is your window into other traders thoughts and moves.
Understanding Volume: Definitions and Core Concepts
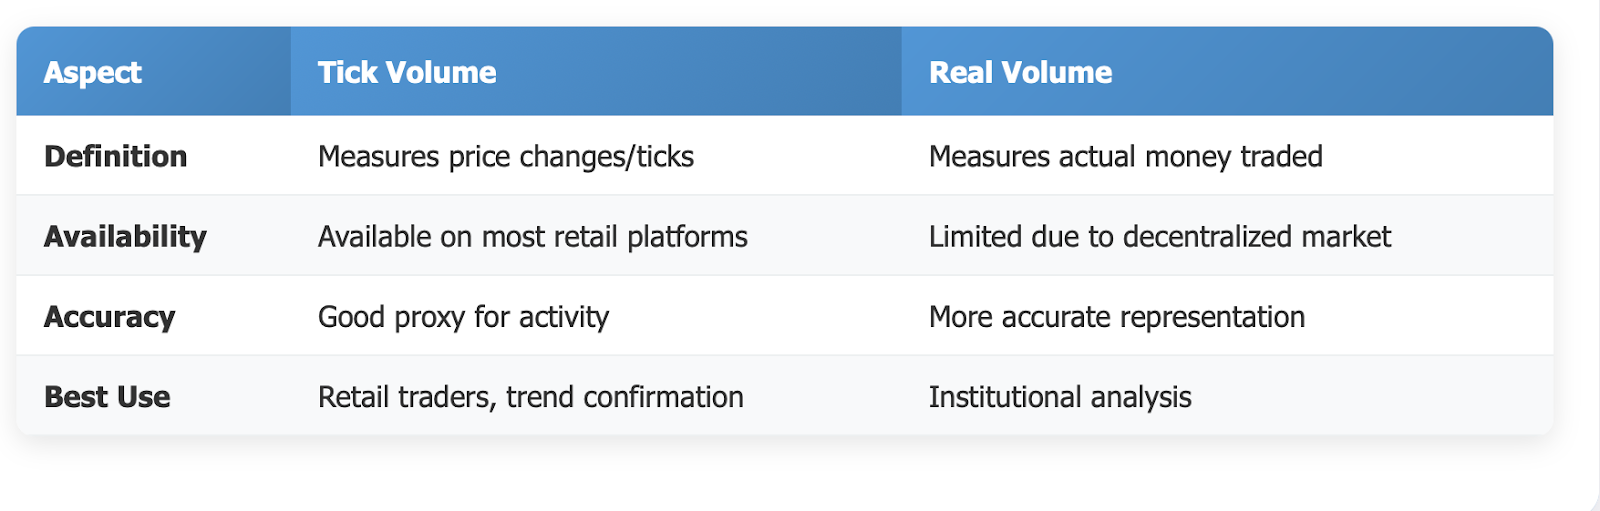
Volume refers to the total trades or value that can be executed in a given timeframe. In forex, you will come across two types of volume: tick volume and real volume.
Tick volume will measure price changes or ticks, while real volume will measure real money traded. Most retail forex platforms provide tick volume, while real volume will vary due to the decentralized forex market and limited data that everyone has.
Understanding the volume-price relationship is critical to successful trading. Volume usually triggers price movement, and increases in volume often increase the speed of price movement. Decreases in volume may suggest a weakening trend. Understanding the volume-price relationship will help traders analyzing where prices may be headed next.
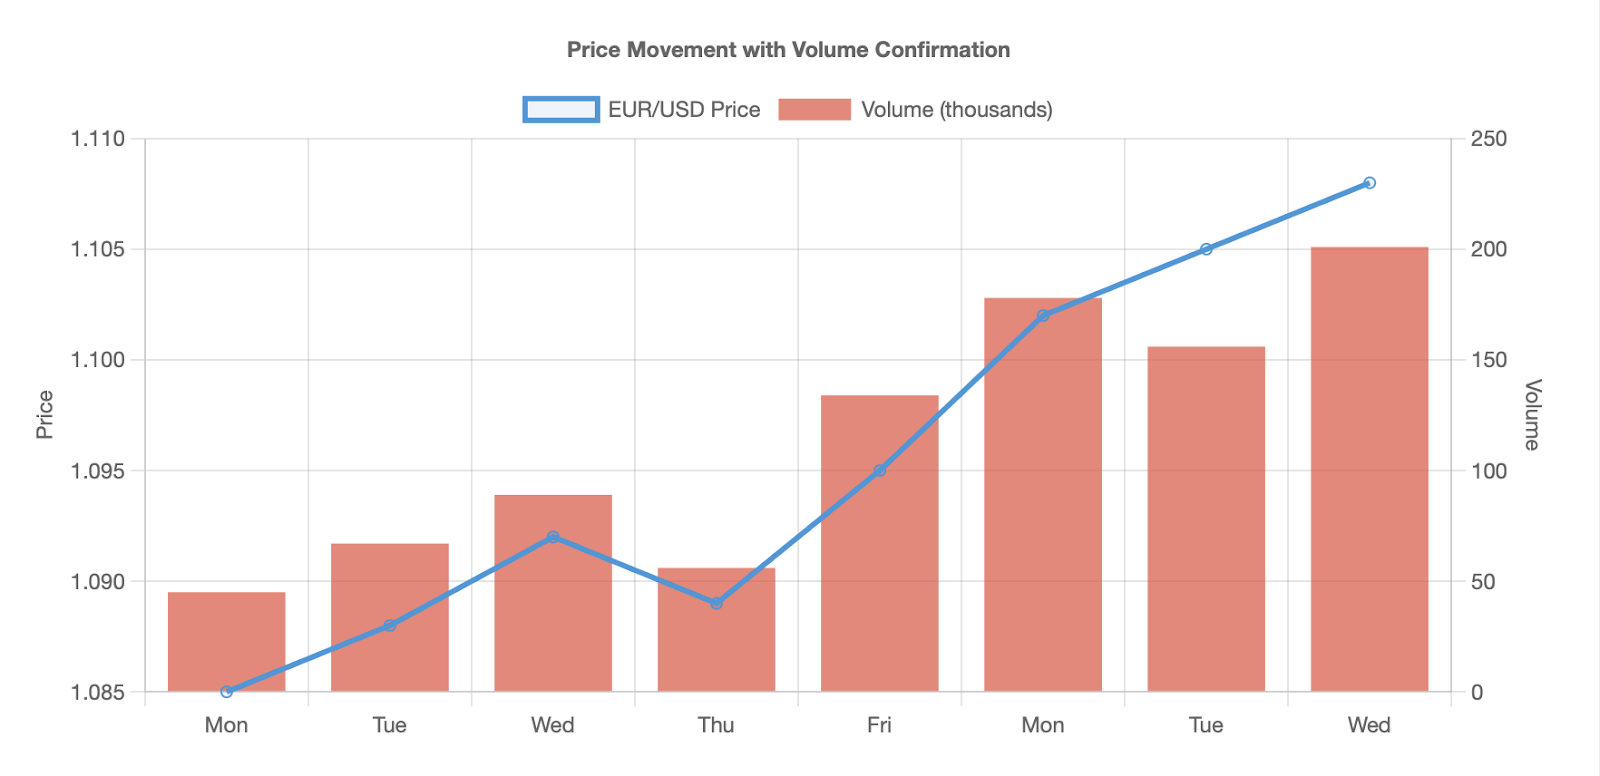
Releasing major economic data will provide a perfect example. When the Eurozone releases GDP data, volume in EUR/USD will often spike. The spike in volume will indicate that the traders are reacting to the news release and adjusting their positions.
Think of volume at a store. If products are selling more often than they are not, the trader knows the product is popular. If the demand for the products starts to slow, the trader knows the demand is likely declining. This is how volume works for currency pairs.
Volume is reflected on price charts visually by a histogram at the bottom of the price action. A tall histogram on the price action chart will indicate that a lot happens. Quiet trading sessions will have a shorter histogram than other periods. Overall, volume provides a clear and easy-to-see indicator of current trading activity.
Volume is a direct indication of market strength and trend reliability. Strong trends require strong volume. Weak volume in trending markets will typically indicate weaker, and less reliable, trends.
Using Volume to Confirm Trends in Forex
A rough trend that is accompanied by rising volume signifies strong buying pressure. A down trend that has volume increases tells us there is active selling pressure behind it. Volume confirms trend direction. Furthermore, if prices rise with decreasing volume it indicates weak trend strength. Smart money may be leaving and retail traders are entering, which is a divergence and a cautionary signal of trend reversal.
GBP/USD is a great example. If it breaks a long-term resistance level and the increase in volume is sustained, it really begins to add to the trend credibility, which is a good time to trade.
Think about kids lined up to buy a popular snack. As more kids jump into the line, the snack's popularity is clearly on the increase. The vendor sees this line of increase product demand.
The trends of the USD/JPY during the Bank of Japan announcements is another way to visually see this concept. Strong volume will support true move trends while weak volume will suggest temporary price action.
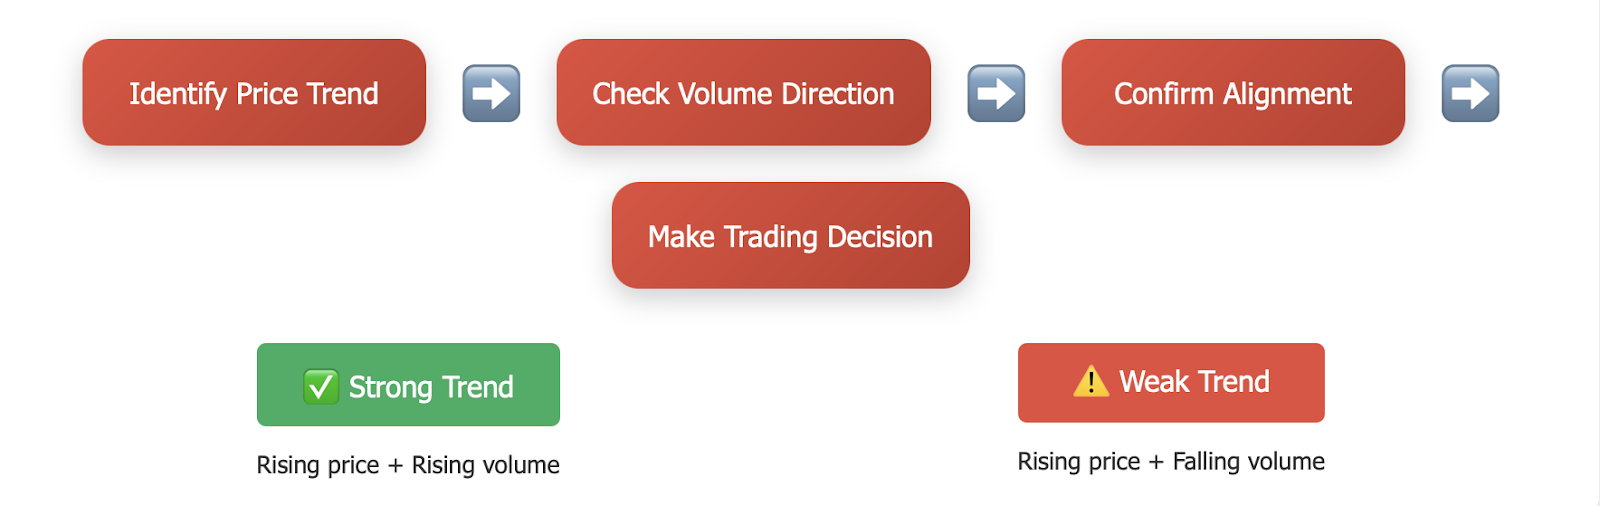
Using volume histograms against a price chart shows the same thing is visually quantifiable (to price action) regardless of scale. Green volume bars in uptrends indicate buying interests. Similarly, red volume bars in downtrends indicate selling pressure.
Volume signals strength of trend movement as well as confirms trend sustainability. You can use price action and volume to make better entry and exit decisions.
Identifying Abnormal Volume for Trading Opportunities
Abnormal volume refers to being either significantly higher or lower than usual. Often when we see spikes in volume, you'll find them occurring right before a significant market move. Smart traders are aware of these abnormalities as well.
You can compare the volume now with recent averages, and it's helpful to utilize OBV and VWAP in conjunction with, or in lieu of comparing the volume. These calculations will detect volume abnormalities automatically.
Abnormal volume can mean breakouts, reversals, or just extreme market sentiment. All three circumstances produce possible trading opportunities when prepared to participate.
A very well-known example is the announcement of non-farm payrolls. The USD/CAD usually produces abnormal high volume during the release. In fact, this spike usually leads to a short-term trend.
Think about a seemingly boring topic having the entire classroom engaged in a discussion; this is the necessary interest in the topic that indicates that something important is going on. Volume spikes are like that too.
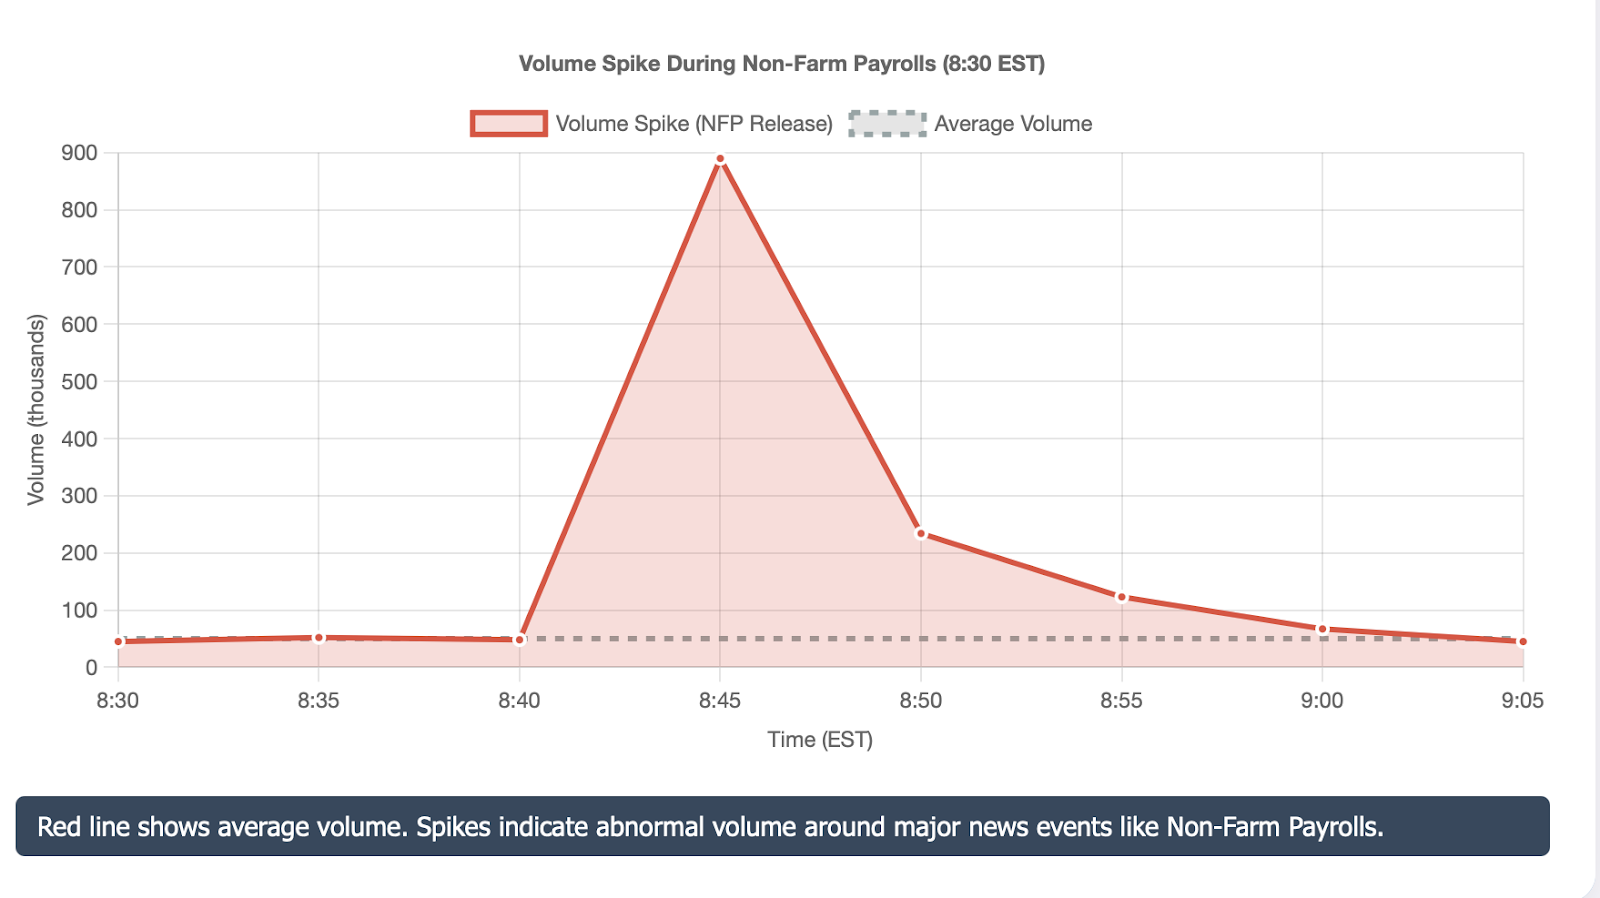
Average volume charts can also help find extremes. Chart the volume now in comparison to historical average volume. If you see something significantly different than what you have averaged, it bears further investigation.
Abnormal volume often signals to the trader that a major move is about to occur, and enables the trader to become positioned before the market moves.
Volume Indicators and How to Use Them
Some commonly known volume indicators are On-Balance Volume (OBV), Volume Weighted Average Price (VWAP), and Volume Moving Averages. Each is for specific analytical inquiries.
OBV reflects the addition of volume on price-up days, and subtracting volume on price-down days, resulting in a cumulative line that reflects directional flow of volume. If the OBV and price are presenting divergences, this could indicate a price reversal.
VWAP calculates the price on average, weighted by volume. This measure is typically used by institutional traders as a benchmark. If price action is above the VWAP, then investors are behaving bullishly. If price action is below the VWAP, then bearish pressure by traders might be viewed.
A very useful example of OBV power is fluctuations related to EUR/GBP. In this price instance, price is rising despite OBV declining at the same time, indicating a reversal approach. Good, smart traders are aware to ready themselves for the expected trend change before it actually occurs.
You can visualize it similarly in terms of votes taken in a popularity contest. The more votes someone receives, the stronger their support. Less votes would mean declining popularity. In this instance, the volume indicators act similarly to a voting counter.
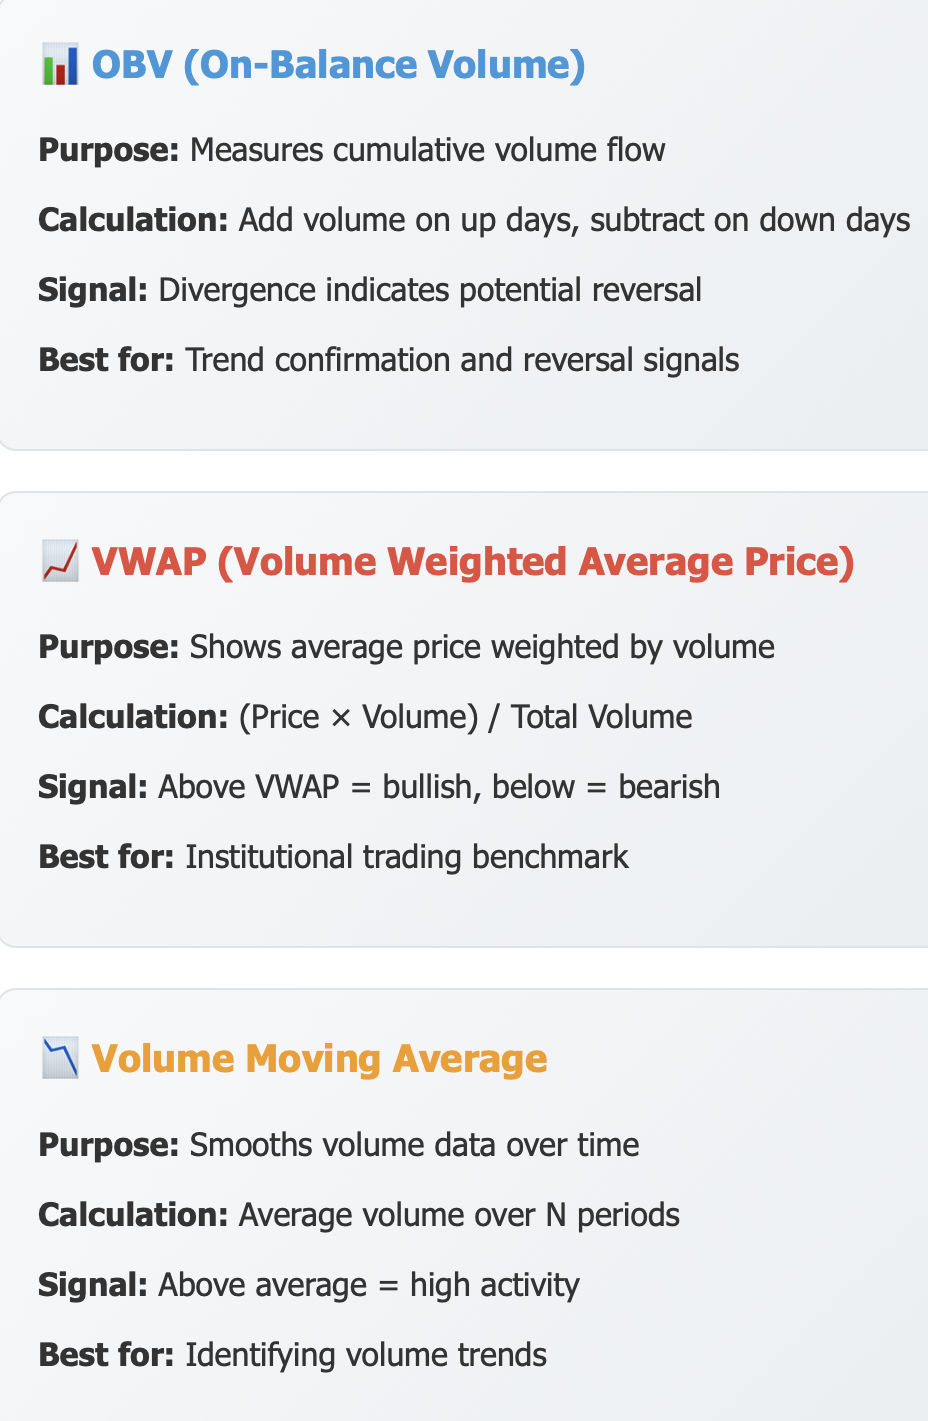
Another effective way OBV could improve direct visual analysis is using OBV overlays. If prices rise while OBV also is rising, it indicates bullish price movement is probable. As a counter of illustrated chart price movement, falling prices when OBV is also falling indicates a positive trend-up but that actual weakness is at play.
Daily price fluctuation observations with USD/JPY OBV can support the concepts as price changes both before and after central bank intervention. The paradigm occurs in volume flow shifts happening in advance of the price movement, sometimes by several days, weeks or more.
If a trader combines multiple indicators with volume assessment, that approach allows an incremental addition to their judgment capabilities on trend direction. Relying on a complete indication/reflection plan is critical to support decision behavior.
Volume and Risk Management in Forex
Volume provides insight into position sizing and the right level of stop-loss. When trading high-volume moves, more extensive stops are warranted. Conversely, when trading low-volume moves, a tighter stop-loss for risk management is preferable.
Volume decreases often indicate range-bound (lower volatility) market conditions, so plans and positioning should change accordingly. In low-volume ranges, smaller positions are sometimes more appropriate than larger, especially if volume isn't expanding.
For example, think of one trade where you confirmed buying more of a popular snack food. You were able to know if the quality was what you expected before buying additional products that you could have grown to regret. Volume-based positioning is kind of the same thing.
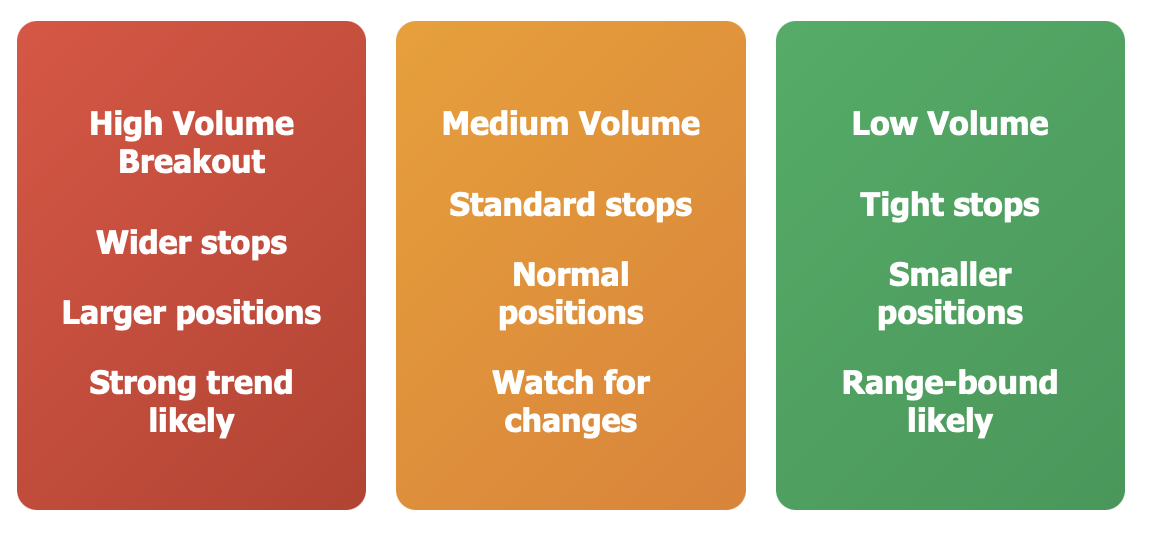
The illustrations of position sizing show the relationship between volume at breakouts very clearly. High volume means more shares to buy or sell. Low volume means less. In your overall plan based on position sizing, risk is a mathematical condition.
Stop-loss placement will also benefit from understanding volume. If the volume is high, the support level is likely to hold better than if it is low volume, when it may not hold support.
Volume is a valuable part of the process for reducing risk and position management. Control your risk and enhance your trades over time as comfortably as possible without the macro analysis.
Common Mistakes and How to Avoid Them
Losing Money by Following Volume Without Context
Simply following the high volume without context will result in losing money. Volume needs price action and market background to be understood correctly. Following volume in a vacuum will inevitably create errors that can be costly. In the case of following the market's high volume around major news events, the high volume will react differently than it would during normal trading sessions.
Volume should always be analyzed with trend analysis, technical indicators, and news blend. This will reduce the likelihood of entering false signals and increase the probability of entering traders. Following the high-volume spike without understanding the cause will often result in loss the following day. Professional traders will always seek context first before following volume.
For example, while going for a snack, if there happens to be a long line, if we follow the line blindly and wait, only to realize the snack is terrible. We simply followed without taking the time to check first. Analyzing Volume requires the same type of caution.
An incorrect volume analysis is one that focuses on the indicator alone. Correct volume analysis blends volume with price action, trends, and market conditions.
Take some time to study these common mistakes to improve your volume analysis. Learning from the mistakes of others is a great way to move your own volume analysis process forward.
Volume must be analyzed in context to full market context. Isolating volume analysis will typically lead traders to mistakes.
Practical Strategies and Real-Life Examples
Trend-following systems use breakout confirmation in conjunction with high volume for an entry method, which can greatly increase your chances of success.
Reversal systems look for divergences in price versus volume to determine when a pull-back is pending. Early signals of divergences are great entry points. Day-time frame approaches can be combined with swing trading-type approaches using volume.
Short-term traders often benefit from a volume spike while longer-term traders consider volume over a longer time frame. The EUR/USD using an Intraday breakout strategy should work well with a volume confirmation. You would get long or short when price breaks above or below key levels, and there is volume confirming. Depart once the volume lessens.
This is like a simulated stock market game you can play. The difference is, you'll be watching volume as well as price patterns, to give you the best times to buy or sell. The more you practice, the better you will become, and the more confident you will get too.
Along with price actions, you can create a clear format of decisions and actions with volume give trading signals mark on the strategy flowcharts. If you take consistent action to follow these systematic approaches over time you will see results.
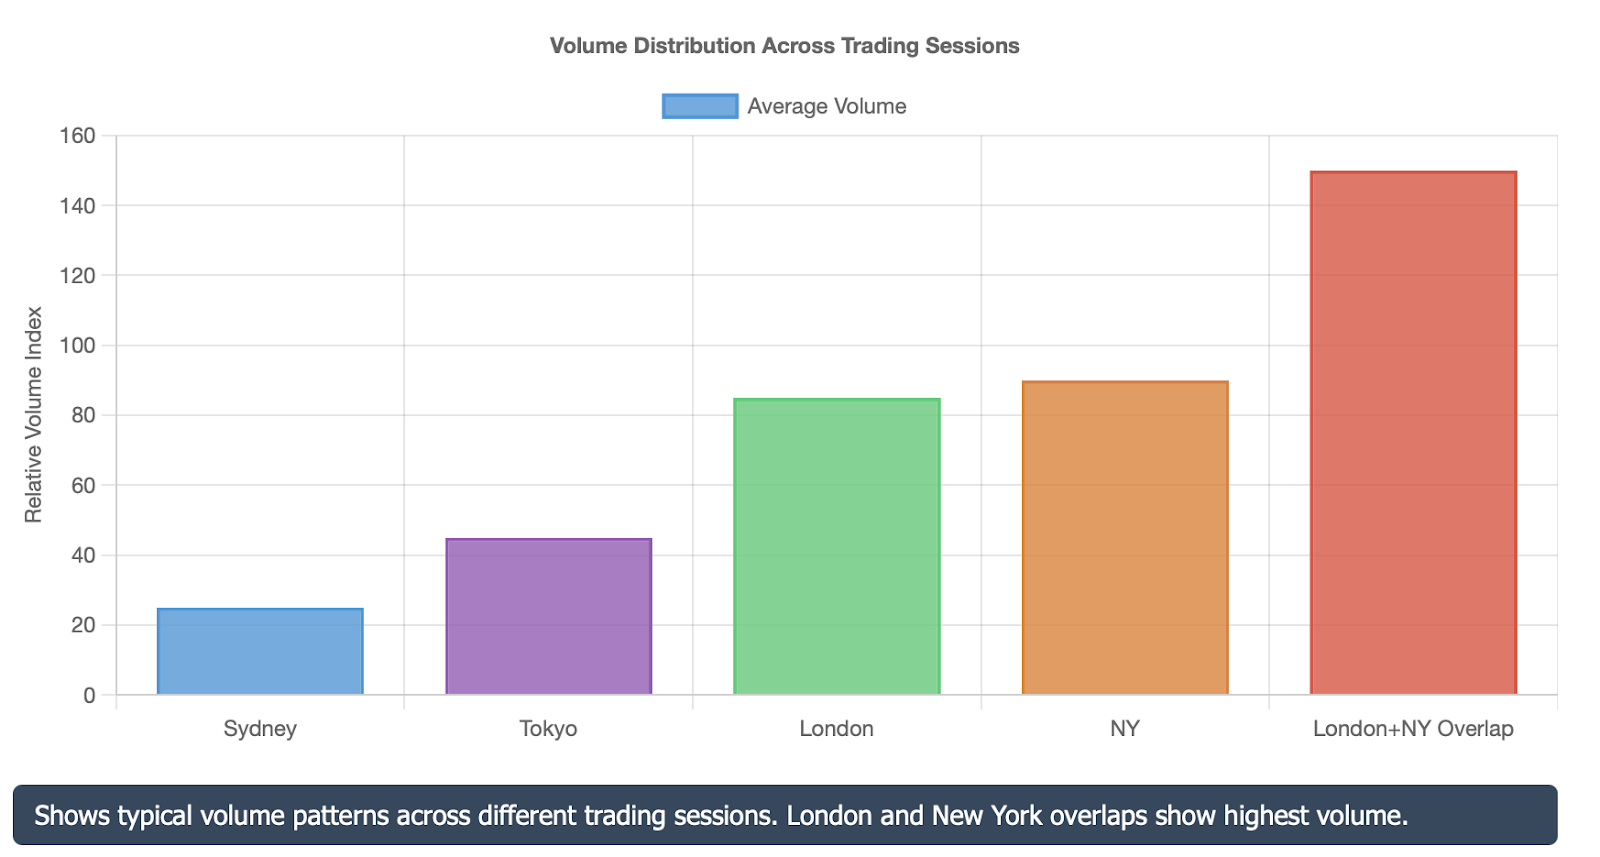
When watching the London and New York trading sessions volume entry's usually produce the best trade opportunities. Volume is usually heavier, and the make signs clearer.
Volume is the essence of a profitable entry strategy, and it confirms trend direction. Create and maintain trading habits use volume and price pattern recognition as part of your regular trading signals. This will lead you on the path to trading success.
Conclusion & Call to Action
Volume analysis helps you move from intuition to certainty when making trading decisions. Volume confirms trends, calls reversals, and manages risk effectively.
Professional traders never ignore volume; they know that volume is a critical component of market analysis and strategy implementation.
Work on volume analysis in demo accounts for practice, to build confidence, and before risking real money. Also, learn to read volume in different market settings.
Don't forget to utilize volume with other technical indicators, completing the overall analysis. No single indicator gives you all the information you want and need.
It takes no few patient weeks or repetitive practice to develop considerable experience at reading volume. Start with major currency pairs because volume readings in minors are far less reliable.
Are you ready to start profiling volume? Begin to engage and follow volume in your favorite currency pairs now.
Join our advanced trading newsletter to receive weekly volume analysis in your email so you can prove necessary volume-risk homework. Volume is a serviceable blocks of instruction to engage your trading to professional levels.
Disclaimer: The content of the blog does not represent any position of Trade W, does not serve as any trading-related decision advice, and does not endorse any third-party.