

 Trade W
Introduction to Wedge Patterns in Forex Trading
Certain patterns, while scanning forex charts, will stand out to you like road signs previewing an opportunity. The wedge pattern, for example, is one of the more reliable patterns you'll see, which can help predict which direction prices might break next.
The wedge is simply a chart pattern formed by two converging trendlines that compress price action in an ultimately tighter range. Think about this in terms of a basketball being compressed into a smaller and smaller tunnel. Eventually, the pressure builds and builds until the basketball pops out one side. This is what happens with currency prices being compressed in a wedge.
Wedges are categorized in two ways: Rising Wedges and Falling Wedges. Each tells a different story regarding sentiment toward the market and the next potential direction. Rising wedges typically show they are losing momentum to the upside; falling wedges often show they have lost momentum to the downside.
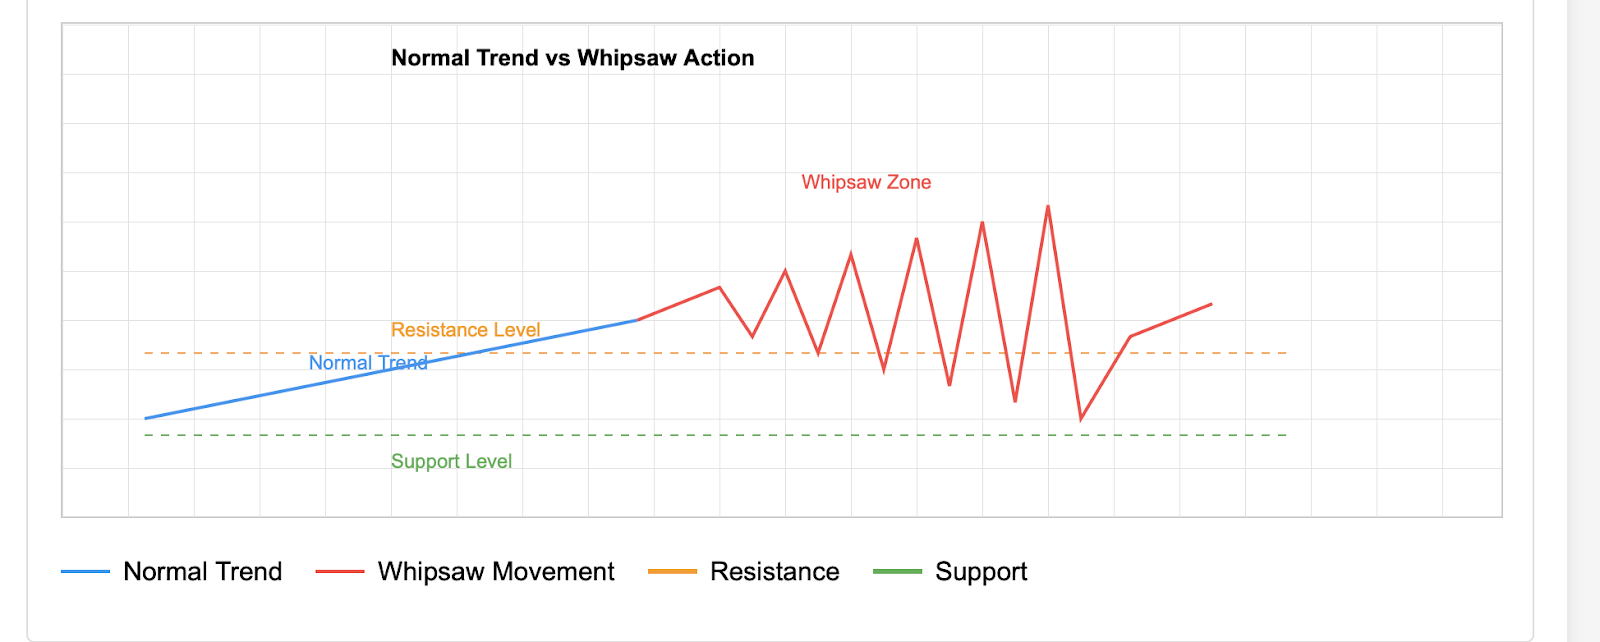
There are ultimately two types of scenario these patterns indicate. They tell you the current trend with continue for a slight degree (continuation), or they tell you the trend is about to change direction (reversal). The difference will certainly be learned by reading the context.
Let's consider a case study using a professional example. Assume the EUR/USD pair has been moving in a decreasing range between 1.05 and 1.10 for many weeks. The highs and lows are arranged progressively closer together, following the wedge characteristics. That is until, out of the blue, there is a sharp move upward, after a Federal Reserve rate announcement, which takes the pair above the upper trendline. That is wedge breakout action.
Takeaway: wedges are not crystal balls. They are odds-based indicators that give you a rational risk-adjusted edge; in other words, a higher probability setup, not a propensity for displacement or eliminating risk. Intellectually sound traders use wedges as part of a bigger strategy versus a standalone signal.
Types of Wedge Patterns: Rising versus Falling Wedge
A better understanding of the wedge two types will enable better trading decisions, as both types have personalities and typical behavior.
The rise wedge patterns are occur in an uptrend but come with a bearish warning. Imagine a balloon being further inflated with a tight rubber band that is wrapped around the balloon. Clearly the balloon is getting larger and larger, but with every inhale on the balloon something has to give.
In a rising wedge both the high and the lows are in increasing motion; however, the momentum is diminishing with every new increase in highs and lows. The trendlines converge, and buyers are no longer able to get enthusiastic enough to take prices higher.
As the wedge pattern develops, you will typically see volume decrease, which is consistent with a fading interest on the buying side. The pair usually breaks only to the downside once the wedge pattern completes; something to catch the bullish traders losing money caught off-guard. It happened most indefinitely in GBP/USD when the currency closed above a seemingly clear rising wedge and began a reversal lower during 2021.
Falling Wedges "tell the opposite story." Falling Wedges occur in downtrends, and generally signify bullish reversals. Think of it like a ball that has been rolling down as the slope has been narrowing to a point of there is nowhere to roll forward expect backward to bounce up. With the wedge pattern forming, the upward selling pressure is weakening.
Falling wedge, the highs trend lower, the lows trend lower, but the new lows are becoming less aggressive as time goes on. The trendlines converge to ask bearish active sellers'Somene?'.
USD/JPY has achieved this multiple times, and I have said this a few times, but have demonstrated this formation not too long before a significant dollar strengthening upward venture higher after many short-term swings.
Volume matters here too. As the falling wedge is forming, you often will see the volume of selling decrease, and then increases when the price ultimately breaks up higher. Volume is one of the ways to differentiate between a valid break out price action process versus false signals.
Key Distinctions:
- Rising Wedge: Forming in uptrends with bearish results
- Falling Wedge: Forming in downtrends with bullish results
- Both type of wedges are only viable if you have volume confirmations
- Both type of wedges take weeks or months to form
Again, these are just tendencies, not hard and fast rules. Markets do have a way of surprising you which is why risk management always comes first.
How to Recognize a Wedge Pattern in Forex Charts
Identifying wedges on your charts is easy once you know what you are looking for. The wedge formation has some key characteristics that help distinguish it from other patters.
The first thing you will want to identify are the trend lines. You will need two clear lines that converge over time, or at least two swing highs and two swing lows. Think of two chopsticks that get angled inward, trapping a ping pong ball, that pinn pong ball will eventually pop out. You want them to have some slope towards one another (not too steep), indicating a narrowing channel.
Next is the volume. Volume does play an important role in the wedge story. As the wedge develops, trading activity is generally low. This would make sense, as a narrowing price range would reflect uncertainty and indecision on the part of the market. The signal comes when traders "confirm" a waning wedge pattern, but it is a clear sign they are waiting for direction to investing their capital.
Timeframes also play a role. True wedge patterns often take a minimum of two weeks to three months to form when viewed on daily charts. Anything less than this may be mere noise; anything longer than this could risk losing its predictive power.
Don't mix wedges and triangles, which is a common error that new traders often make. Triangles have one horizontal and one sloped line, while wedges have two lines moving in the same direction (up with rising wedges, down with falling wedges).
For example, if you were drawing trendlines on a 4 hour USD/CAD chart, each trendline should connect at least two distinct swings. The more touches you have, the more significant the trendline becomes. However, do not try and draw a trendline with connections that are not naturally there.
Volume confirmation is also important. Look for decreasing volume as the pattern develops, then a spike during a breakout. This means that traders are simply waiting on the sidelines, waiting to trade once it was clear in which direction to trade.
Improve your ability for pattern recognition by studying historical charts. Look at the major pairs like EUR/USD and spot wedge formations that occurred in the past. In the past, you want to practice noting how these wedge formations occurred, what time they broke and how many pips they may have traveled once they broke. This practice will assist you in recognizing if there is a similar wedge formation in live trading.
With ideal wedge formations, price converges, volume is decreasing, and it touches the trendline evenly and smoothly. When these three elements are present you probably have an ideal wedge formation that is worth watching.
Wedge Pattern Trading Techniques for Forex Traders
To trade wedges properly will take patience and discipline to execute all the way. You can't simply recognize a pattern and jump into the trade. You have to wait for a confirmation and make sure you have a plan in place to manage your risk.
The ideal wedge signal is price is consolidating and breaks out either trendline with conviction. Think of the wedge like you're at a starting line with your foot on the pedal waiting for it to go off (the break) for you to sprint to the finish line, before that you are just standing there watching.
Entry approach: Wait for the first confirmed candlestick to close above the trendline. This method will give you a far better likelihood of success, as opposed to trying to chase the breakout. Fake breakouts occur a lot, and the additional confirmation will save you, what can be valuable pips.
For example, if you are trading an AUD/USD falling wedge, you want to wait for a daily close above the upper trendline to go long. It would be best if the breakout comes on more volume so you can establish a better assumption that real money is moving the asset.
Stop loss placement: Place your stop loss beyond the opposite edge of the wedge. If you are buying a bullish breakout, your stop goes below the lower trendline. You want to give the trade more room, thus exposing less risk to the trade.
The logic here is simple: If price rallies back to the opposite edge of the wedge pattern, you were likely incorrect in your analysis, and it's time to exit.
Profit target(s): You can measure the height of the wedge at its widest point and project that from the breakout location to provide you with a viable profit target off the structure of the pattern.
If say the height of your AUD/USD falling wedge is 200 pips at its widest point, then if it breaks upward at 0.6500, your first target would be around 0.6700. The measure-move method works well for determining your first target, but certainly, you can make adjustments based on other technical levels.
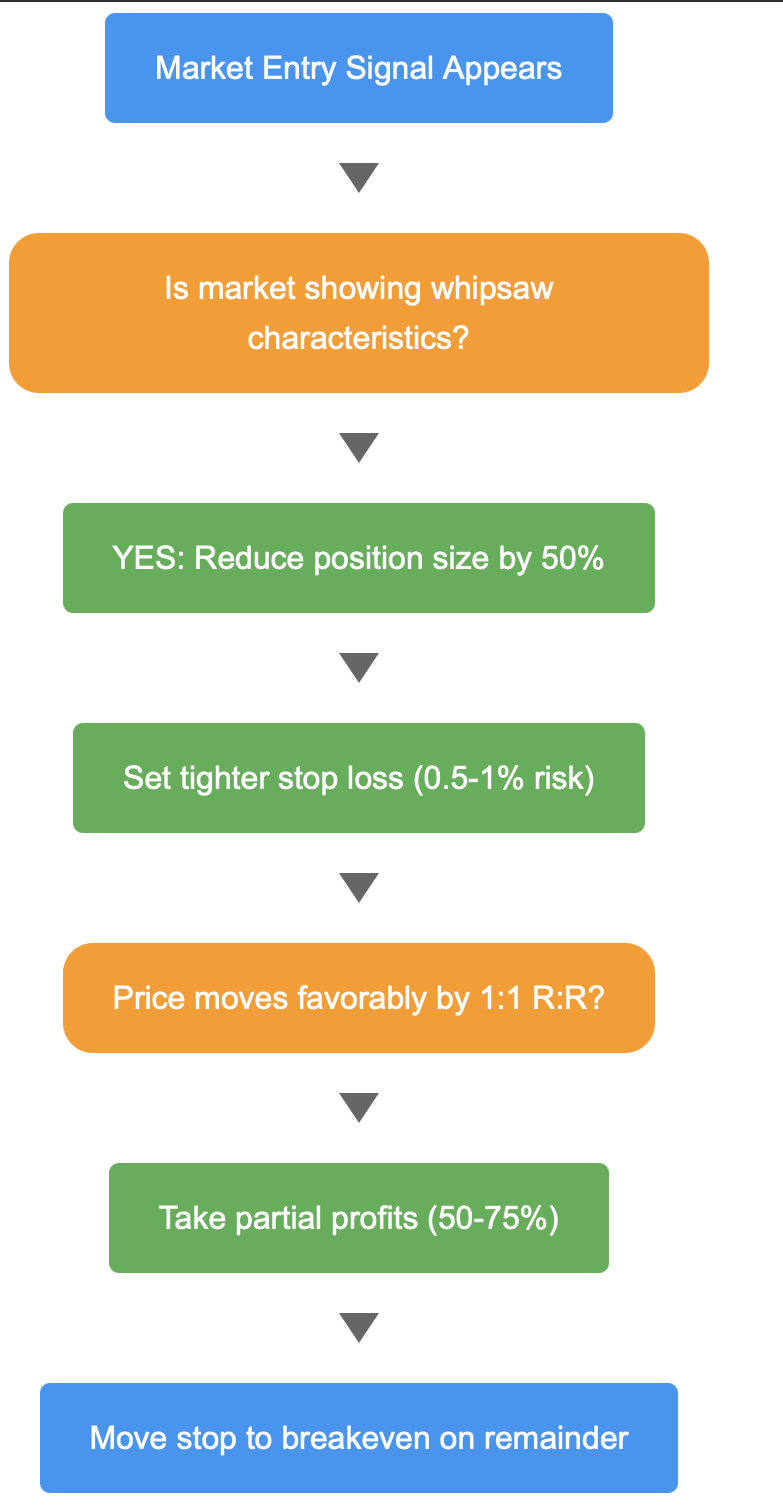
Risk Management: Avoid risking more than 1-2% of your total account on any one wedge trade. The pattern may give you decent odds, but nothing is guaranteed. Always be sure to position size according to your stop loss distance to place your account in a position that one bad trade won't ruin your account.
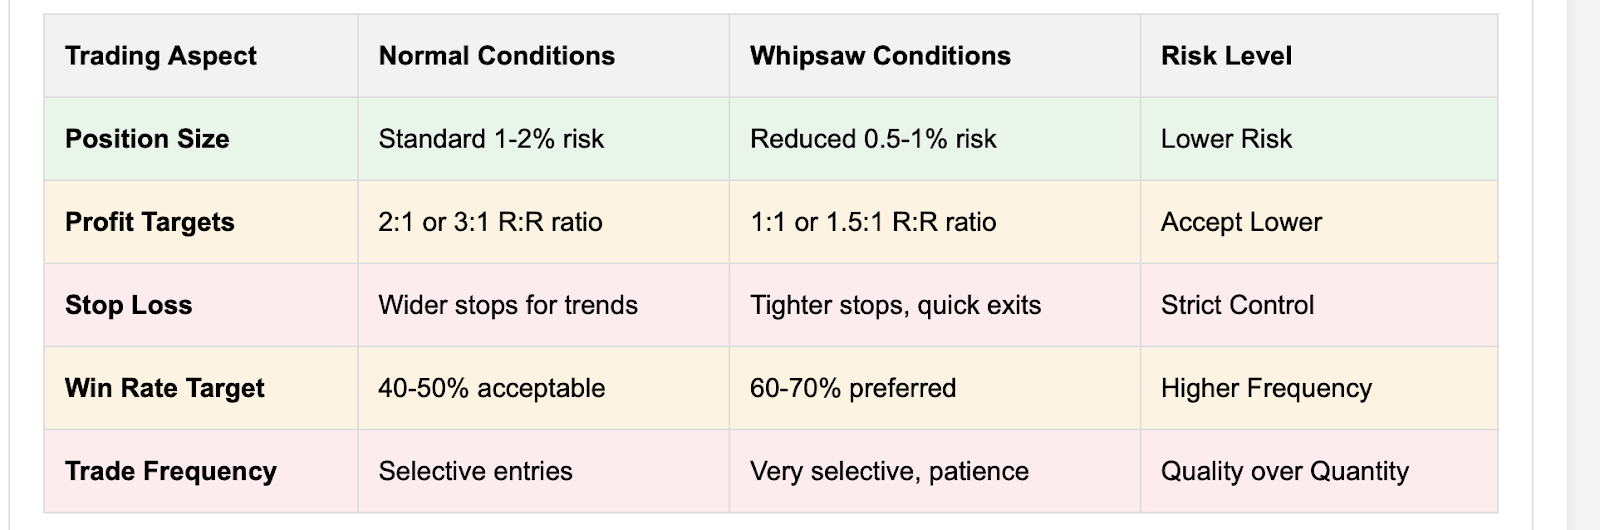
Consider taking partial profits at a resistance level as well. This allows you to lock in some profit while still giving the trade room to extend if completely reached your target.
Multiple Timeframe Confirmation: Check multiple timeframes for general trend direction confirmation. A bullish wedge breakout on the 4 HR time frame has more importance if the Daily chart is also bullish.
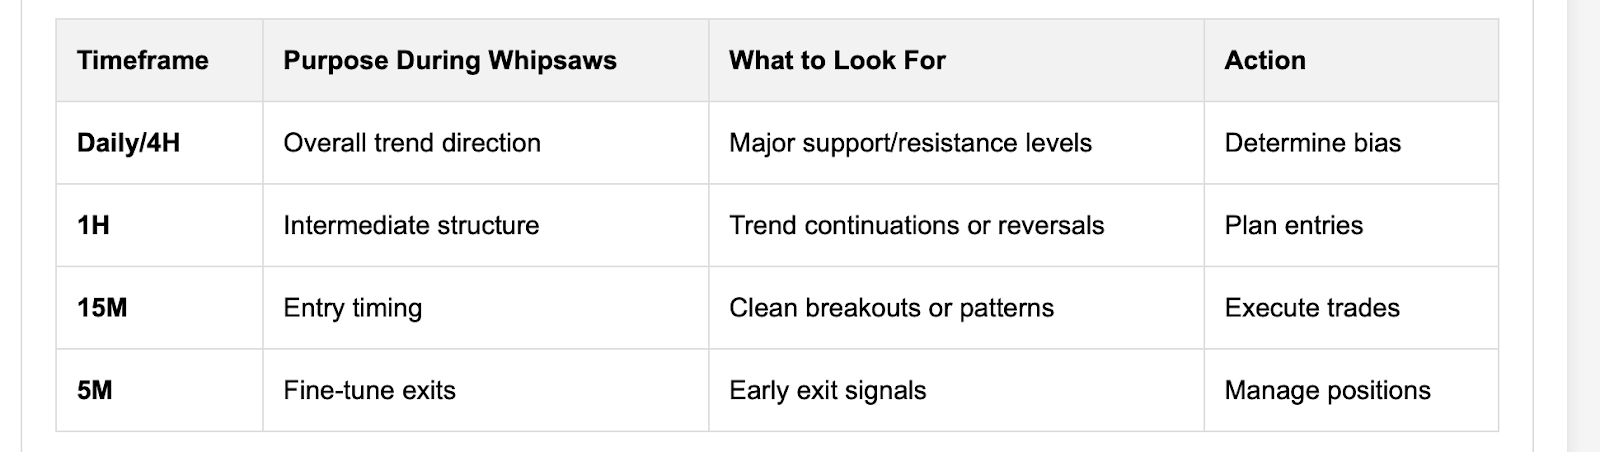
The key concept of trading wedges is mixing a recognized pattern with solid risk management principles. The pattern makes a slight edge, whereas your habits and discipline will help make this pattern work in your favor.
Common Mistakes and False Signals in Wedge Trading
Even the most seasoned traders can become ensnared in the traps of trading wedge patterns. By understanding what to look for here, you can avoid making many costly mistakes in your trading, and become increasingly successful over time.
Confusing wedges with other patterns: The most common mistake is to confuse wedges with triangles or flags. This error stems from the similarity in that they all have trendlines that converge. The main difference is that the trendlines of wedges are sloping in the same direction. A triangle or flag has at least one trendline that is horizontal. Take your time and be absolutely sure that you have correctly identified the pattern before acting upon it in your trading.
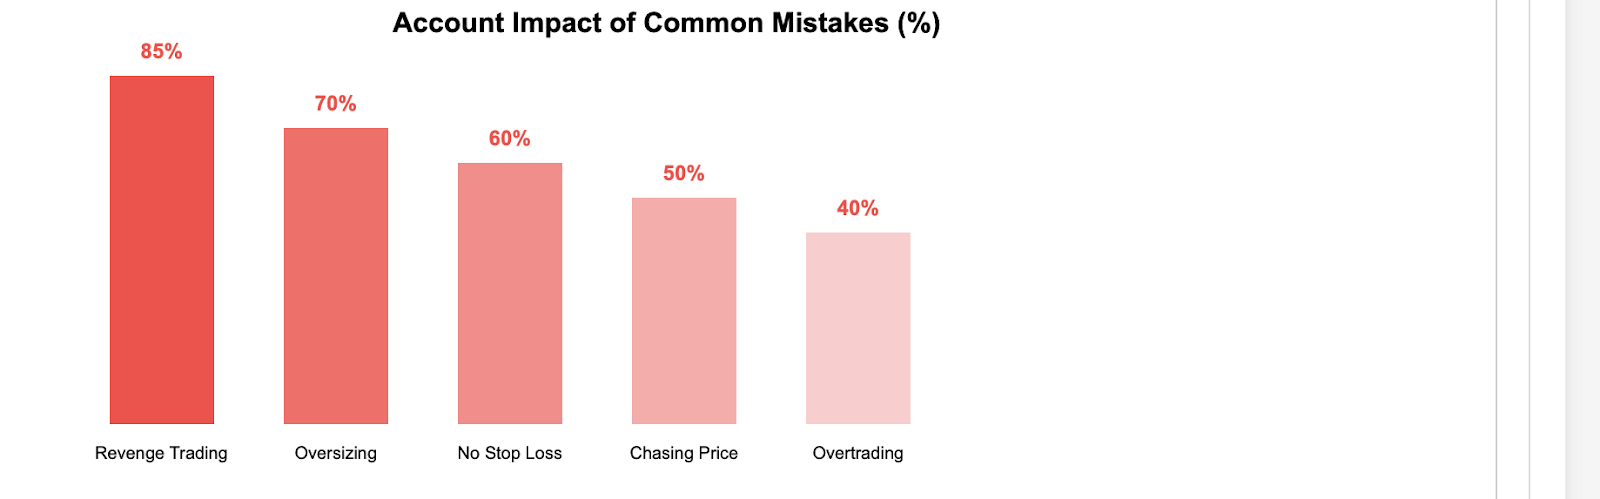
Disregarding the requirement for volume confirmation: If you are taking trades without checking the volume, it would be like trying to judge someone's mood from just their facial expression - you are neglecting to listen to what the person is saying, thus you are missing a significant portion of the picture.
Relying solely on the price movement is only half the story. Relying on price movement is like the breaking of a wave; real breakouts usually bring volume with them, while false breakouts do not. Lesson learned the hard way during the XAUUSD (gold) wedge formations for early entries, based on price movement alone, before volume confirmation, which resulted in early stops upon the price action.
Trading Without Extra Confirmation: It can be quite problematic to rely entirely on wedge shapes without corroborating it with other indicators. Elements like MACD divergence, RSI readings, or support/resistance areas can give you valuable additional context. A wedge pattern that lines up with multiple technical indicators confirms far more than a wedge pattern alone.
Getting in Too Early: Another mistake among traders is to get excited about the potential breakout and enter early. Early entries are what can cause some false breakout trades. It is particularly normal to see false breakouts in ranging markets. Be sure to wait for the confirmed close for the wedge to exit the trendline before executing your trade.
Poor Risk Management: Some traders become so engrossed in the wedge shape that they forget to employ proper position sizing and stop-loss orders. A wedge shape does not promise an outcome, and therefore your risk management rules still apply.
Misreading the Context: Trading a wedge shape against the larger trend direction will shorten your odds of success. A rising wedge solely identified in a strong uptrend may just be a little consolidation rather than a reversal. Always trade based upon the bigger picture.
False Breakout Example
The EUR/USD currency pair formed what appeared to be a textbook falling wedge in early 2022. Many traders bought the breakout above the upper trendline, only to see prices reverse quickly back into the pattern. Those traders who waited for confirmation and volume avoided this trap.
The lesson is that patterns can fail. This is why we use stop-losses and never risk more than we can afford to lose on any trade. Successful trading is not about being right all the time; eй is about risk management when you're wrong, and letting your profits run when you're right.
Real-World Case Studies: Wedge Patterns in Forex Markets
Now we will look at some real trades to put wedge patterns to the tests of real market conditions. These examples will provide a illustrative understanding of both the potential and the constraints of wedge trading.
Case Study 1: EUR/USD Rising Wedge (September 2021)
During September 2021, the EUR/USD pair produced a classic rising wedge. This pattern was formed over a three-week period where both highs and lows were increasing but at a diminishing rate. The upper trendline was connected at 1.1908, 1.1884, and 1.1870 while the lower trendline was connected at 1.1664, 1.1750, and 1.1805.
Volume during this pattern was gradually decreasing, from an average of 180,000 contracts per day, down to just 120,000 contracts right before the apex. This declining volume supported and confirmed that buying interest was diminishing as the price was increasing.
The pair confirmed the breakdown on September 28th, closing at 1.1562, decisively below the lower trendline. Those who entered a short position after this confirmed breakdown were already in the money as the pair fell to 1.1525 over the next few trading days.
Entry Point: 1.1560 (after confirmed break below support)
Stop-loss: 1.1620 (above lower wedge boundary)
Target: 1.1460 (measured move based on wedge height of 100 pips)
Result: 65 pips profit in 3 days
Case Study 2: USD/JPY Falling Wedge (March 2022)
In March 2022, USD/JPY developed a falling wedge pattern, following the initial shock associated with global tensions. The falling wedge was constructing in four weeks. There were lower highs at 125.10, 124.50, and 123.80, and lower lows at 121.20, 121.80, and 122.40.
The converging trendlines formed a narrowing range around the price action, squeezing declines in the price action into an increasingly tight version of the channel. On the day of the breakout, the volume was dwindling down on the selling side, so we looked at volume and saw a decline in total volume. A clear decline from 200,000 contracts to 140,000 contracts over the last week.
Then we had a breakout on the 29th after confirming the break above the upper trendline. On a volume surge, we closed the pair at 125.45. A clear buying action took place on this daily bullish, and without showing us an exit, the bullish action bought into the market from retail and institutional traders.
Entry: 125.50 (after confirmed break above resistance)Stop loss: 122.20 (just below the lower wedge boundary)Target: 128.50 (roughly the measured move wedge of 300 pips)Result: Profit of 280 pips over 2 weeks.
Case Study 3: GBP/USD False Breakout (August 2022)
Not every wedge pattern will work out the way we expect. In August 2022, GBP/USD set up what appeared to be a falling wedge with normal converging trendlines and decreasing volume. As the wedge was nearing completion, many traders anticipated a breakout to the upside.
After the initial breakout occurred, it did look convincing. GBP/USD closed above the upper trendline at 1.2180. However, as opposed to continuing higher, the pair reversed the following day, moving back into the range of the wedge pattern. This false breakout took plenty of traders off guard, showcasing the importance of risk management.
Lessons learned:
- Even "perfect" patterns can fail
- Stop-losses are critical to protecting your capital
- The market context is more important than the perfect pattern
- Confirmation of volume helps but does not provide a winner every time
Real-world examples, like these, show wedge patterns can be traded for a profit when trading and managing risk properly. They also confirm that no pattern works one hundred percent of the time. The reason why risk management is the bedrock of successful trading is apparent.
The important thing to remember is that a wedge pattern provides some edge, not a guarantee. When trading a wedge pattern, it can help to use proper entry techniques, a proper stop-loss position, and proper position size.
Overall, wedge patterns can be a very effective weapon in a trader's toolkit.
Key Takeaways and Practical Tips for Wedge Trading
After exploring different approaches to wedge patterns, let's finish with some final considerations for a trader to remember.
The Fundamentals: Rising wedges typically lead to bearish outcomes and falling wedges indicate bullish reversals. This is not absolute, but tendencies. The market is constantly ongoing, so even if it looks "perfect" it could still surprise you.
Do Not Trade Wedges Alone: The best traders that I have met used wedge patterns with additional technical patterns or indicators. Check the MACD for divergence, the RSI for levels of overbought/oversold and check where the support and resistance zones are. When more than one signal is clear, the probabilities of that trade working will improve tremendously!
For New Traders: First, I recommend developing a habit of identifying patterns on a demo account or analyzing historical charts. Do not put real money to risk until you have sufficient experience identifying wedges and typical price movement. The best pairs to practice with will usually be the major pairs, that is EUR/USD, GBP/USD, and USD/JPY. These pairs, when skills are developed, usually develop better patterns with some accountability in the next price movement!
When you start trading wedges, use smaller position sizes. Even when you become confident in your skills of layering the wedge and determining probable price movement - trading live accounts trigger different emotional responses that can erode some judgment.
For advanced traders, here are a few things to keep in mind: Look for wedge confirmation in multiple time frames. A wedge on the 4-hour chart is much more significant if the daily chart is also biased in the same direction. Also, pay attention to the fundamentals that would drive price in the direction of the breakout.
If a wedge breaks out bullishly during a period of extended downtrends, it is likely going to struggle more than a wedge that breaks out in the same direction as the primary trend.
Regardless of how confident you feel about a wedge play, never risk more than you can afford to lose. Just because a wedge might say the odds are in your favor, does not mean every position you take will be successful. Appropriate position size relative to your stop loss distance can help to ensure that one bad trade does not set your account back significantly.
Final thoughts: Wedge patterns are tools to augment your trading tool belt, but they are not crystal balls predicting the future. Wedge patterns work best when combined with well disciplined risk management, additional technical confirmation, and an understanding of market context.
The traders who profited from the wedge pattern were nearly always the traders who were the most patient, disciplined, and realistic about the limitations of the wedge. If you take part in a trade plan using a wedge, then it will give you a greater chance of a profitable outcome over time. Start your journey today!
Disclaimer: The content of the blog does not represent any position of Trade W, does not serve as any trading-related decision advice, and does not endorse any third-party.