

 Trade W

What Is the FT100 Index?
The FT100 is also known as the FTSE 100, which consists of the largest 100 companies listed on the London Stock Exchange and ranked by market capitalization; compiled by FTSE Russell (a division of the London Stock Exchange Group). Although the FT100 is the benchmark index of the UK equity market, its influence goes well beyond that of British markets.
To ascertain how a company becomes part of the prestigious FT100, we must first examine the process by which companies are chosen for the index. The first requirement is that a company must be listed on the London Stock Exchange to qualify for the FT100.
The second requirement is that a company must rank among the top 100 by market capitalization, with the calculation of market capitalization being particularly interesting due to the "free-float" method of determining shares outstanding. The "free-float" methodology removes any shares that are held by government entities or company insiders from the calculation of shares outstanding; thus, it more accurately reflects what the investing public can buy and sell.
There is a common misconception that the FT100 represents the entire UK economy. However, this assumption overlooks one important feature of the index, which is that approximately 75% of the revenues generated by the companies in the FT100 come from outside the UK. Therefore, the performance of the index will often differ from that of the UK economy because of its international revenue base.
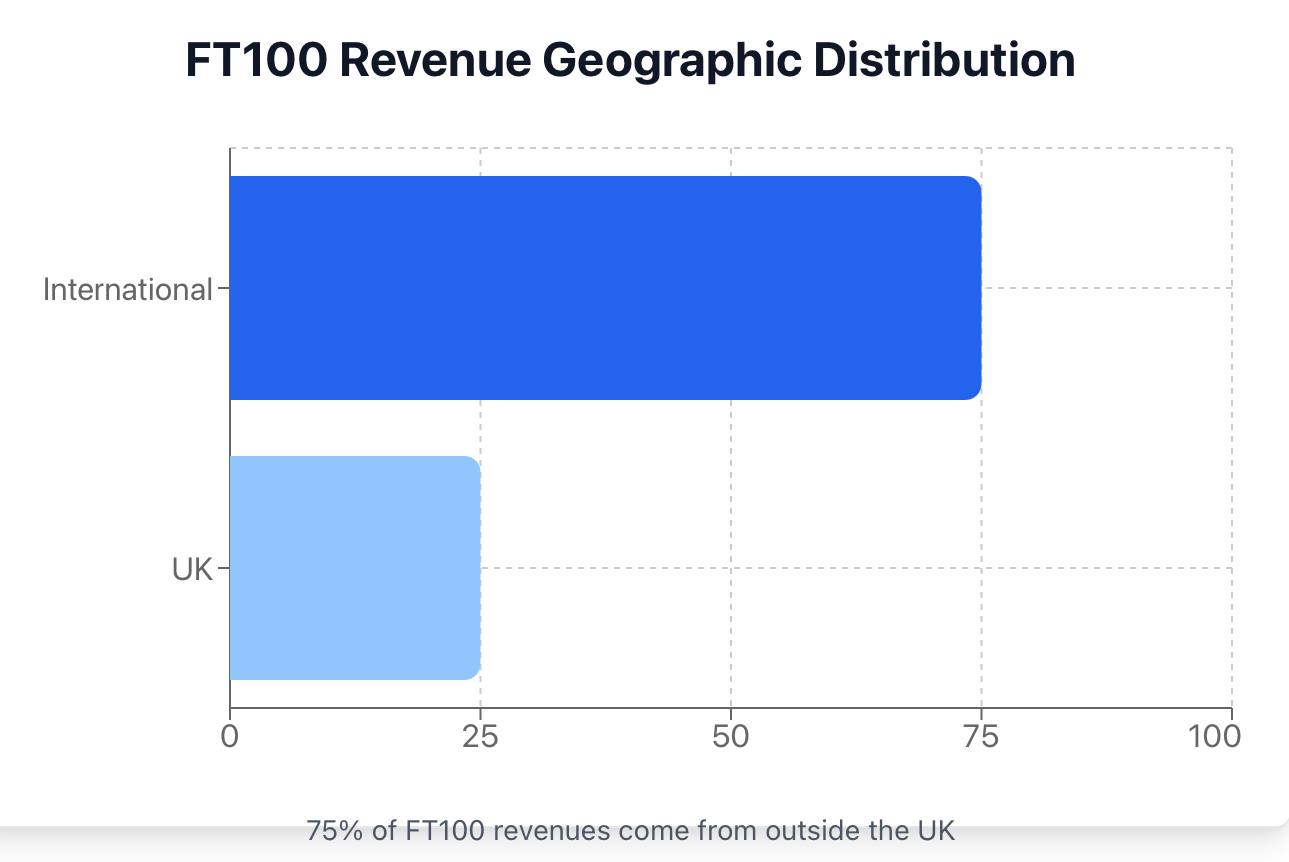
To emphasise this notion, consider major multinational corporations, such as Shell or BP. Although they are both listed on the London Stock Exchange, they produce oil and gas across the globe, sell their products throughout the world and report their earnings in many different currencies. Their financial performance depends to a greater extent upon the state of international energy markets than upon the UK economy. This pattern holds for many companies within the FT100, ranging from the large pharmaceutical companies that produce drugs for global consumption to the consumer products companies that market products across multiple continents.
There are also many differences between the FT100 and other major global indices. The S&P 500, for example, contains a higher proportion of technology-based and growth-oriented companies than does the FT100 and is therefore more weighted toward newer, more dynamic businesses.
In contrast, the companies that comprise the FT100 are predominantly established global players with their primary focus being in the domestic UK economy. Additionally, there are substantial similarities between the FT100 and some European indices, such as the DAX Index in Germany and the CAC 40 in France, but European indices typically rely more heavily than the FT100 on their home country economies.
Unlike many of the other major global indices, the FT100 occupies a unique niche in that it is primarily composed of what may be referred to as "global corporations," rather than serving merely as an indicator of the UK economy. The unique international makeup of the companies within the FTSE 100 index has created some very interesting dynamics which must be considered by investors looking for exposure to these companies.
The Core Composition of FT100: Industry Distribution and Weight Analysis
While the FT100 may not have the most exciting appearance at first glance; however, looking at how it is structured shows ways that it can maintain resilience for the long haul. The way the index is divided into sectors shows that the majority of the companies listed on the FT100 are cash-generating, mature businesses as opposed to high-growth technology companies like those found on other indices.
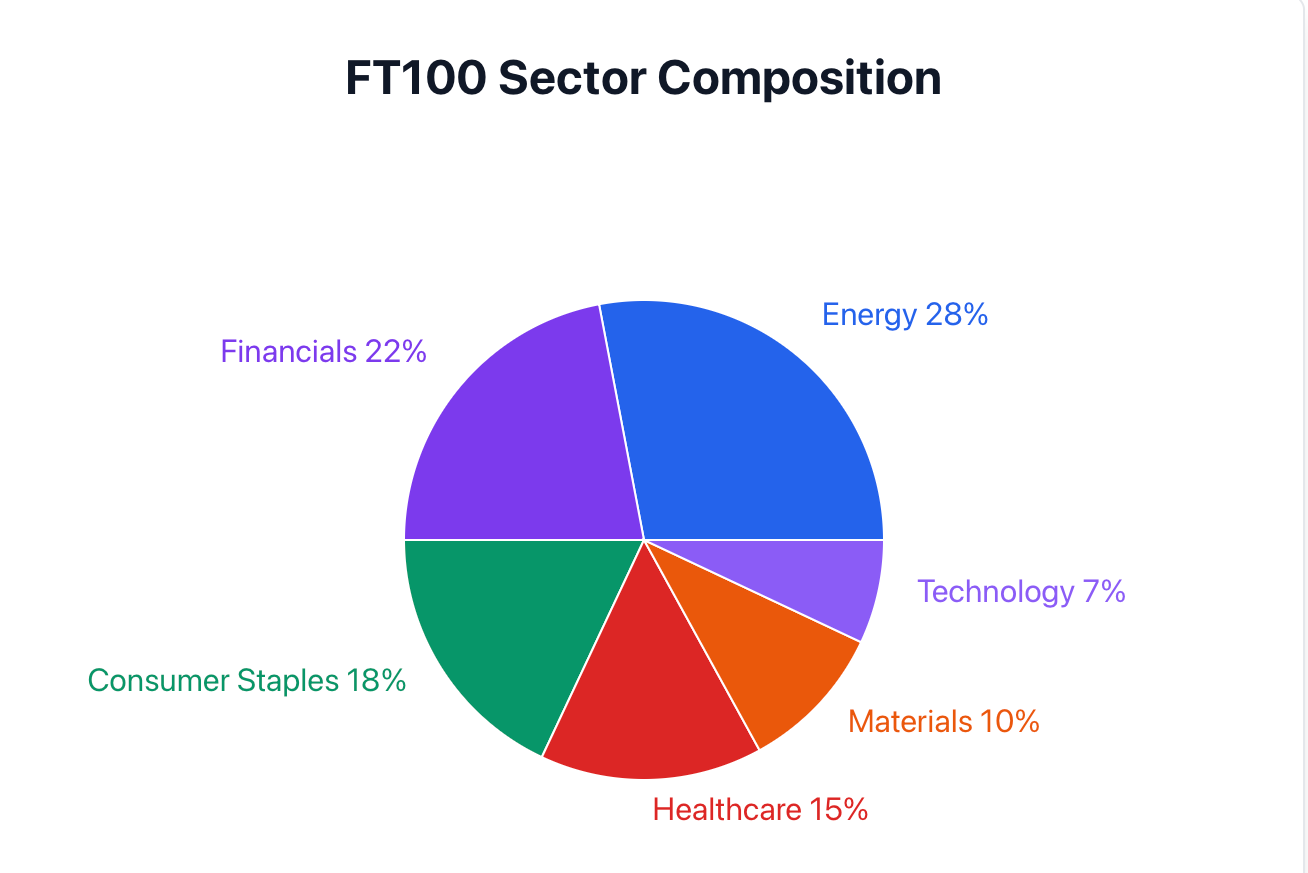
The majority of the FT100 are energy companies that have a strong market presence, including large companies like Shell, BP, and TotalEnergies. Large global energy companies provide products that all countries need, and generate strong cash flow, which pays dividends to shareholders.
Another major component of the FT100 is financial services, i.e. the UK financial services sector is very robust and allows companies to operate globally, including large banks such as HSBC, Barclays, and Lloyds Banking Group, as well as insurance companies such as Aviva and Prudential. These banks and insurance companies typically offer attractive dividend yields for investors.
Another important market component for the FT100 is consumer staples businesses such as Unilever, Diageo, and British American Tobacco, which are essential businesses that tend to remain stable regardless of economic conditions.
Likewise, healthcare and pharmaceutical companies such as GlaxoSmithKline, AstraZeneca, and Haleon provide defence against a downturn in the economy by developing and distributing medicines and health products globally, all of which create predictable revenue streams.
One reason that makes the FT100 unique is its lower weighting in technology than other indices, such as the NASDAQ or S&P 500. This is representative of the UK's historical strengths in manufacturing, and not necessarily an economy focused on technology. Although there are technology companies on the FT100, there are not as many companies represented in this sector as typically found in US-based indices.
Because of the differences in industry structure, there will be differences in terms of volatility and dividends associated with each index. The FT100 has a significant weighting in energy, financials, consumer staples, and healthcare, giving it a more defensive profile and less volatile swings when compared to growth-focused indices. As a result, the majority of companies in these sectors tend to have a reputation for providing strong dividends because they typically return a high percentage of earnings to their shareholders.
The difference between the FT100 and the S&P 500 becomes clear when compared head-to-head. The S&P 500 has a much larger percentage of the index allocated to technology companies, allowing for significantly more growth but higher volatility. The value orientation of the FT100 allows it to underperform during technology booms, but to hold up much better during downturns in the market.
Think of the FT100 as a club of established, mature enterprises with global operations and stable cash flows, rather than as an index of high-growth start-up companies. This makes it ideal for investors who are more interested in income and capital preservation rather than rapid expansion.
Historical Performance of FT100: Long-Term Returns, Volatility, and Drawdowns
Analysing the historical performance of the FTSE 100 can help to understand the risk/reward profile of the FTSE 100 Index.
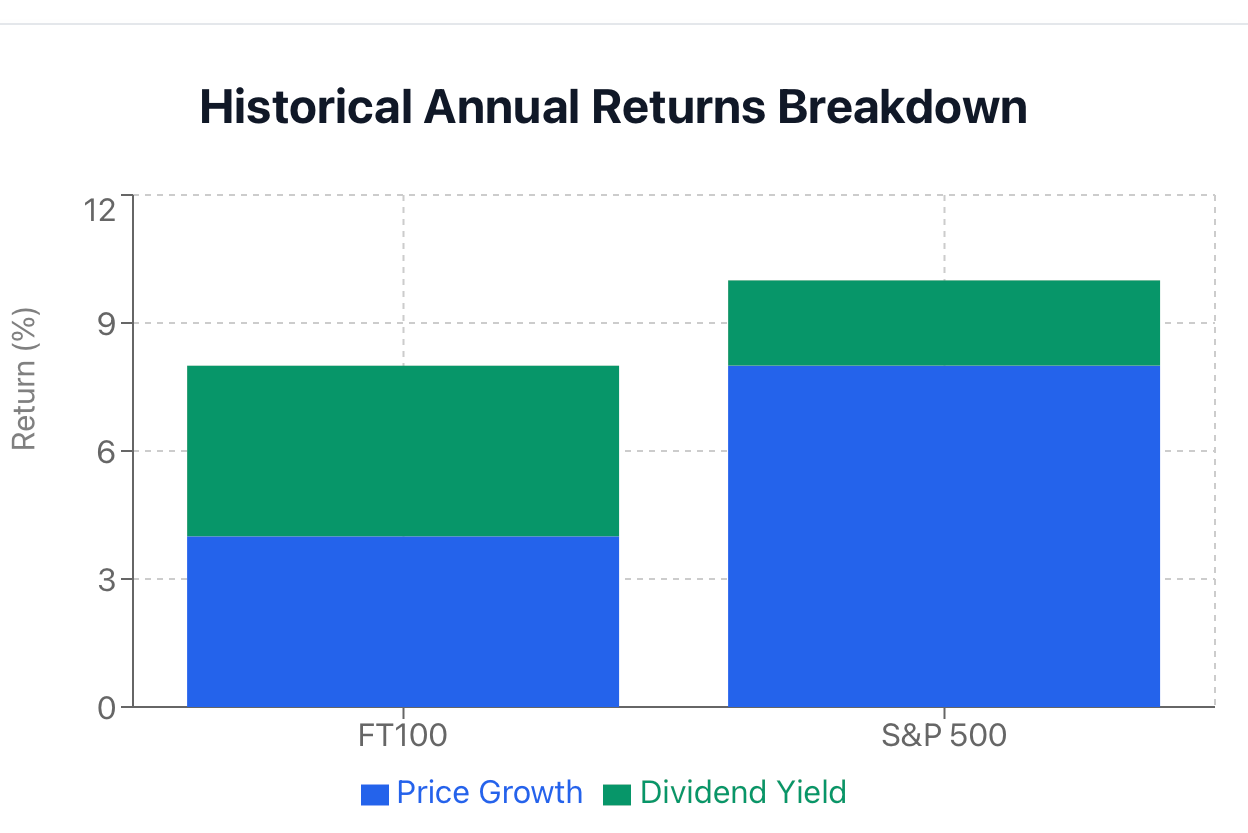
Historically, the FTSE 100 Index's annualised returns were moderate, averaging approximately 7 to 9% annually, including dividends; however, these returns differed based on different measurement periods.
Unlike most other indices, dividends significantly contribute to the FTSE 100 Index's performance, while price growth has a lesser impact on the FTSE 100 Index compared with most well-known indices. Compared to the S&P 500 Index, the FTSE 100 Index offered higher dividend yields historically, with the FTSE 100 Index typically yielding dividend rates of approximately 3% to 5%, whereas the S&P 500 Index is generally yielding approximately 1% to 2%.
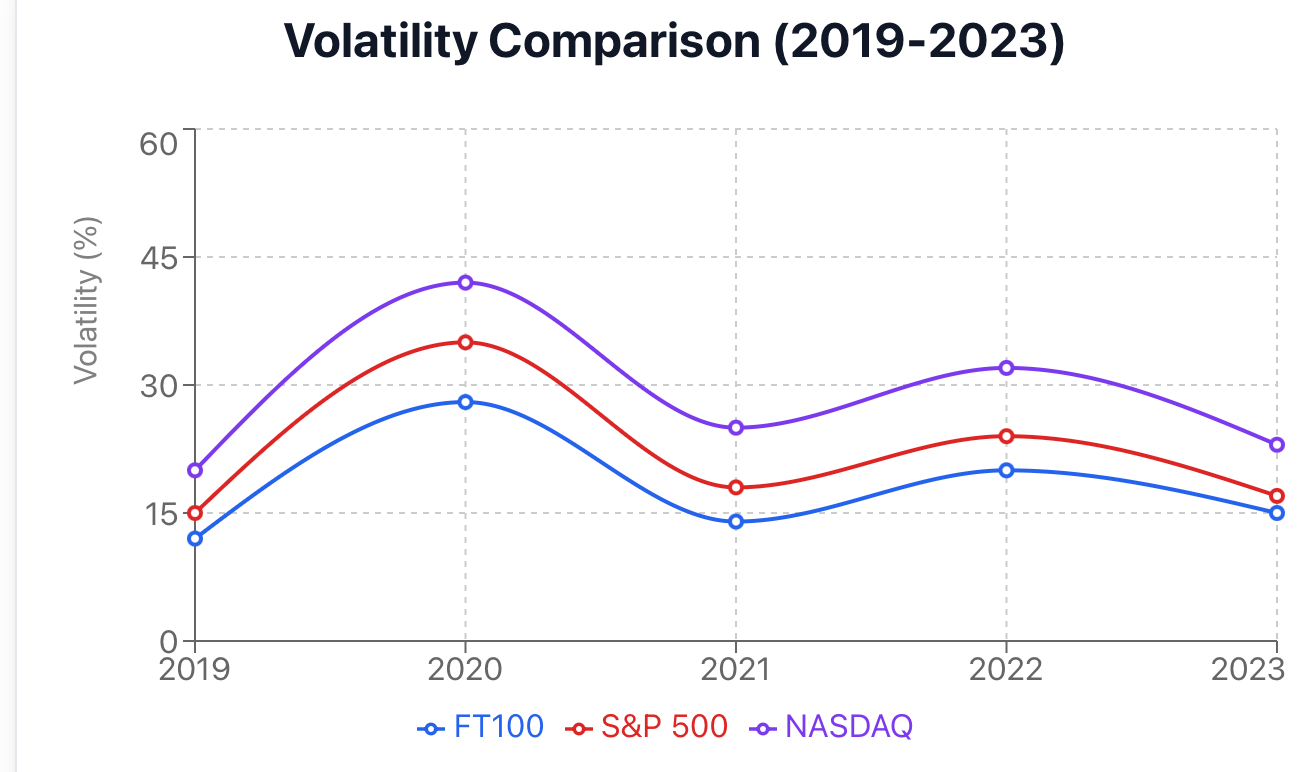
In terms of volatility characteristics, the FTSE 100 Index typically experiences moderately sized price swings; therefore, investors may expect the FTSE 100 Index to have more price swings than defensive Benchmarks, but the FTSE 100 Index will typically have lower price volatility than a Growth index. The FTSE 100 Index has remained relatively resilient during periods of market stress, yet sustained noticeable drawdowns during periods of price volatility.
The maximum drawdown of an index refers to the largest peak-to-trough price drop the index experiences over a specific period of time, and has been over 50% for the FTSE 100 Index during the greatest market crises. For example, the FTSE 100 Index peaked at a price of approximately £6691.70, which had maximum drawdowns of approximately £3,276 or just under 47% from peak-to-trough price levels. The Dot-com Bubble caused a drop of approximately £4,000 or 52%.
During periods of inflation, the FTSE 100 Index has performed well in the past. As with many other Dow Jones Industrial Average companies, the FTSE 100 Index contains high concentrations of Energy, Materials and Financials; when a crisis arose, these industries would typically offset increased production costs due to inflation. Historically, many of the FTSE 100 Index companies within these asset classes would pass this price increase on to consumers and benefit from inflation.
The dividend reinvestment option from the FTSE 100 Index generates strong returns for long-term investors, which have historically shown that dividend income and reinvestment can generate 50% or more of the total returns that investors could expect through compounding over a length of time. This means that the FTSE 100 Index is suitable for investors who want dividends and for those who will be reinvesting those dividends to build wealth through the compounding effect.
To illustrate the dividend income and reinvestment effects on the FTSE 100 Index's performance, consider that two investors invested £10,000 in the FTSE 100 Index for 20 years; however, investor one took cash dividends, while investor two reinvested dividends. Based upon the length of time investor two reinvested dividends, investor two would typically accumulate double the cash wealth of investor one.
To help new investors visualise the dividend income and reinvestment concept, consider purchasing a rental property. Each month, you are paid rent (which would be thought of as a monthly 'dividend income') generated from that property, and you would expect that your rental property will increase in value (capital growth). The FTSE 100 Index could be viewed in the same light; when companies pay dividends to their shareholders, part of that company's profits provides the opportunity for appreciation over time.
Because of the FTSE 100 Index's dividend-reinvested return profile, the FTSE 100 Index could be advantageous for an income-focused investor seeking an entry point into the stock market, given the uncertainty surrounding stock market performance. Long-term investors could expect more predictable returns for periods of unknown returns in the stock market over an extended timeframe.
FT100 in the 2026 Macro Environment: Inflation, Interest Rates, and Geopolitics
The FT100 has gained renewed global capital interest for a variety of reasons, including changes in the macroeconomic environment in 2026, as well as the change in the global interest rate environment since 2021, with central banks around the world tightening monetary policies in response to inflationary pressures. This change in interest rates has negatively affected growth stocks because growth stocks are very sensitive to a higher discount rate. Conversely, growth in the FT100 index value indices, should be positively impacted by the rise in interest rates.
The majority of companies in the FT100 focus on value-based investing. Value stocks have historically outperformed growth-oriented stocks during periods of rising interest rates; value stocks have a clear business model, generate predictable cash flows, and, typically, pay dividends. As such, the present value of future cash flows from value stocks is less sensitive to interest rates than the future cash flows of growth companies, which have forecasts that extend further into the future.
The sector composition of the FT100 provides unique advantages during inflationary times. For instance, at this point, companies dealing in energy commodities benefit from higher commodity prices due to the inflationary environment. Financial services firms also benefit from improved profitability through better net interest margins. Consumer staples are often considered essential goods and, as such, have frequently passed cost increases to consumers via pricing modifications due to their necessity.
Geopolitical risk has increased significantly over the last few years, especially as a result of trade tensions, supply chain interruptions, and conflicts around the globe. Under those conditions, value stocks in the FT100 have become increasingly attractive because of their defensive characteristics. Many constituent companies in the FT100 are multinational companies with diversified geographic exposure; therefore, they rely less on any one country's government or political system for value.
The ongoing discussions regarding "de-globalisation" versus "re-globalisation" are another matter impacting the FT100. The world has continued to evolve from a supply-chain model to a more localised model for many established industries. At the same time, many companies in the FT100 continue to operate on a global scale, generating value and equity from the various geographic areas in which they operate. Therefore, the multi-regional presence of many of the companies within the FT100 provides a potential offset to the risk posed by events occurring within a particular country.
The FT100 has consistently outperformed growth-oriented indices during periods of increased interest rates. In both of the previous rate-hike cycles (early 2000s and mid-2010s), the FT100 produced significantly greater investment returns than did the technology-focused growth-oriented indices.
A key analogy for beginners to understand why "stable companies" tend to perform better than other types of companies during economic downturns is to visualise the constituents within the FT100 as large, pre-established cargo ships captained by seasoned maritime professionals. Although such ships may not be the fastest vessels available on the water, their experienced captains can navigate through turbulent high seas. In addition, the size, ballast (dividends), and overall experience of these vessels will enable them to stay afloat, while smaller and faster boats may struggle to survive.
In summary, value-focused companies located in the FT100 are attractive investment options due to their international diversification and potential for capital appreciation, and will benefit from the current macroeconomic environment throughout 2026.
The "Mirror Effect" Between the Pound and FT100: How to Trade UK Equities Using Currency Movements
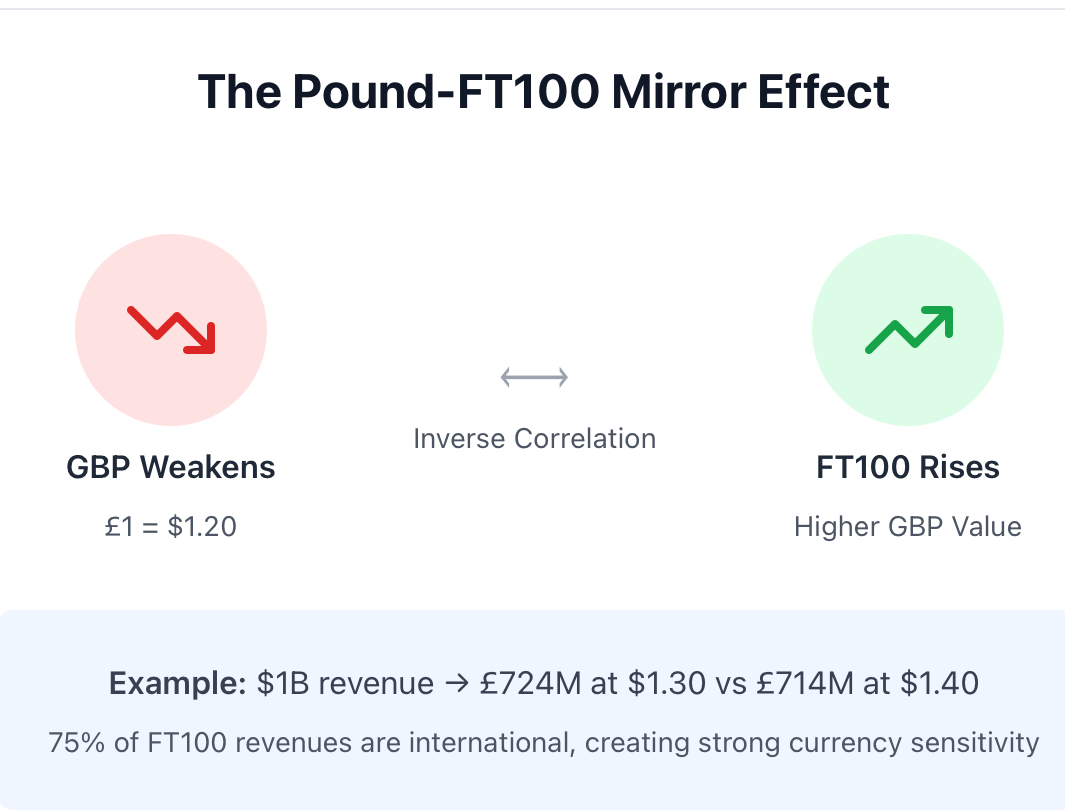
An interesting and often overlooked feature of the FT100 Index is the way that it moves in relation to the British Pound Sterling (GBP). This relationship, known as the "mirror effect", produces a negative correlation between the value of the GBP and the performance of the FT100 Index.
When the GBP is weak compared to other currencies, the revenue (or profit) of most FT100 companies will be converted back into a greater GBP amount. Conversely, when the GBP is strong, the revenue of FT100 companies will be converted back into a smaller GBP amount. These two factors create the inverse relationship of the FT100 Index rising when the GBP falls and vice versa.
To illustrate how the mirror effect works, consider an FT100 Index company that earns $1 billion in the US. If the exchange rate increases from $1.30 to $1.40, the £724 million from that dollar revenue will increase by £20 million even if their revenue hasn’t changed. This will create a larger financial statement for the FT100 company and, therefore, may increase the FT100 Index.
While many global indices include multinationals, few have as strong a negative correlation with their host country currency as the FT100 has to the GBP. For investors who understand how both the forex and equity markets work, this relationship can create many interesting trading opportunities. Typically, traders will take opposing views on the GBP/USD currency pair and the FT100 Index, or may use the currency fluctuations as a leading indicator for potential FT100 Index movements.
As shown in the examples above, this phenomenon has been clearly illustrated throughout history; for example, in the wake of the June 2016 Brexit vote, the GBP was devalued and, as a result, many FT100 companies’ profits increased as they were now reporting profits in GBP based on conversion from dollars or euros! We have also seen similar occurrences during large market fluctuations in the GBP during the financial crisis of 2008 and various UK political situations.
To break this down for beginners, let’s say that you own a global company that earns revenues in euros but reports profits in GBP. If the GBP were to weaken, the euro earnings would be worth more GBP than if nothing had changed; therefore, the company would appear more profitable than it truly is. That is similar to what happens to many FT100 companies and the GBP when fluctuations occur in the GBP.
Because the FT100 is sensitive to exchange rates, it is one of the few global indices that would be considered an "exchange-rate-sensitive index". Being classified as an exchange-rate-sensitive index adds an analytical layer for investors or traders to look at, allowing them to connect forex markets to equity markets, thus creating many unique trading opportunities and risks.
High-Dividend Strategy: Why FT100 Is a "Safe Harbour" for Defensive Portfolios in 2026
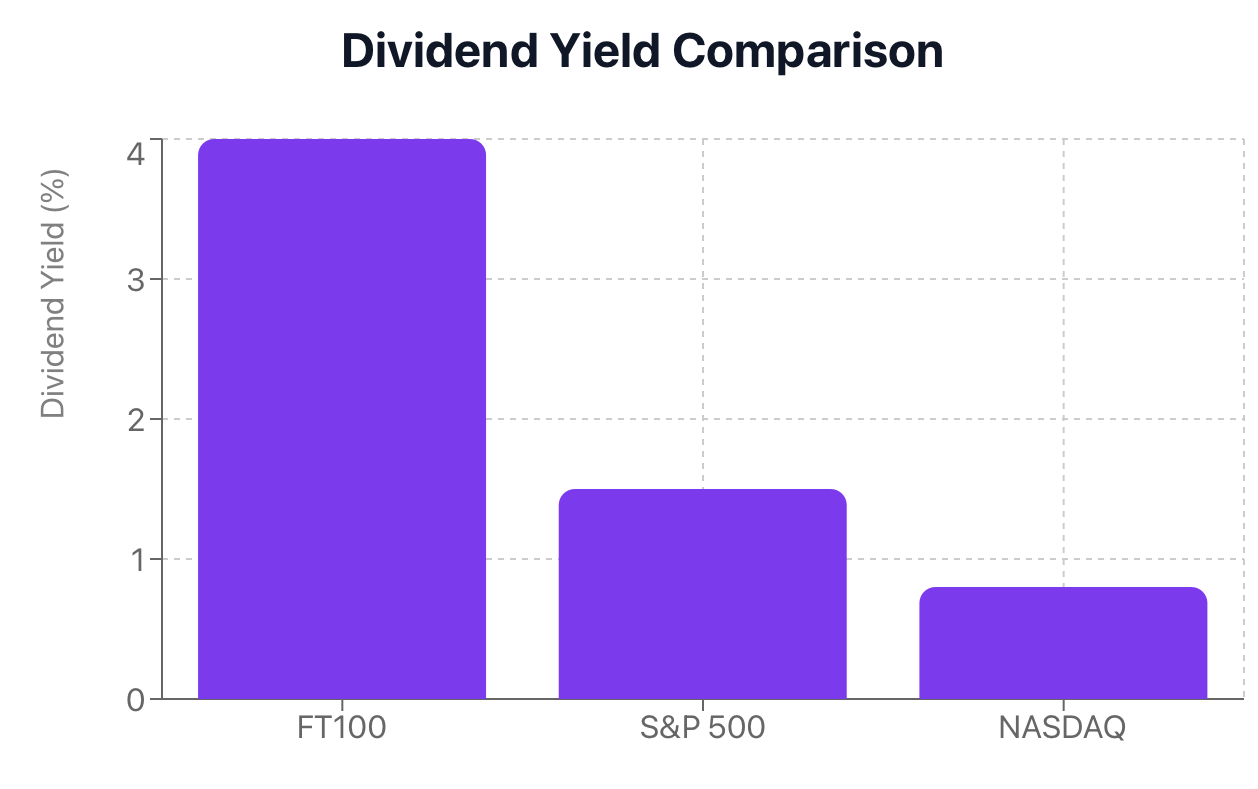
As the economy becomes more unstable, defensive portfolios are looking to the FT100 as a "safe haven" in a highly volatile market environment. Defensive portfolios are becoming increasingly popular with dividend-focused investors. The FT100 offers a substantial return on investment in terms of dividend yield (generally between 3%-5% versus many of the major global equity markets that have a significantly reduced dividend yield), primarily due to the mature state of the FT100's constituent companies, the UK corporate governance traditions that allow for greater focus on shareholder returns, and the FT100's sector composition.
The deep-rooted dividend culture of many FT100 companies and their history of paying dividends regularly for decades creates reliability for investors interested in income and gives a strong indication that the management of these companies has confidence in their cash flows going forward.
The maturity of the companies that comprise the FT100 has a significant impact on their dividend profile. Growth companies reinvest nearly all of their earnings into the continued growth of their company, whereas companies in the FT100 typically operate in mature industries with few high returns on investment opportunities. Therefore, instead of investing their excess capital, they return it to their shareholders through dividends.
The yield disparity between US equity indices and the FT100 demonstrates the impact of each country's corporate governance, market expectations, and sector composition. When comparing the FT100 to the S&P500, for example, the FT100 offers almost twice the yield of the S&P500 (around 1%-2%) typically. Therefore, dividend value expectations will often be significantly different in the two countries.
During periods of instability in equity markets, dividends provide investors with both psychological and practical value. The psychological benefit for investors is the assurance they receive from continuing to receive dividends at regularly scheduled payment dates, reminding them that their underlying businesses continue to generate cash even when their market price has declined. From a practical standpoint, dividends serve to create a return floor, allowing investors to offset price declines, thus reducing portfolio volatility.
The historical performance of high-dividend-producing indices demonstrates their continued resilience and relative stability during periods of short-term fluctuations in the equity market. The income produced from high-dividend-producing stocks continues to provide stability for investors in high-dividend-paying companies and provides these companies with a better financial position compared to non-dividend-paying companies during periods of economic disruption.
For those relatively new to investing, it may be easier to think of dividends as “interest on stocks”. Just as bank savings accounts earn interest based on the market interest rate, dividend-paying stocks will continue to pay regular cash dividends based on the company’s cash flow performance; therefore, the income from dividends will provide a continual source of income (especially during retirement). This income stream may become especially beneficial to investors looking for consistent cash flow during retirement.
Given the above economic conditions, the unique combination of reliable income, potential appreciation of capital, and defensive characteristics on this index makes the FT100 an attractive alternative for investors looking for a stable investment in today’s uncertain market environment.
Value Opportunity or Value Trap? FT100 Valuation Analysis and Return Forecast for 2026
To assess if there is a possibility that the FT100 provides an opportunity, you must first evaluate the historical and future valuations, then compare these to today's valuations. The question we will be answering through the use of metrics is "Is current pricing on the FT100 too high?" The FT100 has historically remained at a low price-to-earnings (P/E) of around 12 - 15 times Earnings and also price-to-book (P/B) ratios averaging from 1.3 - 1.8. When you compare those averages with many of the global indices, particularly the S&P 500, where multiples typically exceed ratios of 20-25 times, FT100's relative pricing appears to be very reasonable.
By examining current values as a percentage of historical Percentiles, the FT100 appears to be fairly valued when compared to itself over time. In fact, during times of extreme optimism, the FT100 has been valued higher than it is today. Thus, based on the information available, it could be concluded that the FT100 may be considered to be undervalued, depending upon which time period is used for comparison.
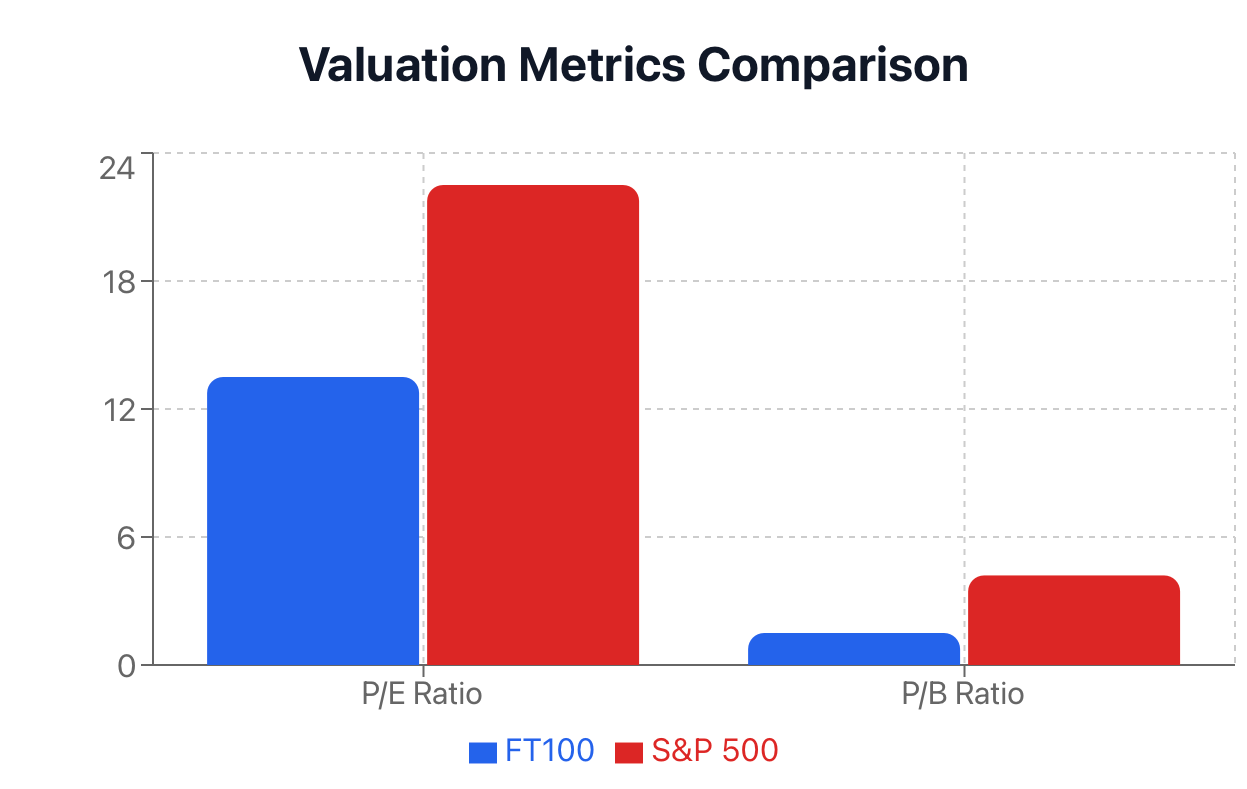
In addition to providing relative value when compared to other markets, Valuations can also be used to show the FT100's relative attractiveness over time. Many investors call it the "UK discount." The FT100 can typically be purchased at a relative discount compared to other major countries due to several factors, including the continued uncertainty regarding Brexit, the lower anticipated Growth Rates compared to other major Global Economies and the differing Sector Composition of the UK Economy.
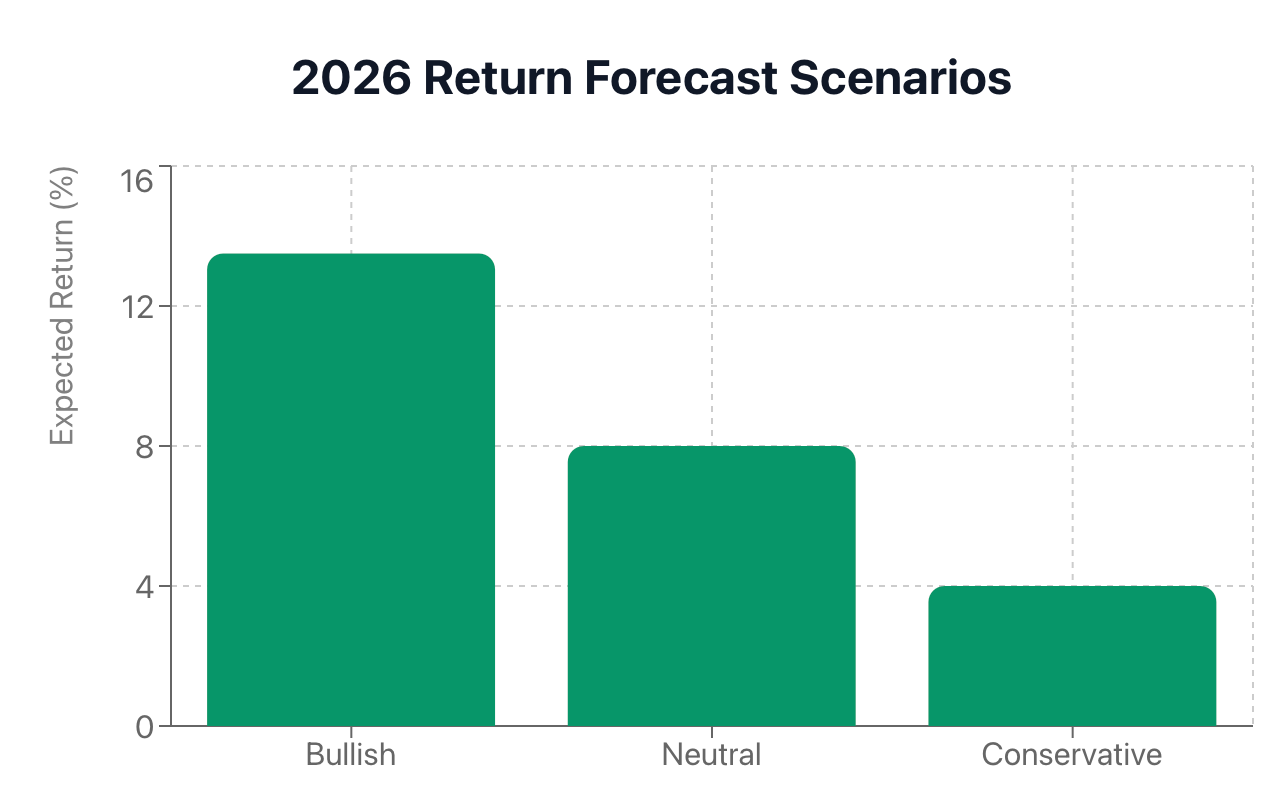
Projecting into 2026 is a challenge because of the immense variety of potential economic scenarios that could unfold. Under a "Bullish" scenario, continued recovery of the Global Economy, stable pricing levels of basic commodities, and declining Inflation rates, would cause companies operating in the FT100 to produce increased levels of profits. In addition, there would be further growth in multiples, as investors come to recognise the FT100 for what it has to offer. The combination of these circumstances would generate a total return of between 12-15% in 2026.
Under a "Neutral" scenario, where moderate Economic Growth takes place, Inflation rates remain stable, and valuations remain relatively unchanged, the FT100 would provide returns between 7-9%, primarily driven by the dividend component of the total return and modestly growing profit margins.
Under a "Conservative" scenario, where Geopolitical concerns continue to rise, Interest rates continue to move higher, and Economic Growth rates stall, the FT100 would likely continue to deliver a minimum total return of 3-5%. While there would be potential negative capital growth, the high dividend yield would help offset much of that loss.
Several historical examples of marketplace rallies caused by Valuation-Retracement can serve as proof in support of the theory of valuation-restorative rally. These periods are characterised by significant Discount to Global Equity Markets, which resulted in Capital being redirected back towards UK equities when the valuations returned to their Historical Average.
To help beginners better understand how to evaluate stocks, a shopping analogy is often used. Buying shares of stock is similar to purchasing items from a store. In the same way that an item may be popular and thus become overpriced, another item may not be as desirable, yet still offer a much better value. The FT100 is being evaluated in this Example, where available quality stocks are being sold at discounted prices.
How Can Retail Investors Access FT100? ETFs, CFDs, and Key Differences
As a retail investor looking for exposure to the FT100, there are various types of investment vehicles with many differences between them based on risk tolerance and investment strategy. This article will explain some of the different ways to gain FT100 exposure through exchange-traded funds (ETFs) and contracts for difference (CFDs).
An FT100 ETF allows an investor to invest in the FT100 Index without needing to purchase shares of all or most of the individual stocks in the index. Instead, ETFs track the performance of the FT100 Index through the purchase of shares of the 100 companies, or a selection of them, that make up the FT100 Index. ETFs trade on stock exchanges just like individual companies' shares, so they offer liquidity, transparency, and up-to-date pricing throughout regular trading hours.
There are many advantages associated with FT100 ETFs:
-
Investors gain diversification by pooling their investments into 100 companies.
-
ETFs have lower expense ratios than actively managed funds.
-
Dividends can be paid either as cash or reinvested back into the fund.
In addition, many jurisdictions provide tax advantages to an ETF structure.
For long-term investors, ETFs are an appealing investment option. Long-term holders of ETFs have the potential to receive both dividends through shares held in the fund and an increase in value of the ETF shares from the reinvested dividends. Therefore, this buy-and-hold investment strategy is designed for long-term holders, with the underlying holdings of FT100 ETFs representing well-established companies that regularly pay dividends.
CFDs present a different way to invest in the FT100 Index. While an ETF represents a claim of ownership of underlying assets (i.e., the 100 largest UK companies), CFDs represent a type of contract that allows the trader to speculate on the price movement of an asset without ownership of the underlying asset. Through the use of leverage, CFDs also allow traders to trade on a much larger position compared to what could normally be funded with capital.
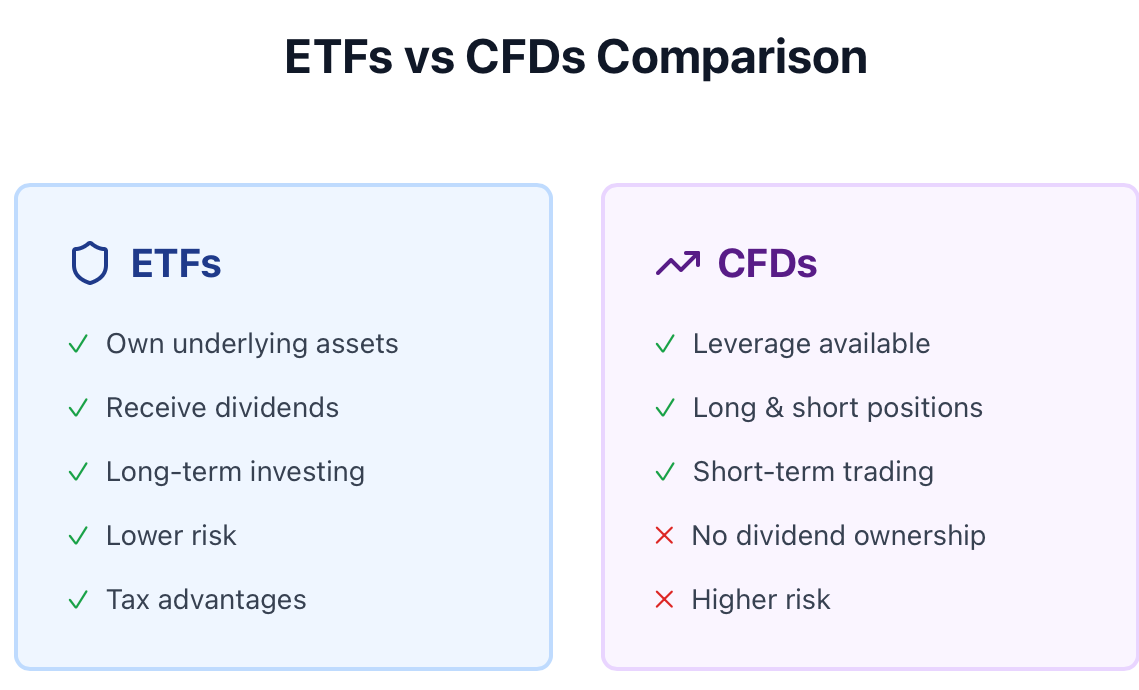
CFDs typically appeal to short-term traders or to traders who utilise a more actively managed trading strategy, as CFDs enable the trader to take both long and short positions on the FT100 Index. As a result, a trader can profit from both an upward-trending and a downward-trending market using CFDs. The inherent flexibility of CFDs provides solutions for day trading, swing trading, and hedging.
However, when trading CFDs, the trader assumes significant risks in connection with the use of leverage. While CFDs carry the risk of total loss of a trader's investment, they may also be subject to daily/overnight financing charges, which diminish the potential for long-term wealth creation through the use of leverage. Moreover, because the trader holds the CFD position and does not own the underlying asset, they do not receive dividends payable to stockholders.
To illustrate for the beginner investor who does not understand the differences between ETFs and CFDs, consider the following analogy: When purchasing an ETF, the trader is the "owner" of a basket of all or a sampling of the shares of the 100 different companies that comprise the FT100 Index. Therefore, the trader is entitled to receive any dividends generated by their ownership. Conversely, by purchasing a CFD, the trader has effectively contracted to buy or sell an amount of money equivalent to the value of the underlying asset (in this case, shares). The underlying shares are never owned.
The investor's specific investment objective will dictate which investment vehicle to utilise. Generally, ETFs are better for passive investors who expect to receive dividends over time and are planning for long-term capital appreciation; CFDs are generally better for active traders looking to capitalize on short-term price movements through the use of leverage. Additionally, many investors use both ETFs and CFDs for various investment strategies by holding long-term shares of ETFs while trading CFDs for short-term opportunities.
Regardless of the method of investment, all investors need to understand the characteristics of the FT100 Index and the related costs and risks associated with investing in FT100. Different investment vehicle selections will result in varying levels of risk exposure; therefore, typically passive long-term investors will have less risk with the use of ETFs, while the vast majority of the potential reward is available for active traders pursuing short-term positions with CFDs.
Risks and Limitations of FT100: Potential Issues You Must Know
While the FT100 has several advantages, as outlined in the table of contents, investors must be aware of the investment risks and limitations associated with the FT100 to maintain their expectations for realistic returns. As with any investment, the FT100 carries risks and limitations.
One of the major concerns regarding investing in the FT100 is that it has more limited growth potential when compared with other, technology-based indices. The FT100's structure is largely dominated by large, developed dividend-paying firms that mostly operate in traditional mature industries, whereas the other indices listed above will likely include more innovative, high-growth firms. In fact, the FT100 would likely trail behind all growth-driven indices during periods of time in which growth generates the majority of the total return experienced in all markets.
Another limitation is Industry Concentration Risk. The FT100 leans more heavily than average toward the Energy, Financials, and Consumer Staples industries. Historically, industry concentration has served as a defensive mechanism for the FT100 in regard to capital appreciation, but it creates an exposure to the possibility of significant market declines from these industries if they perform poorly for prolonged periods of time. For example, if the price of oil and gas were to experience a prolonged decline in price, the FT100 would experience much more of an effect than the majority of other indices, based on its very large exposure to Energy.
The FT100 is generally viewed favorably by investors because most companies within the index correlate closely with the strengthening of the pound, but it does not come without some degree of risk of experiencing significant declines from its constituent companies that generate a high level of their revenue from outside the UK.
If the pound were to increase dramatically in value, many of the companies within the FT100 that generate significant portions of their revenues from foreign sources would experience a reduction in reported income, priced in pounds, and thus would expose investors to additional risk of currency volatility.
The FT100 is also subject to continual changes in governmental policies and regulations that will affect the index. Many of the companies within the FT100 are in the financial services sector and are experiencing a major change in their business models due to regulatory reform. Energy firms, on the other hand, are experiencing huge changes in their business models related to changing environmental policies and transition risks with changing regulatory frameworks. Any regulatory uncertainty affects the profitability of FT100 companies largely and subsequently creates risk for investors.
A substantial segment of the FT100's companies conduct business globally; however, their UK domicile exposes them to the risks associated with the UK political environment. An effective example of how political instability affects both market sentiment and company performance is the UK Brexit Vote. Political decisions can lead to ongoing volatility in the FT100.
You must review certain historical time periods in which the FT100 has underperformed compared to sector leaders, namely the late 1990s technology boom and the technology-driven bull market up until the time of writing. The performance of the FT100 relative to these two indices has clearly demonstrated that, over time, shifts in the way that markets behave have increasingly moved away from value and income-producing characteristics of companies included in the FT100.
It is essential to keep in mind that defensive investing does not equate to having no risks associated with an investment. The FT100 has sustained significant drawdown periods during major market corrections (please refer to the Financial Crisis of 2008 and COVID-19), so while the FT100 may exhibit a quicker recovery time, it is not immune to the volatility of the overall market.
Investor awareness of risk does not negate the benefits of investing in the FT100; rather, it allows for appropriate risk when included in a broad, diversified portfolio. While the FT100 can serve as an income-producing and stable core holding, it is important to supplement it with other investments to mitigate its inherent limitations.
Conclusion & CTA: How to Trade FT100 on Tradewill?
A distinct combination of value characteristics, global exposure and dividend income separates FT100 from other global indices. FT100 provides stability in uncertain markets but still offers the opportunity for capital appreciation through its portfolio of mature, cash-generating global businesses.
Investor types most suited to FT100 are income generation, capital preservation and moderate growth investors. Also, FT100 attracts conservative investors, retirees and international portfolio diversifiers seeking a remedy to the US-centric portfolio allocation. The defensive characteristics of the FT100 make it a valuable addition to investors' portfolios during periods of volatility in the financial markets and economic instability.
Have you decided to be part of FT100? Tradewill provides numerous ways for you to participate in FT100. On our platform, investors can buy FT100 ETFs for long-term exposure or trade FT100 CFDs for short-term trading. Our easy-to-use platform provides real-time market data, research tools and competitive pricing.
It's crucial to understand that all investment products have associated risks. Past performance does not guarantee future outcomes. The FT100 may be subject to increased volatility. As always, a thorough evaluation of your individual circumstances, including your risk tolerance and investment objectives, is necessary before the deployment of capital. In addition to the above, diversification is one of the most important rules of investing.
Are you excited about exploring FT100 opportunities? If so, create your Tradewill account today to access real-time market data and continue your investment journey. Our comprehensive education and caring customer support teams are ready to help you navigate the financial markets with confidence.
With FT100 trading through the Tradewill platform, you can gain access to global dividend income. You can gain UK market access today at competitive spreads with the help of our comprehensive research tools.
Disclaimer: The content of the blog does not represent any position of Trade W, does not serve as any trading-related decision advice, and does not endorse any third-party.