

 Trade W

Why GDP by country 2025 matters for traders
The GDP, or Gross Domestic Product, is an indicator of the total monetary value of all the goods and services produced by a nation within a year. The GDP is the most cited macroeconomic variable globally and can be an excellent indicator to guide traders on their trades when trading FX, indices, and CFDs. In 2025, the GDP ranking will have significant implications for any trader.
As you participate in global trading, it is essential to be aware of two forms of GDP. The former is the nominal GDP–it gives a snapshot of a country's relative size based upon current U.S. dollar comparisons between nations. The latter is the real GDP, which factors in inflation and provides an accurate depiction of a country's rate of actual growth based on purchasing power.
While nominal GDP is the form of GDP that is primarily used in global GDP rankings, the changes in the value of a currency will create a moving target concerning the relative size of a country from one year to the next.
Central banks use GDP numbers as part of their decision-making process, and these are new pieces of information that affect the intensity of currency and capital flows and equity market trends.
For example, a country that is growing at a rate greater than expected will attract foreign investment, while a country that underperforms will experience a decline in its currency and underperform in its equity index. This is the relationship between global macroeconomic data and the trades you make on a daily basis.
The full 2025 global GDP rankings
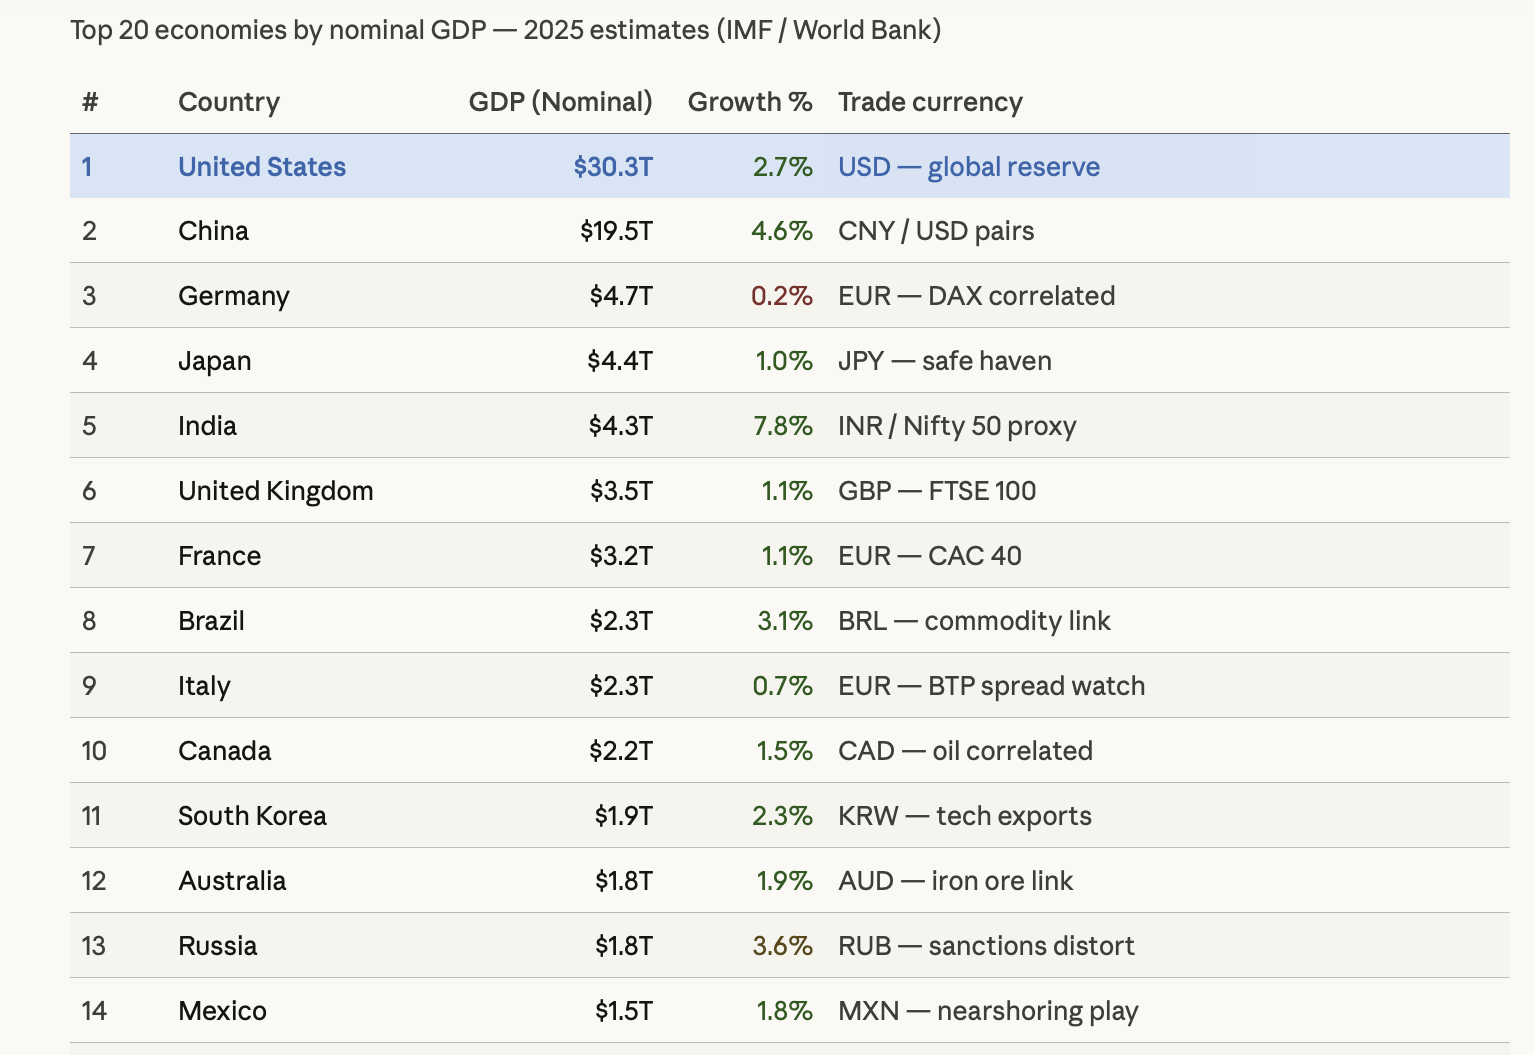
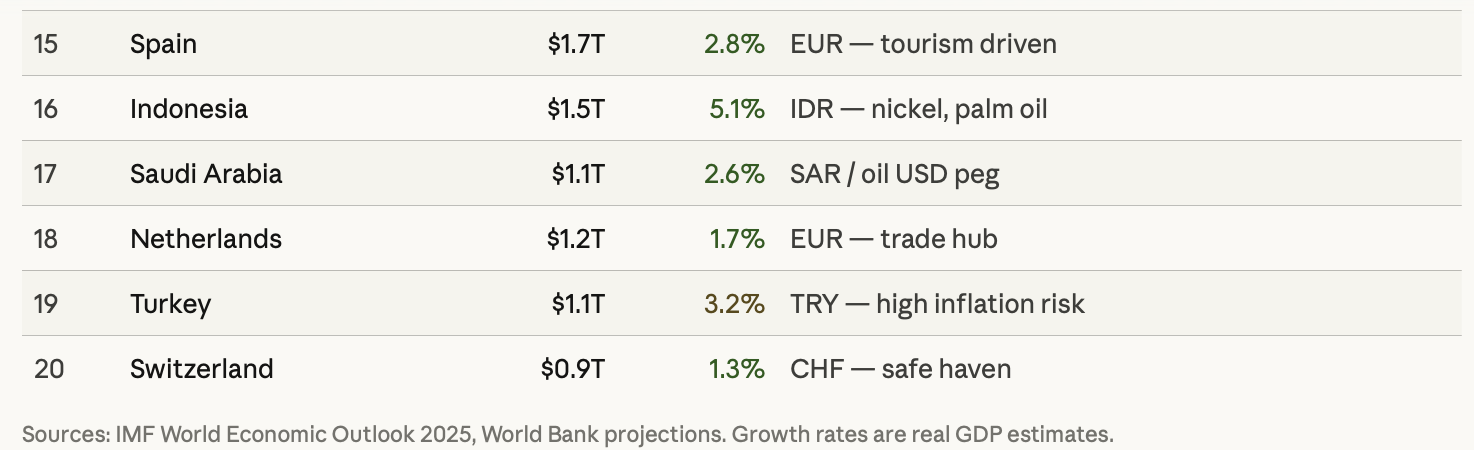
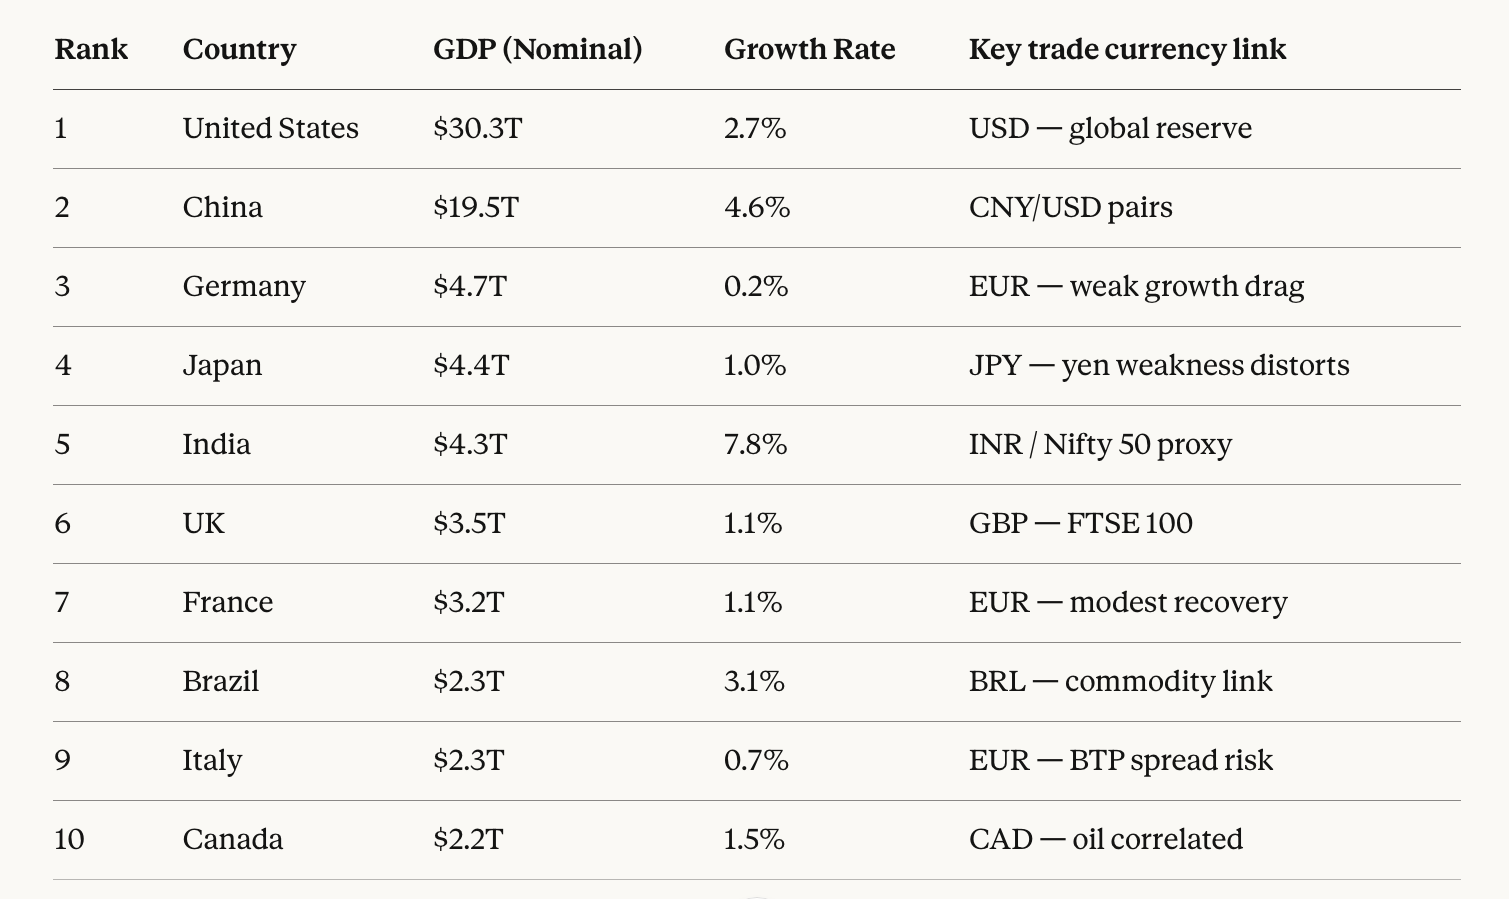
The United States has approximately 26 per cent of the global nominal GDP, whereas China has around 17 per cent. The next three countries, Germany, Japan and India, offer great competition to one another, but because India is growing at a much faster rate than the other two, it will soon overtake them.
The three-economy power structure
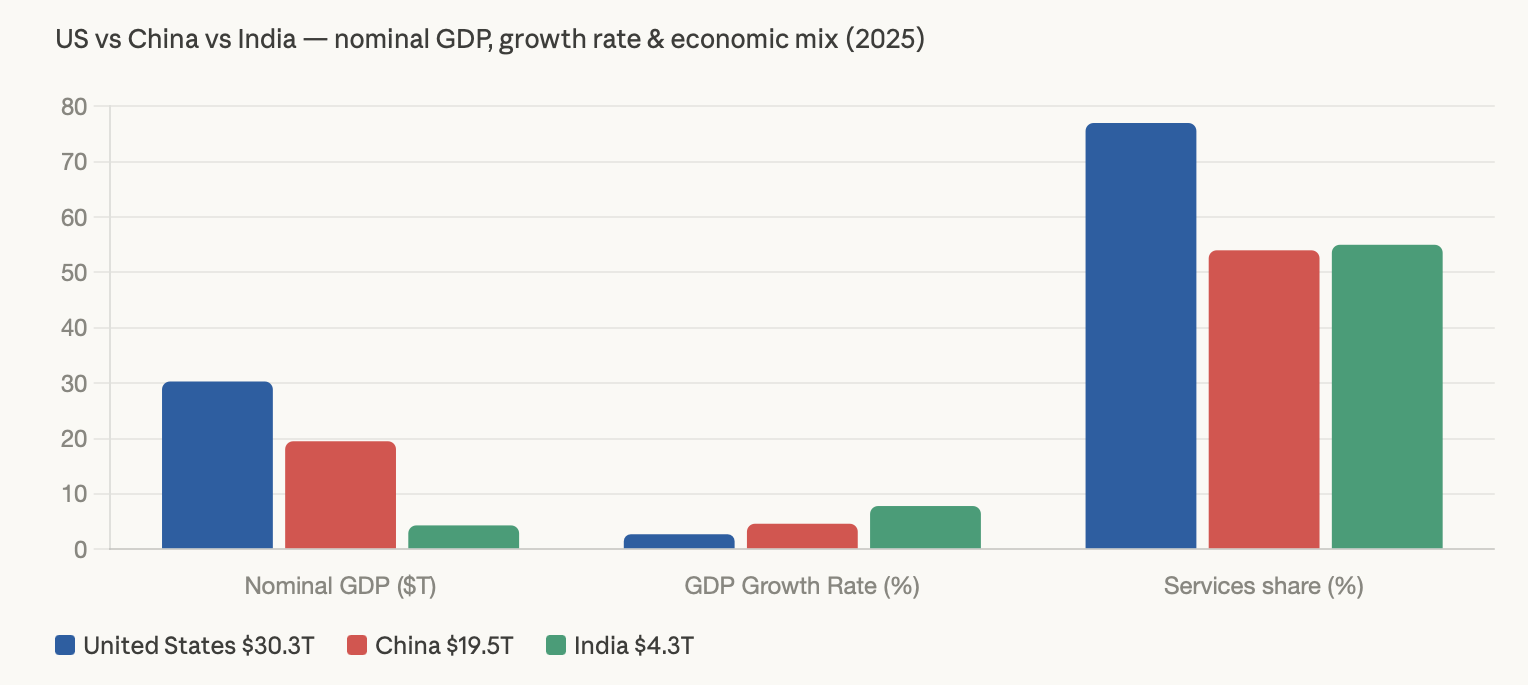
The United States has a primarily service-based economy, with the service-based sectors of technology, finance, and health care contributing primarily to GDP. In the case of China, the GDP is still largely based on manufacturing, but China is shifting toward more consumption internally (thus the U.S. per capita GDP is 6.5 times that of China, at $91,000 versus $13,800).
Of all three G20 economies, one of the most compelling stories for traders in structural growth will continue to be found in India, with its 7.8% growth rate, a very young workforce, and rapidly expanding digital services markets. Therefore, those who are watching the Nifty 50 will also want to pay special attention to India's overall GDP growth.
Forecast vs actual — who surprised in 2025?
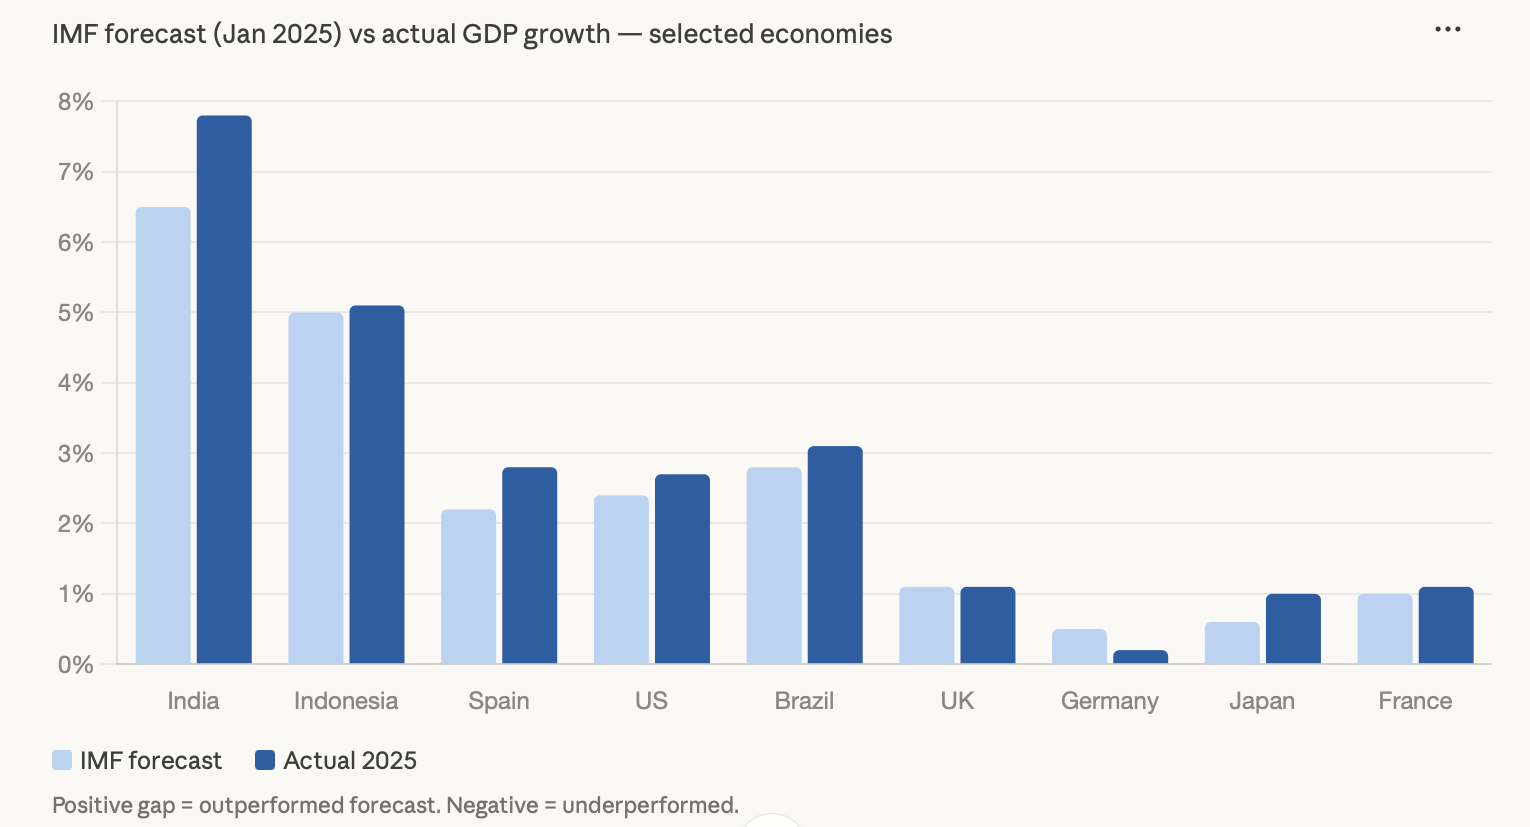
The projection from the International Monetary Fund (IMF) was this: India will grow by over a full percentage, while only about 0.2% in Germany and only 0.5% in the U.S. are projected. This means the ECB will have to make cuts in interest rates as a result of Germany's misses, and maintain an even lower EUR/USD rate as a result of Germany's misses.
Japan also surprised to the upside, with stronger export revenues in nominal form due to a weaker yen.
In most cases, when a country meets forecasted numbers, its currency will increase in value; similarly, if they fail to meet predicted numbers, then its equity indices will fall. If you are holding a CFD position that does not have a stop on it, the negative reactions to a failed result can be swift and severe.
How exchange rates distort GDP rankings
The ranking table you saw above is denominated in USD. That creates a measurement problem: if the euro gains 8% against the dollar in a year, European economies appear larger in the rankings even if their domestic output didn't change at all.
The formula is simple, but the implications aren't:
Nominal GDP (USD) = Local currency GDP ÷ USD exchange rate
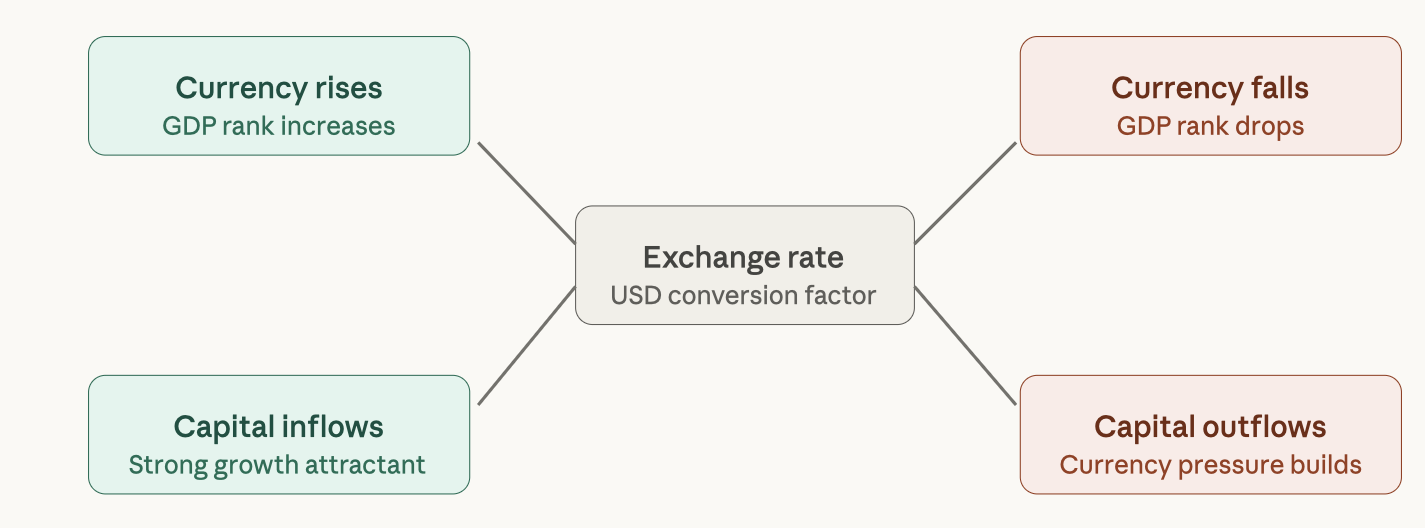
To forex traders, it is also good to understand the feedback loop created by countries that experience strong GDP growth, attracting foreign investors. This will strengthen their currencies compared with other countries. An elevated value of the currency caused by foreign investment creates additional improvement in the rank of the country’s nominal GDP.
This is an ongoing cycle until either the country’s currency is overvalued or the capital invested in that country reverses back to its home. Knowing what is currently occurring in this cycle will provide the trader with a major part of any macro-level trading strategy. For tools to assist in establishing access times for trades, visit the page on support and resistance, as well as review our swing trading strategies.
Growth rate vs total size, which actually matters for traders?
The short answer: both, but at different times.
GDP Size measures the size of the total output of a country/region. It tells us about how deep and liquid the market is and how systemically important that country/region is. The reason the U.S. dollar is the world's reserve currency is partly because of how large the economy of the United States is.
This gives the U.S. economy the ability to anchor international trade. Therefore, when trading against the U.S. dollar, you are NOT trading against its size; rather, you trade with its size accounted for.
GDP Growth Rate tells us how growth in the global economy has been distributed by type of economy. Emerging economies with GDP growth rates of 6-8% will receive foreign investor equity inflows, foreign direct investment (FDI), and therefore their currency will gradually appreciate relative to those of developed markets with GDP growth rates of 1-2%.
Developed economies have lower expected returns and lower volatility due to being much more stable than developing economies. Practical application: Use GDP size to determine which markets to follow and GDP growth rate to determine where to distribute your investment capital within those markets.
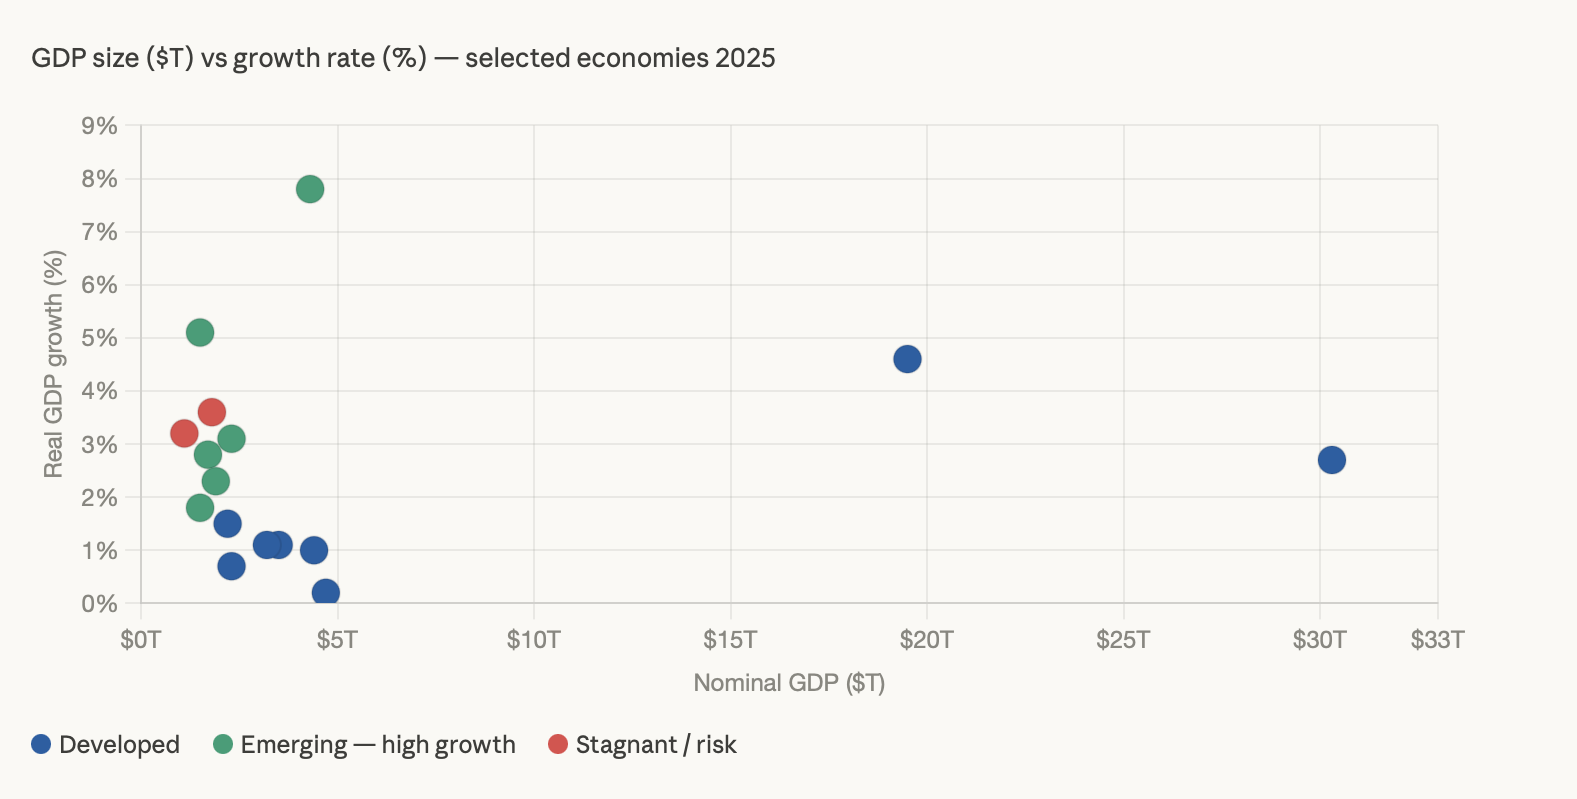
The fastest-growing economies in 2025
Guyana is projected to experience extraordinary economic growth of over 14 per cent in 2025, primarily due to oil finds off the coast of Guyana. Ethiopia is the biggest emerging market in Africa, and is another country in East Africa that is expected to grow after exporting gas produced offshore. After initially starting to produce gas, Senegal has now been included on this list as well.
India will remain the most tradable of these countries due to having deep, liquid markets and easy access to institutional funds; therefore, trading India’s equity index will include the Nifty 50 as the main equity index. South Africa is another country to consider, as traders using a local forex broker will find that macroeconomic conditions have improved since the low point reached in 2024, due to improved economic conditions and provide renewed support for the ZAR in the forex market.
How 2025 GDP data affects forex, indices, and your trades.
Markets are moved by surprises in GDP announcements. Here's how we can think about this: strong GDP growth typically leads central banks to keep interest rates steady or raise them. Higher interest rates attract foreign investment seeking higher returns, causing capital inflows that push up the currency.
A stronger currency keeps inflation low, thus allowing stronger GDP growth. This cycle will continue to play out until GDP growth slows down or fiscal deficits become larger than what is manageable.
When it comes to forex trading, the U.S. dollar will always be your benchmark. Moderate growth in the U.S. 2.7% is satisfactory enough to mean the Fed will be cautious about making any cuts. So as a result, the U.S. dollar should continue to offer real rates of return that are relatively good. Additionally, traders in EUR/USD or GBP/USD should be aware that Germany's economy is materially stalled. This means there will be a stronger headwind against the Euro than against the U.S.
Traders using technical analysis along with macroeconomic triggers from the GDP result are able to manage the timing gap between fundamental indications and price direction. Keep an eye on U.S. GDP numbers if trading the DJIA. When the economy is strong, earnings for equity securities rise. When the economy shows weakness (i.e., the GDP number does not meet expectations), you can anticipate a quick sell-off of equities through multiple compressions.
Real GDP vs nominal, the formula that matters in 2026
As we look toward 2026, the gap between nominal and real GDP becomes increasingly important. Inflation elevated across most developed economies, which means nominal numbers look healthy on the surface, but real purchasing power growth is often much weaker.
The formula every macro trader should internalise:
Real GDP = Nominal GDP ÷ GDP Deflator
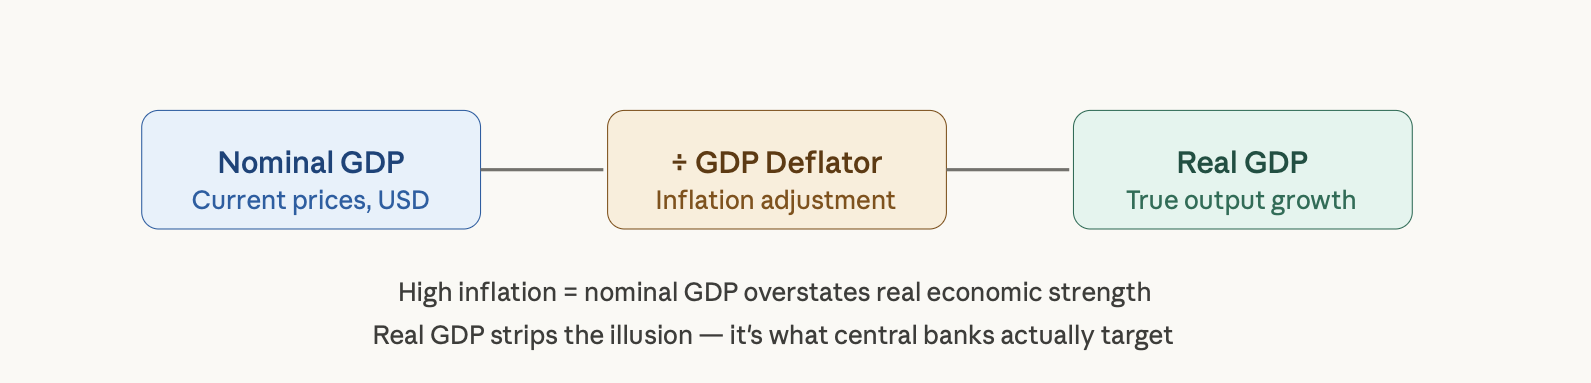
Here are two macro trends to follow until 2026: the progress of de-dollarisation, which is occurring slowly but is measurable, and the BRICS countries moving toward more local currency settlements in place of USD-denominated settlements; therefore, the ranking of GDP in terms of USD will begin to differ from purchasing power.
Also, gold is still absorbing safe-haven flows as investors hedge against not only the weakness of the USD but also the disappointment of real GDP growth. If you think about diversifying into hard assets as a macro hedge, how to invest in gold is also worth reviewing, along with this information.
2025 global GDP quick-reference
GDP, technical analysis, and CAGR — the complete framework
Your fundamental guide to GDP is the use of technical analysis as a timing tool for entry, and compound annual growth rate (CAGR) as a long-term performance benchmark.
When a country has a GDP growth of 7% per year, it will take about 10 years for the economy to double its production. That is the logic behind investing in emerging markets based on the premise of compounding. However, knowing the logic does not tell you when to enter the market; this is accomplished by using support and resistance and swing trading techniques, i.e., converting macroeconomic confidence into concrete entry points.
The ultimate performance benchmark for any portfolio is simple: "If my portfolio is not growing faster than global GDP growth, I am underperforming the global economy." In 2025, global GDP will be approximately 3.2% per year. This will be the benchmark. Traders who use macro data not as an indicator of market-moving news, but as a framework for executing trades, consistently outperform the benchmark.
FAQ
What does GDP by country 2025 mean? It's the ranking of nations by their total economic output in 2025, measured in nominal U.S. dollars to allow direct cross-country comparison.
Which country has the highest GDP in 2025? The United States at approximately $30.3 trillion in nominal GDP.
How does GDP affect forex trading? Strong GDP growth supports a currency by attracting capital inflows and justifying higher interest rates. Weak GDP tends to weaken a currency as central banks ease policy to stimulate growth.
What's the difference between real and nominal GDP? Nominal GDP uses current prices and is used for size comparisons. Real GDP adjusts for inflation and reflects actual changes in output; it's a better measure of whether an economy is genuinely growing.
Why do GDP rankings change every year? Two reasons: actual economic growth differs between countries, and exchange rate moves change how local GDP translates into U.S. dollar terms for the ranking.
You've read the data, now put it to work. Open your Tradewill account and start trading the indices, forex pairs, and CFDs directly shaped by 2025's GDP shifts.
Disclaimer: The content of the blog does not represent any position of Trade W, does not serve as any trading-related decision advice, and does not endorse any third-party.