

 Trade W

1. Executive Summary and Key Price Scenarios Investors Must Know
Gold does not respond to just news reports. Rather, gold trades based on its own structure, and the gold market's structural forecast is very compelling.
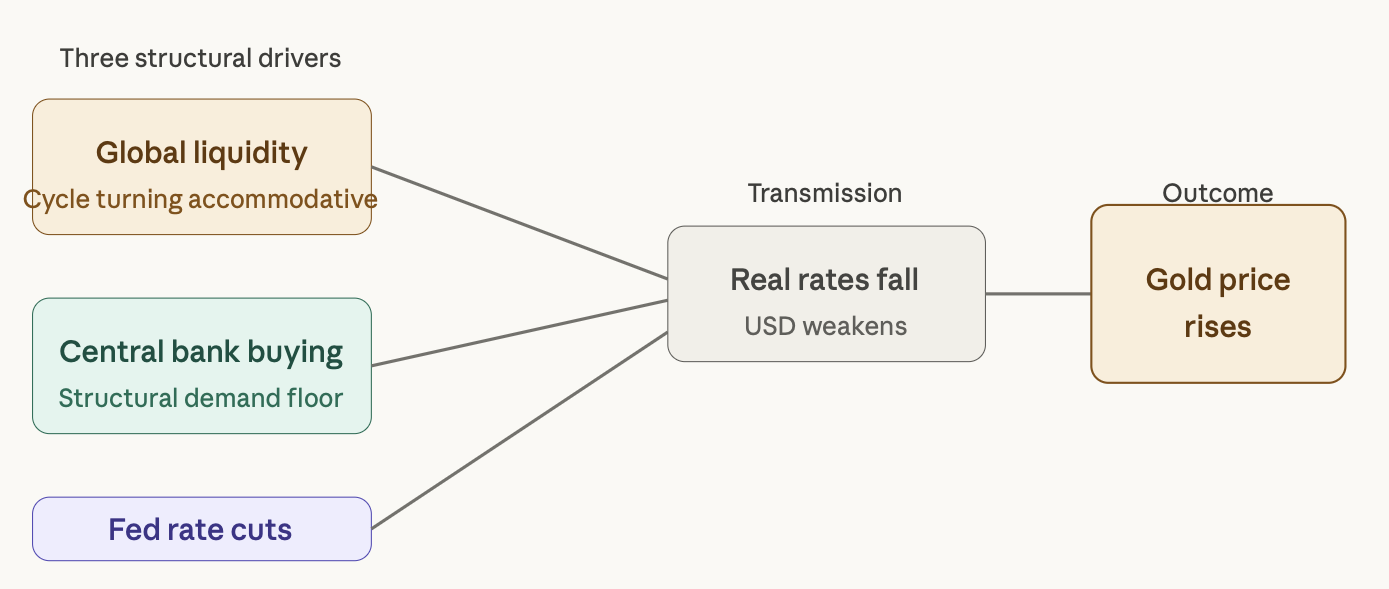
The gold market's structural forecast for 2026 identifies three integral factors that will drive gold prices higher: a global liquidity cycle that has changed from restrictive to accommodative, central banks that continue to purchase large amounts of gold and a Federal Reserve that appears to be moving toward decreasing interest rates. Any one of these three factors is bullish for gold. All three together represent a structural bull market versus a short-term, lucky rally.
To put where we are currently into context, it's helpful to understand the cycles gold has gone through. In 2020, gold experienced a pandemic-induced rally that was reactive to COVID-19 and included a lot of fear and emergency stimulus. From 2021 to 2025, there has been an accumulation of gold by central banks; a very deliberate event, with sovereigns buying gold on dips.
Where could 2026 lead? 2026 may represent the beginning of phase three: a potential acceleration of gold as institutional investors and retail investors converge and test price levels that are currently thought to be extreme.
Three Price Scenarios Worth Taking Seriously
Asking for a one-number forecast of the gold market isn't conducive to documenting a forecast. This is not how markets operate today. A better way to forecast is to consider a macro-critical set of different outcomes, all of which are realistic.
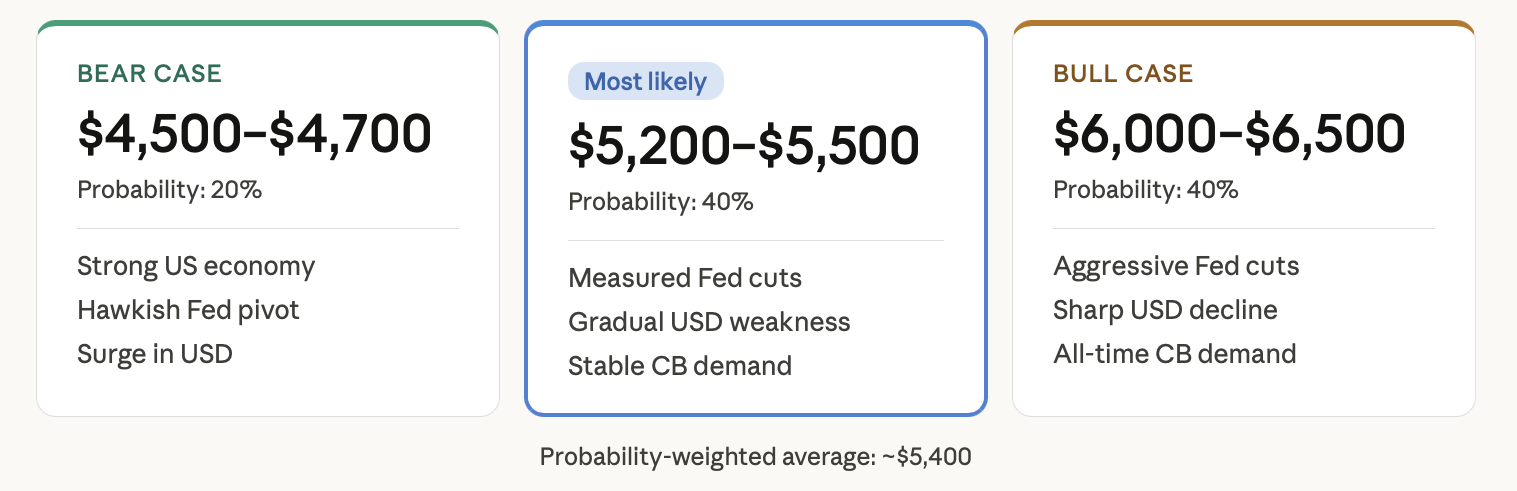
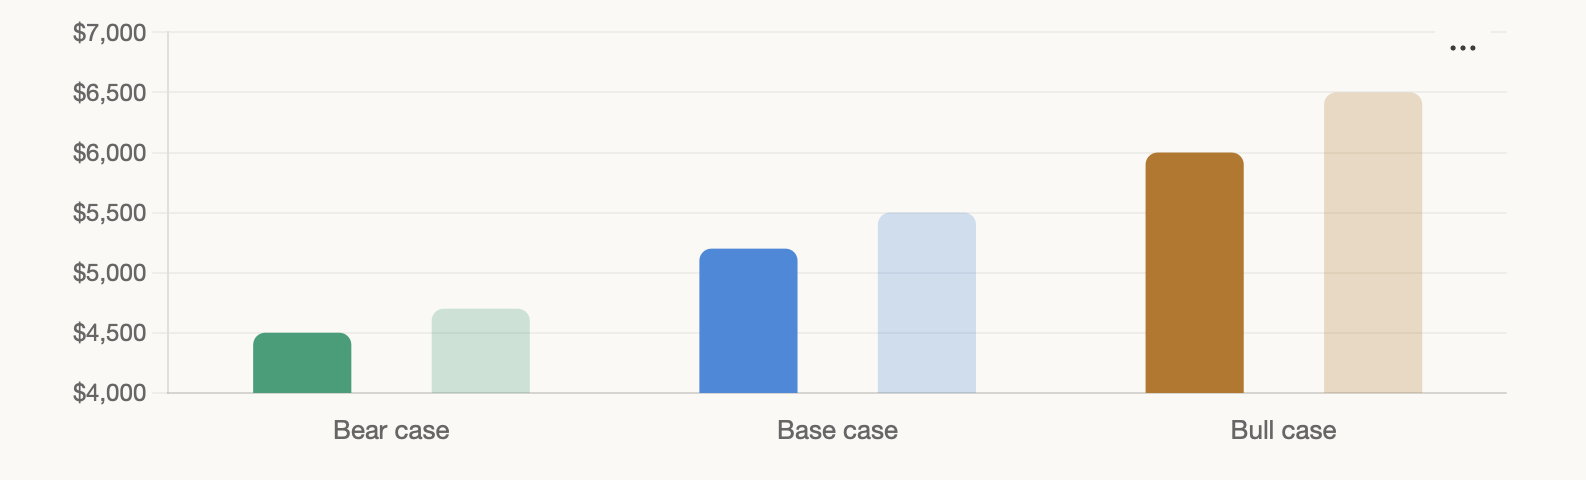
In the optimistic case, gold is $6,000 to $6,500; this requires the Fed to aggressively cut the rate significantly more than what's being priced today, the USD to lower dramatically, and CB demand will remain at or near All-Time high levels. Under this condition, if inflation resumes even a small level of momentum along with nominal rates dropping, real rates drop substantially, and gold has been known to respond quite aggressively.
In the base case, gold is between $5,200 and $5,500. This assumes the Fed will cut rates in a measured manner, the dollar will gradually weaken, and central banks will continue to demand gold, but at a moderate or modest level. This may be best considered a "business as usual," and interestingly enough, this outcome usually has the highest probability of occurrence.
The downside or correction scenario has the gold price going back to $4,500 - $4,700; this is not considered to be a price collapse, but will be considered price resetting. There are several potential catalysts that could lead to this pricing, such as a significantly stronger economy than expected in the US, an unexpected pivot by the Fed towards a hawkish monetary policy or a significant spike in the USD. The late-stage buyers would probably all be liquidated due to this, but the structural story would remain unchanged.
This is similar to a weather forecast: It could be a hot summer, a normal summer, or a cooler-than-expected summer, but the climatological trend has not changed; the only difference is the immediate short-term weather conditions.
Where the Market Stands Right Now
After a long period of outflows, the flows into gold ETFs have begun to rebound. The managed money accounts also show a marked increase in the net long position from futures contracts.
While historical dollar levels remain high, there are indications that dollar weakness may be occurring structurally due to US government fiscal concerns. Expectations of rate cuts as a result of continued fiscal stimulus have been repeatedly repriced, and therefore, gold has also been affected by these repricings.
In reality, the gold market is not completely factoring in that there will be a prolonged cycle of dollar weakness and/or a more aggressive pace of rate cuts than currently reflected in pricing. The gap between current asset pricing levels and reasonable macroeconomic outcomes represents the opportunity in the forecast for this gold market.
2. Global Liquidity Cycle and the Macro Forces Behind Gold
Unlike a commodity in the classic sense, gold is primarily viewed as a financial instrument and reacts primarily to monetary policy changes once again. Liquidity levels around the world have, in fact, been the most significant macro component of predicting the gold market's behaviour.
As global liquidity expands, asset prices generally increase,e as do gold prices, while if global liquidity contracts, asset prices generally fall, as do the prices of gold commodities. Gold being at the place where currency and commodity value meet usually provides for greater volatility when compared to any other commodity and thus typically overreacts to both increases in monetary Liquidity and decreases.
How Liquidity Feeds Gold
The period between 2020 and 2022 saw unprecedented growth in the global M2 money supply, resulting in significant asset price increases across the board, including stocks, real estate, and commodities. Although gold did see some benefits from this event, real interest rates were high throughout much of this timeframe, so gold was not among the assets that experienced extreme price increases throughout this period.
Central banks around the world are changing course now. The European Central Bank has already started to begin reducing its interest rates. The Federal Reserve is anticipated to do the same. China continues to put money into its banking sector. When global M2 starts to grow rapidly again, it is easy to see why all hard asset prices will increase; when you have more money chasing hard assets, there will be upward pressure on those assets due to a lack of supply. Gold will be at the top of that hierarchy.
The Dollar Super-Cycle and What It Means
The known inverse relationship between Gold and the US Dollar shows that a rise in the value of the US dollar corresponds to a fall in the value of gold and vice versa. The dollar's Structural weakness lies in the United States running a constant deficit, with its debt-to-GDPP ratio at an all-time high; this creates an ongoing downside to the value of the US dollar; however, these numbers do not always show up in individual Quarterly reports.
Traders in US Treasuries will watch for the level of US Treasury yields, but will also watch for what they indicate about the sustainability of the US Government's debt level. Foreign investors who hold US Treasury bonds are beginning to diversify their holdings, and the primary beneficiary of this diversification is gold. The change can be observed with the Central Bank's Reserve levels.
Risk-On vs Risk-Off: Gold's Dual Role
Historically, gold has been an excellent investment during times of recession, financial instability, geopolitical uncertainty and other types of risk. However, it is now also demonstrating positive performance during periods of greater investor confidence; specifically, when fiscal policy expansion and concerns over currency destruction create positive investor sentiment.
Thus, while the characteristics of gold do differentiate it from most financial instruments in 2026, its two demand sources will lead to price movement through the same three variables: real interest rates, liquidity and the value of the US dollar relative to others.
The relationship between these three elements is straightforward. The first two will remain in favour of gold and could result in strong price rallies when an increasing dollar value is part of the mix. In the current macroeconomic environment, at least two out of these variables suggest that they will produce positive gold price results.
3. Central Bank Gold Buying and the Structural Demand Floor
If you want to understand why gold hasn't corrected more dramatically despite periods of dollar strength and elevated yields, look at central bank buying. It's the structural demand floor that most retail investors underestimate.
What the Data Shows
Since 2010, central banks worldwide have continued to acquire more gold than they sell every year; however, beginning in 2020, this activity increased significantly. This led to an increase in annual purchases of gold by almost 50 per cent from the previous high, and it continues at these elevated levels through 2021. Central banks as a group absorbed a significant portion of the total amount of annual gold produced from mining, creating an ongoing demand for gold regardless of its price.
The important thing to note is that central banks behave differently from hedge funds when it comes to purchasing gold. Central banks buy gold without regard for its price relative to the price they believe it will be there in the future. For example, when central banks look at a price chart to determine whether to buy at $3,000 or $3,200, they do not make their decision based on the current price. Instead, they make their decision based on their long-term reserve accumulation plan, which currently says to purchase gold.
Why Countries Are Buying
The trend of moving away from the use of the dollar for worldwide trade is something that is happening, although at a slow pace and probably won't be fully realised until a number of years from now. The countries that have large amounts of US Treasury reserves have clearly had their eyes opened because they saw what happened to Russia's foreign reserves after the imposition of sanctions in 2022. The takeaway message here is that dollar-denominated assets located outside of the USA are still subject to geopolitical risk. Gold, which is located inside the USA, is not.
There is nothing new about the practice of reserve diversification; however, the degree of urgency that countries feel to diversify their reserves has dramatically increased. Emerging market central banks in Asia, the Middle East, and Eastern Europe have been the largest purchasers of gold in international markets, but even some developed market institutions have also quietly increased their gold allocations.
A good way of thinking about this is when you have your entire family's savings deposited in one financial institution that, for whatever reason, has suddenly turned out to be untrustworthy, and you now want to place your entire family's savings back into different financial institutions. This is what countries are doing when it comes to diversifying reserves, with gold being viewed as an independent financial institution to which they can deposit their savings.
Why This Matters for the Gold Market Forecast
A structural price floor is created by the demand from central banks. While this does not guarantee that prices will increase, it greatly constrains how much lower they could go before institutional buyers intervene. The demand from central banks is likely the most significant long-term anchor for the gold market in 2026. Even in a worst-case scenario, central banks are expected to help sustain prices between $4,500 and $4,700.
4. Fed Rate Cuts, Real Yields, and the Core Pricing Mechanism
While the floor price is explained by the central bank's purchasing activity, the ceiling price is explained by the behaviour of real interest rates. The rapidly decreasing trend of real interest rates is also the reason that monthly ceiling prices in gold continue to increase.
Every Gold Trader Should Know This Formula
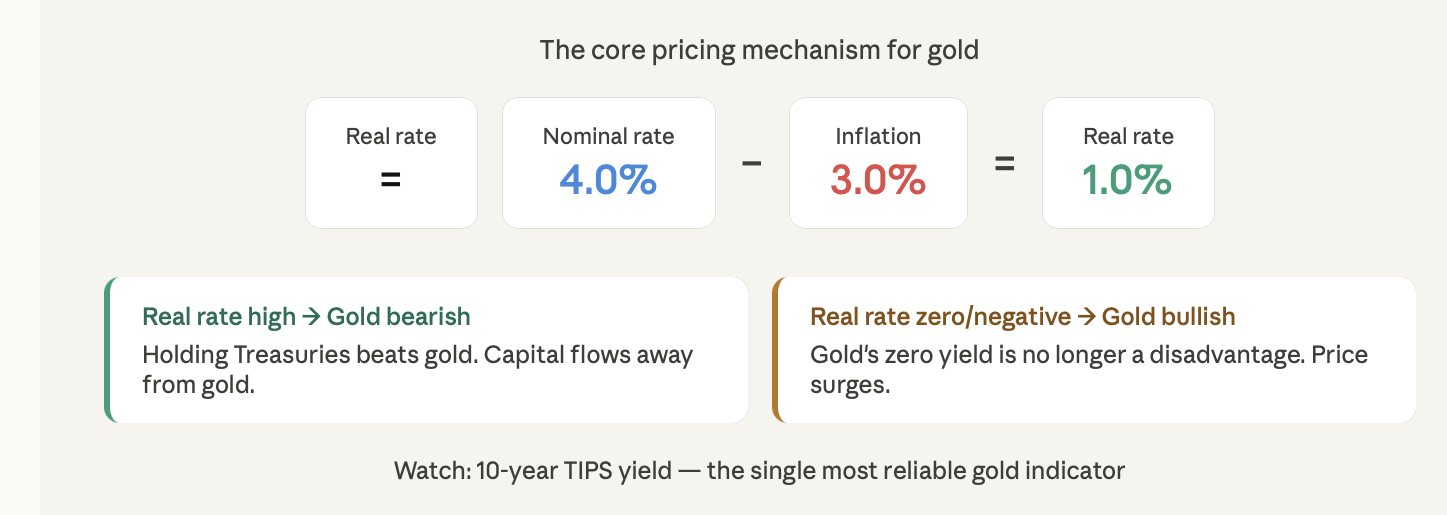
Real Interest Rate is equal to Nominal Interest Rate minus Inflation. When real interest rates are high, the cost of holding gold is higher than holding Treasuries. Conversely, when real interest rates are at zero or negative, gold becomes a less expensive investment compared to Treasuries. When making a non-yielding investment like gold, which is very low in comparison with other investments yielding little or no income or return on your investment, you are at a distinct advantage.
The relationship between gold price and real interest rates has remained very stable historically. The approximate 2020-2022 rally in gold price can be correlated with the decline in real interest rates. In contrast, the most recent correction in the price of gold occurred parallel to the steepest increase in real interest rates in decades. The current environment, where the Federal Reserve is anticipated to decrease its rates and inflation remains sticky, points to strong evidence supporting a compression of real interest rates once again.
2026 Rate Path and What It Means
According to the inflation forecast for 2026, markets are still in the process of adjusting to the impact of the interest rate increases between 2022 and 2023. The rate of inflation has decreased from its previous highs, but is still above the desired target of 2%. The nominal interest rates are high but they have begun to decline as the Federal Reserve indicates it will start to lower rates.
If the Federal Reserve lowers interest rates two or three times in 2026 while inflation is between 2.5% and 3%, then real interest rates will decrease significantly. The base case for the price of gold would be between $5,200 and $5,500. If inflation increases or if the Federal Reserve lowers rates more aggressively due to concerns about economic growth, then the price of gold could increase to more than $6,000.
For example, if you are earning 4% on a savings account and inflation is at 3.5%, your net gain on that money will only be 0.5%. At that point, even though gold does not pay anything, it looks like a reasonable alternative. When your savings account pays only 3%, the situation becomes even more favourable to gold.
The 10-year Treasury Inflation Protected Securities (TIPS) yield represents the most important indicator for gold traders in determining their positions. Usually, when the 10-year TIPS yield decreases, gold will be supported. The relationship is not perfect, but it is a very reliable indicator in macroeconomic trading.
5. ETF Flows and Institutional Demand as Short-Term Catalysts
The structural drivers provide the direction, while the flow of ETF and institutional positions provides the speed. Institutional and retail investors investing into gold ETFs GLD and IAU create a large amount of demand for physical gold, which produces buying pressure that generates an increase in the likelihood that prices will move faster and further than fundamental factors would normally predict.
The Pattern
Gold ETFs held a record amount of gold from 2020 through 2022, and this contributed to the existing rally. But as interest rates moved higher and opportunity costs for these products increased, the sale of ETFs heavily weighed on gold’s price, while central banks accelerated their purchases of gold. As gold was simultaneously being purchased by central banks and sold through ETF sales, gold stayed in a range longer than most expected.
As we move toward 2026, there are changing dynamics to this situation. Expectations of interest rate cuts have rekindled institutional interest in gold as an asset class to diversify portfolios. Institutions that had reduced their exposure to gold during the high-interest-rate period are now starting to rebuild their positions.
Increasing institutional demand for gold impacts the COMEX futures market even more because long positions are increasing, volatility is increasing, and accelerating price action is occurring. Gold can also behave similarly to a grocery store that has a lot of activity. Regular buying keeps the product on the shelves relatively stable with relatively stable pricing. If activity spikes on one item, there will be an immediate depletion of that item from the shelf and a price increase. Gold can behave similarly when an institution makes a very large purchase.
Retail Behaviour Adds Fuel
Momentum investors usually follow a trend after it's already been established. They do not usually buy at the very beginning of an uptrend, but will do so after they see it start moving. As there are more retail apps and ETF or CFD platforms available for buying and selling Precious Metals, it is expected that Retail Investors will have larger volumes than in prior cycles by 2026.
6. Gold Technical Analysis 2026 - Key Levels to Watch
Technicals don't drive the gold market forecast. Fundamentals do. But technicals tell you where the opportunities and risks sit within the broader macro trend.
The Long-Term Trend Channel
Gold has been moving in a clear upward channel since the lows of 2018, with each major pullback finding support at or close to the lower boundary of this channel and each breakout stopping at or near the upper boundary before consolidating. The current movement of gold fits this pattern.
Since 2018, the 200-week moving average has been a very reliable source of long-term support for gold. Gold has not spent any significant time trading below this moving average since that time. If gold were to pull back to this moving average, I would expect a significant amount of buying to come into the gold market, consistent with the bear case support zone of $4,500 to $4,700.
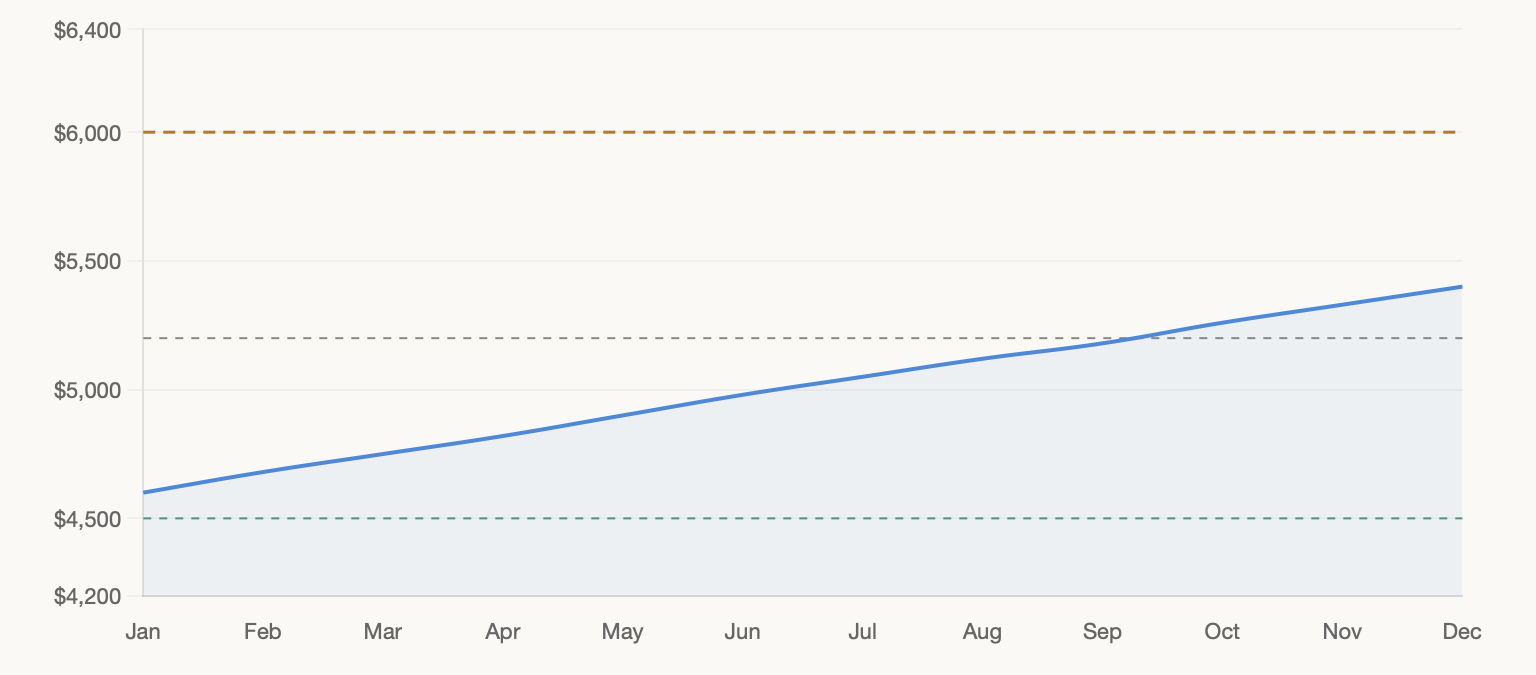
Key Levels
The amount of $4,500 will be an indication of huge support. If you break below this important level, it could have a major impact on the technicals, and it would probably take a major macro event like surprise Fed tightening or a surge in the USD to keep this level intact.
Resistance for the near term is at $5,200. This price, which once acted as support, has now become resistance; therefore, bulls will need to strongly establish control over this price for the next price movement to happen.
$6,000 is the projected upper boundary for a long-term channel and represents the bullish target. Achieving this price will not require a major event; it will just be based on the extensive base macro case playing out successfully with positive momentum.
RSI and Momentum
The Monthly RSI has been high, but hasn't been in extreme overbought territory for the majority of this current cycle. On the Monthly MACD chart, there is still a lot of bullish momentum and no clear divergence between the two.
The rubber band analogy applies in this case as well; therefore, if they are stretched enough, they can potentially snap back. In addition, this cycle has yet to produce any significant extreme readings that typically occur before major reversals.
7. Probability-Weighted Gold Market Forecast for 2026
Professional forecasting isn't about picking a single number with confidence. It's about mapping the most likely outcomes and assigning realistic probabilities.
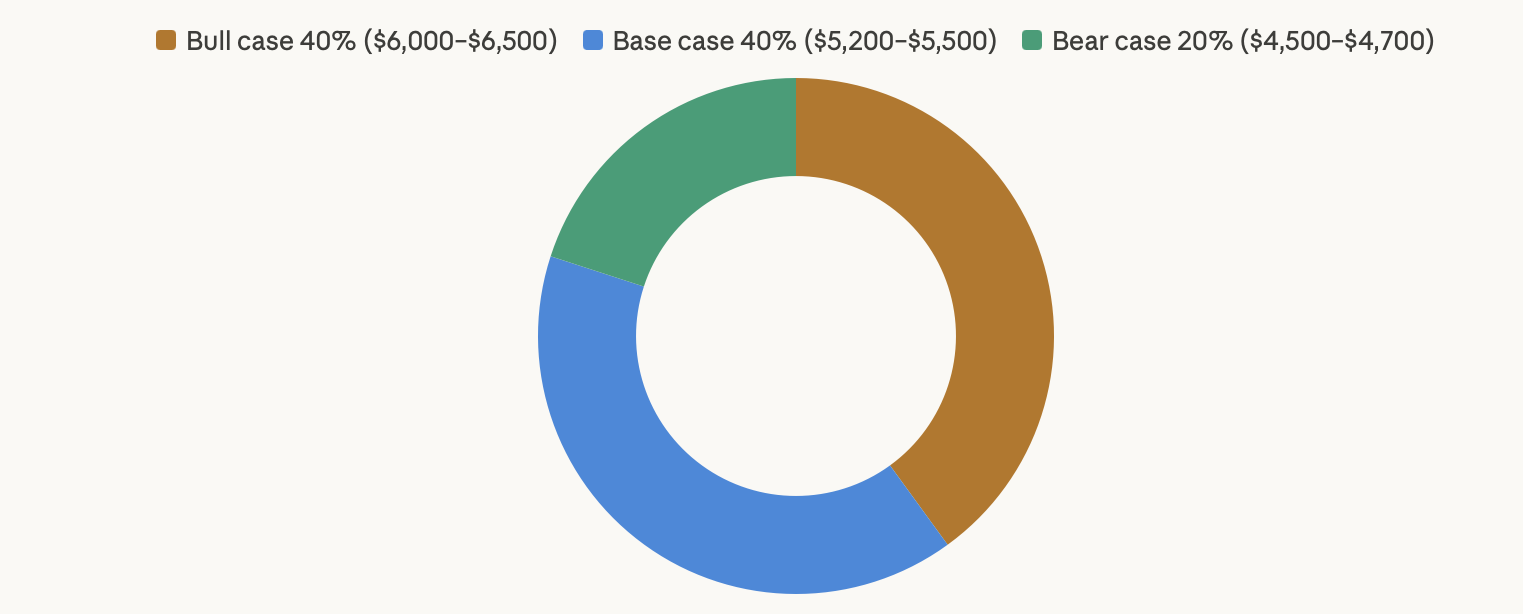
Bull Case: 40% Probability, Target $6,000 to $6,500
To meet this scenario, we need significant cuts from the Federal Reserve (Fed), the U.S. dollar continuing to drop in value, and central banks to keep buying at or near current rate levels. If inflation starts up again at the same time that the Fed is cutting interest rates, but prices remain high, this could also satisfy this scenario's requirements. If ETF flows come back into the market with force, institutional investors go net long, and momentum attracts retail investors, there are conditions that could support the scenario outlined here. Therefore, it would not be out of the ordinary.
Base Case: 40% Probability, Target $5,200 to $5,500
The Federal Reserve is proceeding with its slow and steady interest rate cuts, causing a gradual weakening of the U.S. dollar. We're continuing to see strong demand from central banks for gold. Inflation is moving lower but isn't collapsing or going away altogether; there are positive net flows into ETFs, but they won't be reckless. Overall, Gold is now upwardly trending at a consistent rate but without any major spikes associated with the bullish case. This represents the most positive outcome for investors over the long term while staying "boring."
Bear Case: 20% Probability, Target $4,500 to $4,700
Given the US economy's strength, the Fed could halt or reverse its current rate of cuts, causing significant volatility in the dollar due to differences in growth rates between countries. Central banks will reduce the rate at which they purchase assets from each other, causing large outflows from exchange-traded funds (ETFs), causing a sudden collapse in the price of gold; however, gold should find support at around $4,500. This scenario does not end the longer-term bull run in gold but requires patience for those who bought near the peaks of its market price.
Based on the weighting of the various probabilities assigned to each of the above three potential outcomes, the average probability-weighted outcome across all of the three scenarios is around $5,400, which is also in line with what most participants see as the base case outcome. Such consistency with the three variables leads us to believe the base case is not just a realistic midpoint but is possible to have occurred and is consistent with what most macroeconomic analysts are relying on currently.
8. What Could Break the Gold Market Forecast?
Every forecast needs honest invalidation points. Here are the scenarios that would materially change the picture.
An Unexpected Dollar Surge
The US economy would need to do much better than other major economies in 2026 for capital to flow into dollar-based assets at such an aggressive rate. If that happens, the DXY would spike, real yields would remain elevated, and gold’s opportunity cost would increase. This represents the single largest near-term risk.
A Deflation Shock
When the demand for goods and services suddenly declines worldwide, a higher probability exists of falling prices. As a result, the return based on purchasing power (real yield) rises; however, nominal returns will be negative (falling returns), which means there will be an adverse effect on gold in the immediate future, before stabilising subsequent to government or central bank monetary stimulus and eventually recovering.
Central Banks Stop Buying
If the political or economic landscape changes to the point that central banks start to net sell, it would remove the structural floor. This is not very likely based on current global reserve diversification patterns; however, it is prudent to continue monitoring any geopolitical developments that could result in a change to how countries manage reserves.
Strong Global Growth Recovery
If we see real and broad-based global growth recovery, it will give strength to risk assets as well as pull capital from defensively positioned investments, including gold, to benefit the dollar. If this occurs without creating inflation, it would represent a clean negative for gold.
Being aware of what could go wrong is not being pessimistic but is part of how professional traders protect themselves.
9. How to Trade the Gold Market Forecast in 2026
A forecast without an execution strategy is just an opinion. Here's how to translate this gold market forecast into practical trading decisions.
Trend-Following Approach
A bullish trend continues in both weekly and monthly time frames. Trend followers will want to buy into pullbacks to major moving averages, either 50-day or 200-day, as opposed to chasing after breakouts. As a result of this approach to buying on support versus buying after a rally, your risk/reward ratio is much greater.
Swing Trading Setup
For those who trade in shorter time frames, there are easily defined buy & sell zones, between $4,500 to $5,200. If you decide to enter your position at $4,500, you should place your stop-loss order below $4,350, and aim to take profits at $5,200. Having very specific criteria for entering trades is what makes the trading strategy manageable.
Scaling In, Not Piling In
One of the most frequent errors made by new traders is putting too much into one single entry when trading gold. A far better way to handle this is to break up the total amount of money you want to trade into three separate trades. The first trade should be made at the current price; the second trade should be placed after the market goes down 5-7%. The third trade should remain in reserve until either the market drops even further or breaks through resistance with a confirmed breakout.
Risk Management
Size your positions in gold based on its normal daily price movement. When trading CFDs, the use of leverage increases both your potential profit and loss. A rule of thumb is to limit the size of your individual trades to no more than two per cent of your total trading capital, as determined by the distance of your stop loss, so that you remain in the market over multiple trades instead of putting yourself at risk of irreparably damaging yourself when one trade does not go as planned.
Leverage Control
Professional traders generally use less than 5X leverage on their gold trades, even when they have very strong opinions, due to the volatility of gold. Leverage should be used to take advantage of an opportunity; it should not be used to make up for uncertainty.
10. Final Conclusion and Long-Term Strategic Outlook
The expected changes within the market for gold through 2026 seem positive, but there are some limitations placed on this outlook.
The structure of the market for gold is supported by three elements,s which continue to maintain strong support: the global liquidity cycle is turning more accommodating, the central banks of the world have fundamentally changed their reserve strategy, and the US Federal Reserve is moving toward cutting rates in a period of inflation that still has not fully normalised. These items will not serve as short-term trading drivers but represent multi-year forces in the market.
Markets will correct, and if the price of gold drops to $4,700 or $4,500, it will not be a sign that the bull market is ending; it will be a signal of the market cleansing itself of short-term trading positions prior to the next upward price movement. Historical price data show that most of the best entry points for gold during secular bull markets occur during uncomfortable price corrections rather than during euphoric price increases.
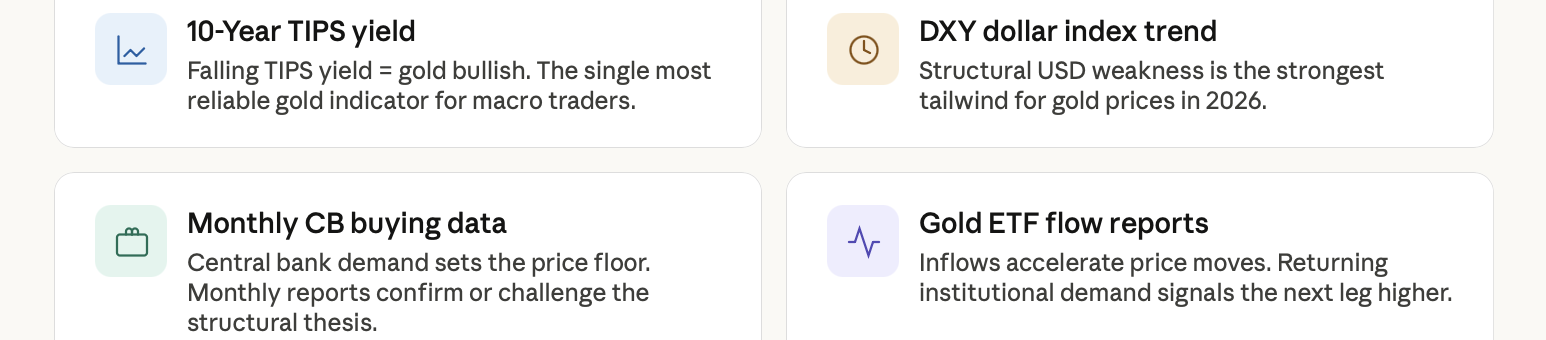
What are the best indicators of the next major move for gold going to be in 2026? The yield of the 10-Year TIPS contracts, the DXY Dollar index trend, the monthly central bank purchasing data, and the ETF flow reports for gold. These four pieces of information are going to provide a better indication of the next significant price move for gold than any pieces of short-term market news.
The long-term macroeconomic case for owning gold is not just a hedge against economic uncertainty. Gold is now viewed as one of the core macroeconomic asset classes in a world where there is increasing scrutiny about the sustainability of fiscal budgets, the rate at which countries are diversifying their reserves, and the long-term structural pressure being placed on the purchasing power of the currency. This does not mean to purchase gold at any price, but to view price corrections as opportunities rather than warning signals.
Thus, an outlook for gold through 2026 favours patient and methodical positioning rather than reactive trading. Gold will continue to have the wind at its back from a macroeconomic perspective; you simply need to determine how you will navigate through these price movements.
Ready to act on this gold market forecast? At TradeWill.com, you can trade gold CFDs with transparent pricing, professional-grade tools, and real-time execution built for traders who do their homework.
Disclaimer: The content of the blog does not represent any position of Trade W, does not serve as any trading-related decision advice, and does not endorse any third-party.