

 Trade W

What is a Golden Cross and Why Should You Care?
A Golden Cross occurs when a stock's short-term moving average crosses above its long-term moving average. The most common arrangement of moving averages to use for a Golden Cross is a 50-day moving average crossing above a 200-day moving average. This is considered a solid signal by traders that momentum is shifting to the upside, likely indicating the start of a sustained uptrend.
But, here's the thing, a Golden Cross is not a magic formula for making money - it is a trend signal and just a part of the picture. When the 50-day moving average of the S&P 500 crosses above its 200-day moving average, this typically shows that Institutional money is flowing back into the market. Again, it does not mean to buy, buy, buy everything you can find.
Consider moving averages as pricing information that has been smoothed out. The 50-day average represents approximately two and a half months of trading experience. The 200-day average? That would be almost one year of price action. When the shorter period moves above the longer period, that indicates price momentum over the shorter period has made a decisive move higher than the longer-term price characteristics.
The Golden Cross is significant since it combines two important dimensions: time and price. It disregards the noise from day-to-day movement and instead allows for an indication of a change in trend. This is precisely why institutional investors, hedge funds, and serious traders monitor it.
How Does a Golden Cross Actually Form?
The mechanics are simple, but the implications go further than you might think. Moving averages are really just averages of closing prices over lengths of time. A 50-day moving average simply sums the last 50 closing prices and divides by 50. Simple arithmetic, but very powerful when used to analyze the market.
When a Golden Cross occurs, three things typically occur in a sequence. First, the stock or index is in a downtrend or consolidation. Second, the short-term moving average (most commonly a 50-day moving average) is turning up as recent price performance improves. Third, it crosses through the long-term moving average (most commonly the 200-day moving average) which is flattening out or just beginning to turn up.
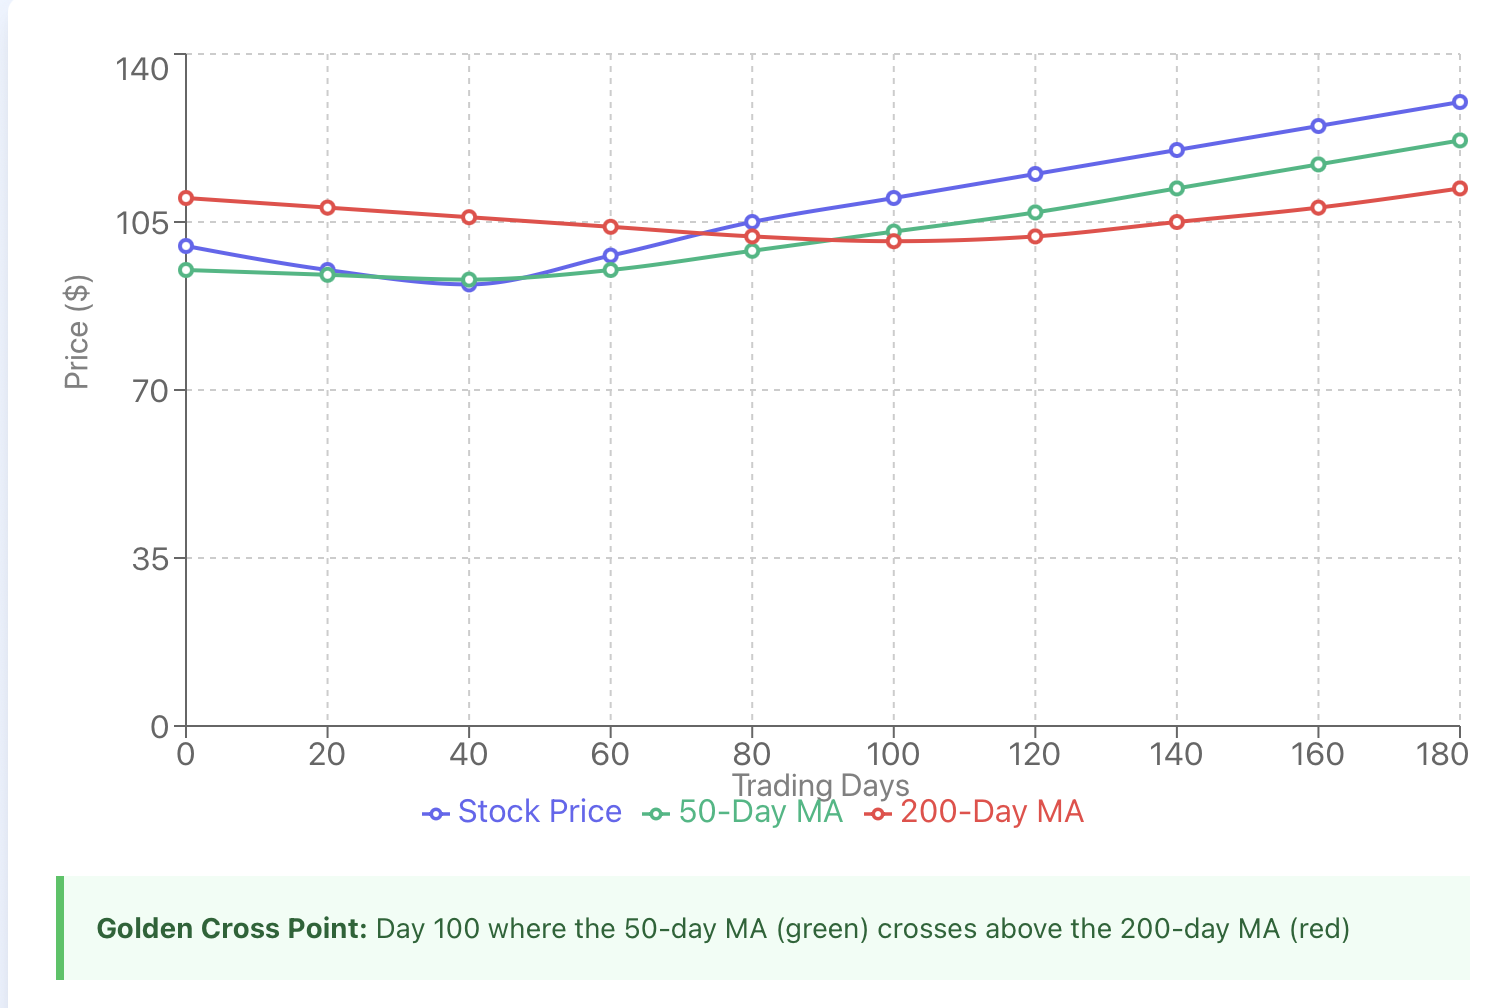
Volume is very important in this part of the set-up. A Golden Cross that takes place on skinny volume is like a runner passing someone on an empty track with no officials watching. It's done, but does it count? If there is strong volume accompanying the crossover, then it suggests there is conviction that a move is taking place. In early 2023, when the NASDAQ formed a Golden Cross, volume increased substantially. It simply makes it a more credible signal.
Some traders look to broader periods as they vary their trading styles -- for example, a 20-day or 50-day moving averages for shorter-term trades, and perhaps a 100-day or 200-day for ultra-long-term positions. The concept remains regardless of whatever periods you employ. Shorter timeframes will provide plenty of signals, though sometimes false ones, while longer timeframes will provide you with more reliable signals, though with a slower response time.
The math underlying this is not all that complicated, but the psychology is interesting. If short-term averages cross above longer-term averages, it demonstrates that recent buyers are willing to pay more than they were months ago. It is a change in sentiment, hence the strength of the signal.
What Does History Tell Us About Golden Cross Performance?
Let's start with the data because that's where the juicy stuff is. Going back two decades and backtesting the S&P 500 suggests Golden Crosses are about right 60 - 65% of the time. Not perfect, but better than a coin flip.
The S&P generated four major Golden Crosses between 2019 and 2023. Of those, three generated returns of 15% or more over the next six months, while the last Golden Cross just before the late 2021 market correction generated only a modest loss. That translates to a 75% success rate during that period of time; note that cherry-picking timeframes can be a little deceptive.
The NASDAQ tends to produce similar characteristics, but usually with more volatility. Tech-heavy indices can often produce sharper gains later after Golden Crosses in bull markets, but steeper losses in the case that there is a failed signal. The DAX and the FTSE have their quirkiness too; the DAX performed particularly well following Golden Crosses during phases of expansive European economic growth.
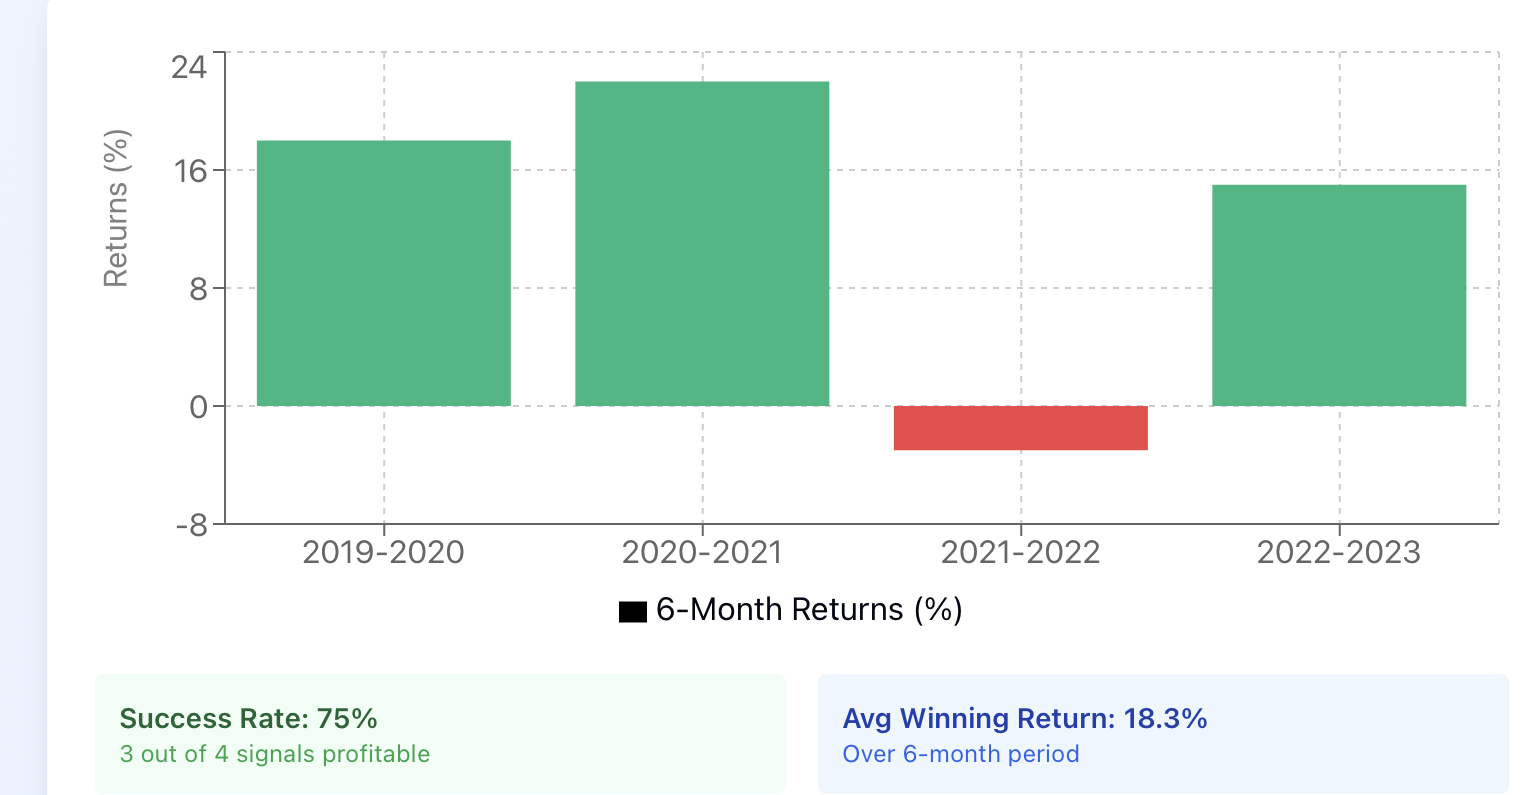
Average returns after a Golden Cross are highly variable depending on the market environment. In strong upward markets, expect returns to be between 20-30% over the next year. However, in choppy or bear markets that yield such signals, expect returns to be 5-10% losses before the market turns. Maximum drawdowns (peak-to-trough declines observed after entering a position based on a Golden Cross signal, opposed to the market peak), tend to vary in the history of being between 8-25%, depending on what index it is and when it was sold.
Worthy of note is sector performances. Financial stocks typically respond well to Golden Crosses in periods of recovery. Energy stocks have mixed performance; commodity prices tend to often move independently of technical signals. Tech stocks can be explosive, but often experience high incidences of false signals during consolidation.
The bottom line is that Golden Cross signals are better recognized as confirmation tools than as independent triggers that one would trade off of! Golden Cross signals are most effective and most reliable being bullish when the broader environment supports that thesis.
Combining Golden Cross with Other Indicators
This is how smart trading is different from mediocre trading. The Golden Cross is an indicator, but at that stage of the game, you have only one section of a map. Once you apply a few other indicators, it's much more like you actually know the "directions."
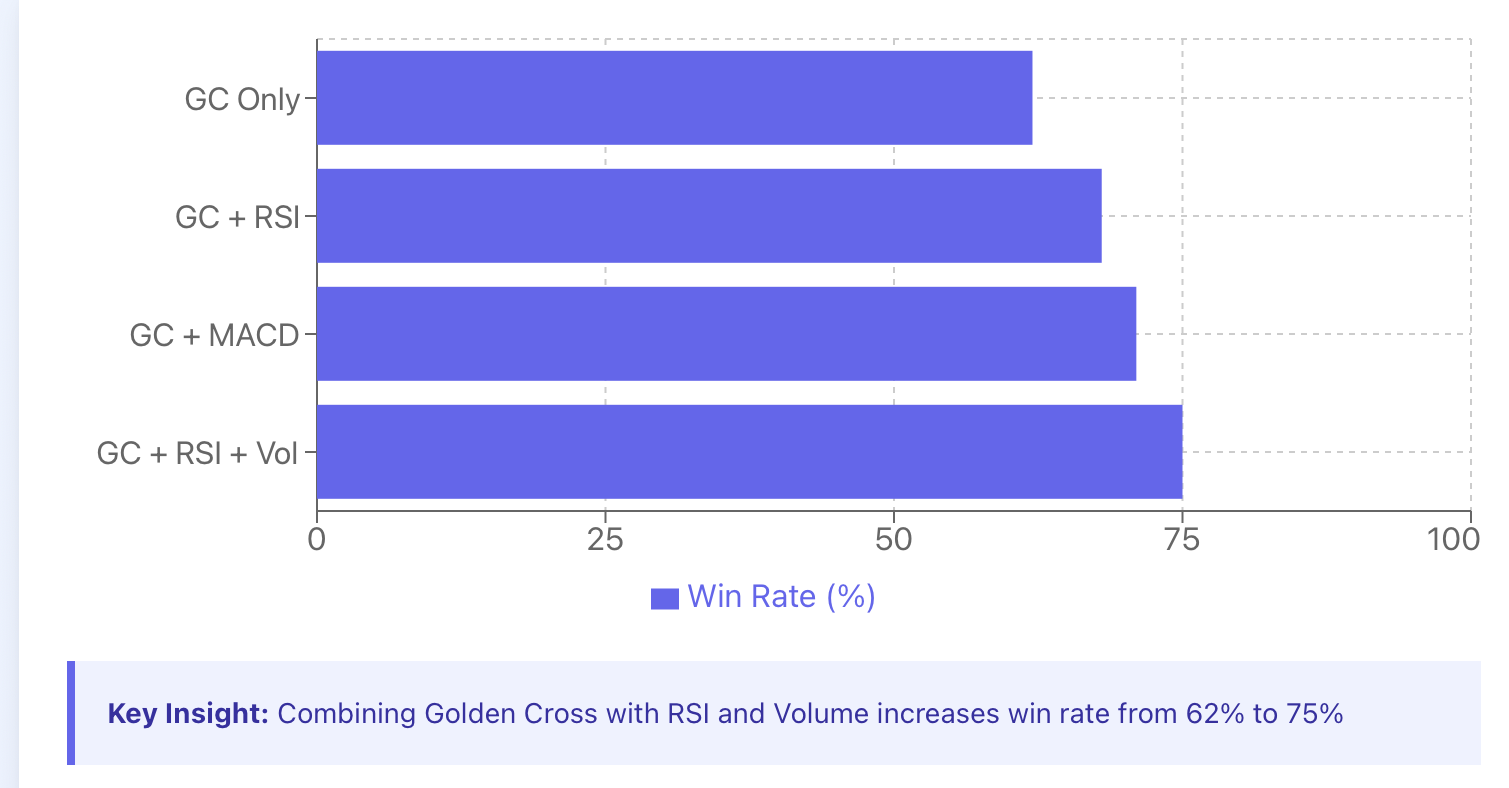
The RSI (Relative Strength Index) is a natural fellow traveler. The best time to form a Golden Cross is when the RSI is between 40 and 60 because it indicates the stock is not too overbought and has plenty of room to run. If the Golden Cross occurs and the RSI is above 70, you are looking at a stock that is a runner that was too exhausted to pass someone. So yes, it may be out in front, but "can it sustain it?"
The MACD (Moving Average Convergence Divergence) is used for confirming trends. If the MACD crosses over the signal line of MACD around the same time as the Golden Cross occurs, you have a double confirmation of momentum shift. In 2021, Tesla formed the Golden Cross, and it did so with MACD confirmation. It ran hard for months. When it formed in 2022 without MACD confirmation, it didn't last long.
The Bollinger Bands are used to gauge volatility and potential strength of a breakout. If the Golden Cross occurs as the price breaks above the upper Bollinger Band, that would indicate strong momentum. If it were to occur while price was merely just meandering around the middle band, you would have a less strong signal.
It's also important to pay attention to volume indicators. On-Balance Volume (OBV) and Volume Weighted Average Price (VWAP) in particular are good ways to confirm whether institutional money is supporting the Golden Cross or if retail traders are simply chasing a signal.
The idea is not to throw indicators at your chart until it looks like a Christmas tree. Choose two or three indicators that fit within the context of your strategy -perhaps it is a Golden Cross, combined with an RSI and volume, or maybe it is a Golden Cross indication and MACD along with support and resistance. The indicators should tell a cohesive story as to what is happening with the stock.
How Market Conditions Change Everything
A Golden Cross in a bull market acts like a tailwind. Everything works. During the 2020-2021 bull run, Golden Crosses on major indices produced solid returns because the overarching environment was favorable. Money was going into equities, interest rates were low, and there was an economic recovery happening.
Bear markets are different animals. The 2008 financial crisis generated several Golden Crosses, which all failed miserably. The technical signal said "buy," but the fundamental backdrop was screaming "sell." The traders that bought all got crushed, as they ignored the larger context and signal. In bear markets, it is certainly not worthless, just a lot less reliable than to the upside.
Sideways markets are where Golden Crosses become very problematic. The signal emerges, you're excited, you go long, and then the stock just chops around for weeks or months. No sustained movement in either direction. This happens because moving averages are lagging indicators, so by the time they signal a change in trend, the actual trend has already been exhausted.
Variations in sectors are crucial. Technology stocks may respond favorably to Golden Crosses during innovation cycles and when the economy is expanding. Energy stocks may move more with oil prices than with technical signals. Financial stocks may prioritize interest rates and economic data as indicators over price patterns.
The 2020 pandemic crash and subsequent recovery provide a perfect case study. The Golden Cross that developed at the end of June 2020 on the S&P 500 was compelling because the Fed had just deployed unprecedented stimulus. The indicator was consistent with the fundamentals. Compare that to the Golden Crosses of 2022 which were all during a bear market environment where inflation and rate hikes were present. Same indicator, completely different outcomes.
Risk Management: The Difference Between Surviving and Thriving
Are you curious about what distinguishes profitable traders from the rest? It’s not that they find better signals. Instead, they are better at managing risk when signals do not work.
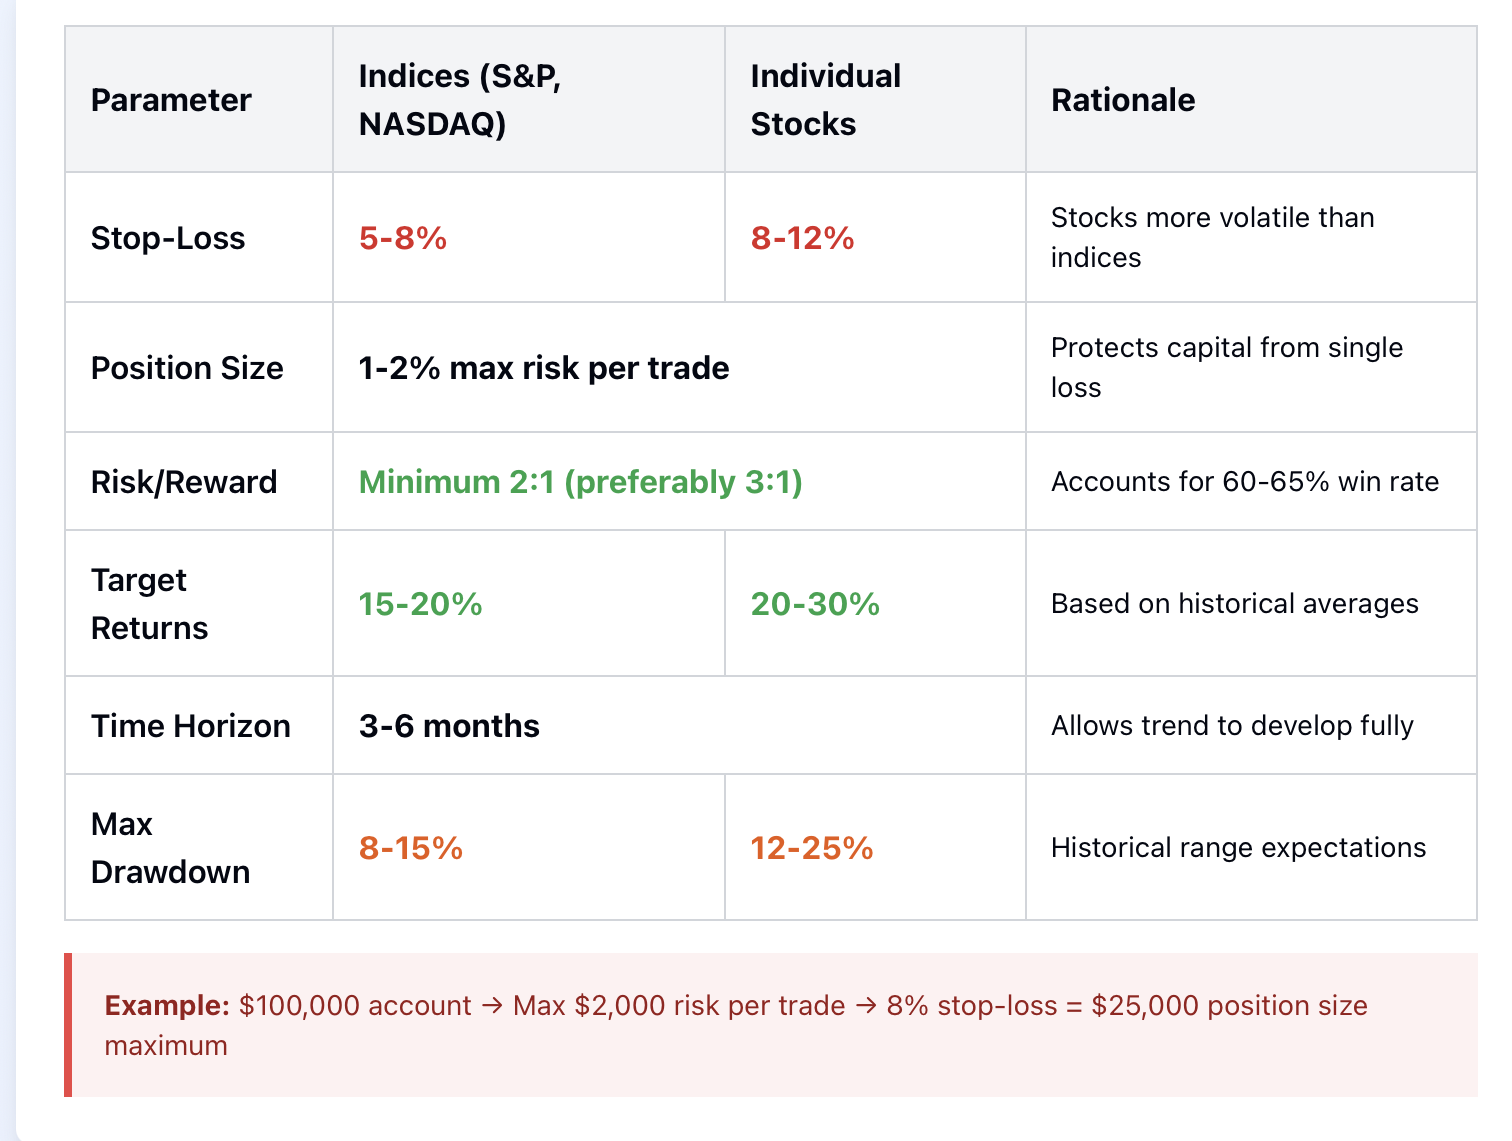
Stop-losses are a necessity. I think a reasonable stopping point is at least 5-8% from the Golden Cross entry point on indices and 8-12% for individual stocks based on their volatility. The directive of the stop-loss should depend on the stock's volatility and your risk appetite.
Position sizing is important, more than many traders realize. Just because you see a Golden Cross doesn't mean you have to put your whole account into that trade. Many traders follow a rule of not risking more than 1-2% of their portfolio on any given trade. So, with a $100,000 dollar account, that means losses would not exceed $1000-2000 per position.
The risk-reward ratio should drive your actions. If you're risking 8% on the downside, you need to be targeting at least at a minimum 16-24% on the upside. Generally speaking, anything less than two-to-one reward-to-risk is usually not worth taking into consideration the historical Golden Cross rate of success between 60-65%.
Take-profit targets also need planning. Some traders take profits in increments, for example, at 10% profit, then 20% profit then 30% profit, and trail the stop on the rest. Others use technical levels, such as prior resistance levels, or Fibonacci extension levels to take profits. The key is to have a target price before you enter the trade.
Historical volatility of Golden Cross trades in the S&P 500 have shown average price movements of 15-20% in price from entry to exit. Utilize that information to adjust your target price and position sizing. A stock that typically moves 30% after Golden Crosses, uses a different position sizing strategy than a stock which moves 10%.
Real Trading Examples: Theory Meets Reality
Let's discuss some real-life trade examples because at some point, the abstraction can only take you so far.
Case 1: The winner for our example, Apple's Golden Cross in May of 2023, came on high volume with an RSI reading of around 55. MACD turned positive. The stock was trading at about $175. A trader bought in at $177 after confirmation, placed their stop at $163 (8% below the entry price), and targeted $212 (20% gain). Over the next 4 months, Apple rallied all the way to $195, hitting his initial target. The trade went well because the technical aspect (the Golden Cross), volume, market environment (gaining momentum), and risk management (stop loss) aligned meaningfully enough to allow this trade to develop.
Case 2: A loser example, Microsoft's Golden Cross, gave a signal in November 2021 at around $340. It looked good on paper, but the RSI was a bit elevated at 68. Regardless, the Golden Cross was OK. A trader bought in at $345, with a stop at $318. Within two months, the market started to correct and Microsoft broke the stop, resulting in an 8% loss. What is the lesson here? Even if it is a good signal, it can still fail you when the market starts to go against you. The trade followed all the technical rules outlined above, but there was negative macro (Fed tightening some) pressure enough to win this trade.
Case 3: The Combination Strategy Win Tesla in early 2020, approximately $180 (pre-split adjusted). Golden Cross was established, confirmed by MACD. RSI was somewhat neutral at 52. Volume was also pushing higher (the day after the Golden Cross occurred). A trader was interested, entered the trade at $190, placing a stop at $175, and had multiple targets at $220, $250, and $280. Tesla exploded to over $400 within months! Taking partial profits on the way up took what started as a good trade turned into a great trade. This example shows having multiple indicators and a scaling-out strategy can help to maximize winners.
None of these were cherry picked to make Golden Crosses look perfect. These were realistic situations with both winners and losers, but where the winners demonstrated confirmation and risk management techniques, and the loser ignored the market as a whole. That's the main point of this exercise.
Mistakes That Cost Traders Money
The primary mistake? Assuming a Golden Cross is a reliable buy signal. It is, but it is not a certain bet. It is a probability-based indicator that works more frequently than it fails under the right conditions, but "more frequently than it fails" does not mean it will work every time.
Another fatal mistake is ignoring volume on the Golden Cross. A Golden Cross on weak volume is almost meaningless, just rumors without substance is a useful analogy here. Volume means real money is behind the move. Without volume, you are just reacting to lines crossing on a chart.
Finally, chasing signals that are lagging is always happening. Moving average take a backward-looking view by definition. By the time you see a Golden Cross, a stock could have rallied 10-15%. You are now buying late. The best strategy is to wait for a pullback after the cross or add confirmation indicators that show a potential for continuation.
Another major mistake is trading Golden Crosses in the wrong market environments. They perform very well in trending markets and do terribly in choppy or range-bound markets. If the market was range-bound for weeks or months then that Golden Cross metric is likely a trap.
Additionally, overleveraging with no flexibility in your signals is financial suicide. And just because you think the Golden Cross is a signal doesn't mean you should jump in with 50% of one trade. This is why we employ diversification and position sizing rules in the first place.
Lastly people forget the Death Cross, which is simply the opposite signal when the short term average crosses below the long term average. If you do Golden Cross action trading, you should also have an exit strategy. The Death Cross would be the most common exit signal and gives the strategy some good symmetry (the opposite signal for an exit).
Taking Action: Your Golden Cross Trading Plan
Now that you have this knowledge, what should you do? You might want to start with some paper trading or a simulator. It is perfectly acceptable to test Golden Cross strategies without risking your capital, until you know how they are likely to work in actual trading, and across various market conditions. You can track your hypothetical results, and keep track of what worked and what didn't work.
When you are comfortable trading real money, you are going to want to trade small- Don't use size to have an emotional reaction to a trades outcome. Use size based upon risk, and the rule of 1-2% or some other limit on maximum risk per trade or per position in your trading account.
Use multiple indicators, with a purpose, not just to have more indicators. For instance, using a Golden Cross with an RSI indicator with volume makes for a three-way system of confirmation which is often sufficient. Adding more indicators simply clutters your decision making process.
Maintain a trading journal, weekly, monthly and after every Golden Cross trade. Write down the entry price, stop-loss, target, reasoning and the outcome. Review the journal on a monthly basis. Your findings should not just be determined by outcome, they should identify tendencies in your process of decision. Maybe you're exceptional at seeing signals, but bad at managing a winner trade. Or, maybe you are too conservative when you size a potential trade. These tendencies will be better measured by a journal.
Be consistently aware of the current market conditions. If you successfully used a Golden Cross strategy last year, it might no longer be effective this year if the macro environment changed. The flexibility of a trader is way more important than strictly following rules.
The Golden Cross isn’t a holy grail, but it’s a viably useful metric when executed correctly. When placed in conjunction with proper risk management, market awareness, and continuous learning, you will have a true edge in the markets.
Ready to put your Golden Cross knowledge to work? Stop analyzing from the sidelines. Open that simulator account today and start tracking real-time signals. The market won't wait for you to feel "ready enough."
Disclaimer: The content of the blog does not represent any position of Trade W, does not serve as any trading-related decision advice, and does not endorse any third-party.