
 Trade W
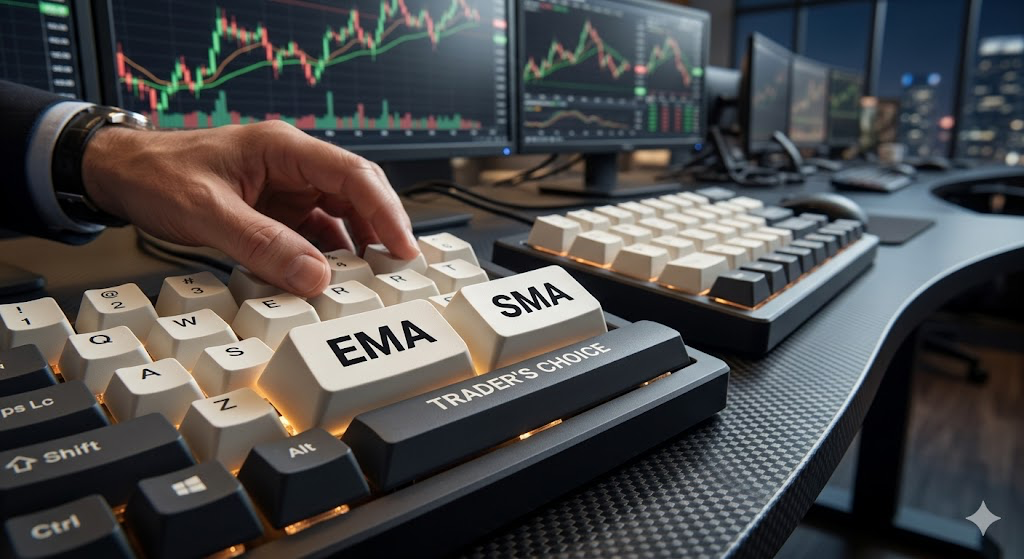
The Hanging Man candlestick is the only candlestick on its own that may give you an indication that the market may be about to roll over before the masses have had an opportunity to notice it. The Hanging Man has been an integral part of how traders across all asset classes (forex, crypto, CFD) determine when bullish momentum is starting to weaken prior to a price decline.
What is a Hanging Man Candlestick?
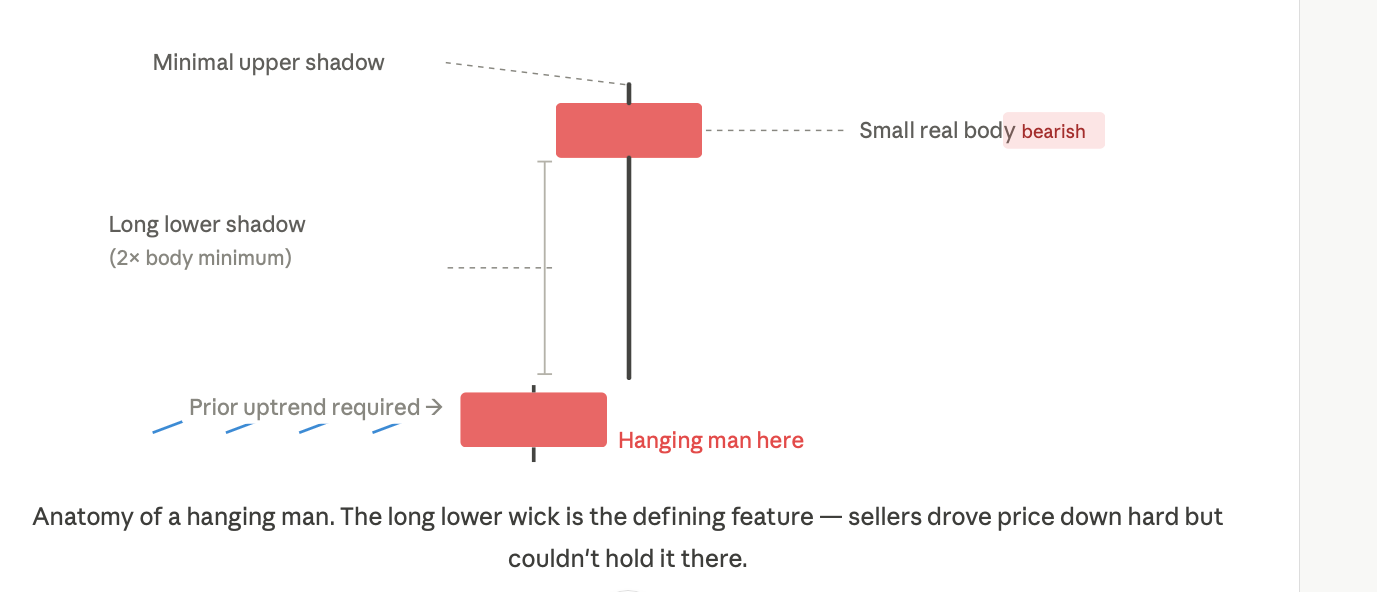
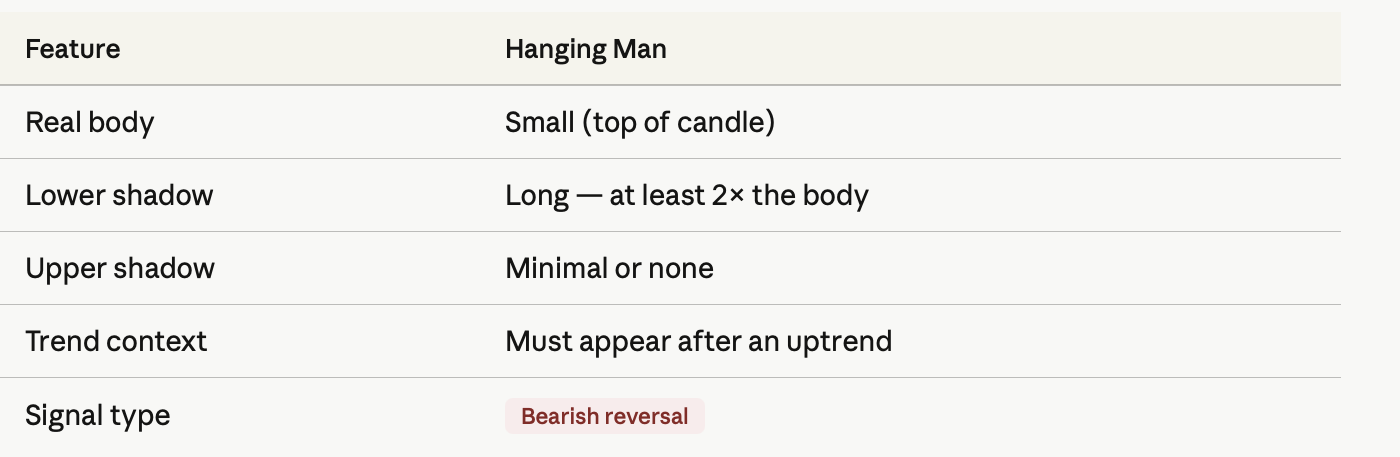
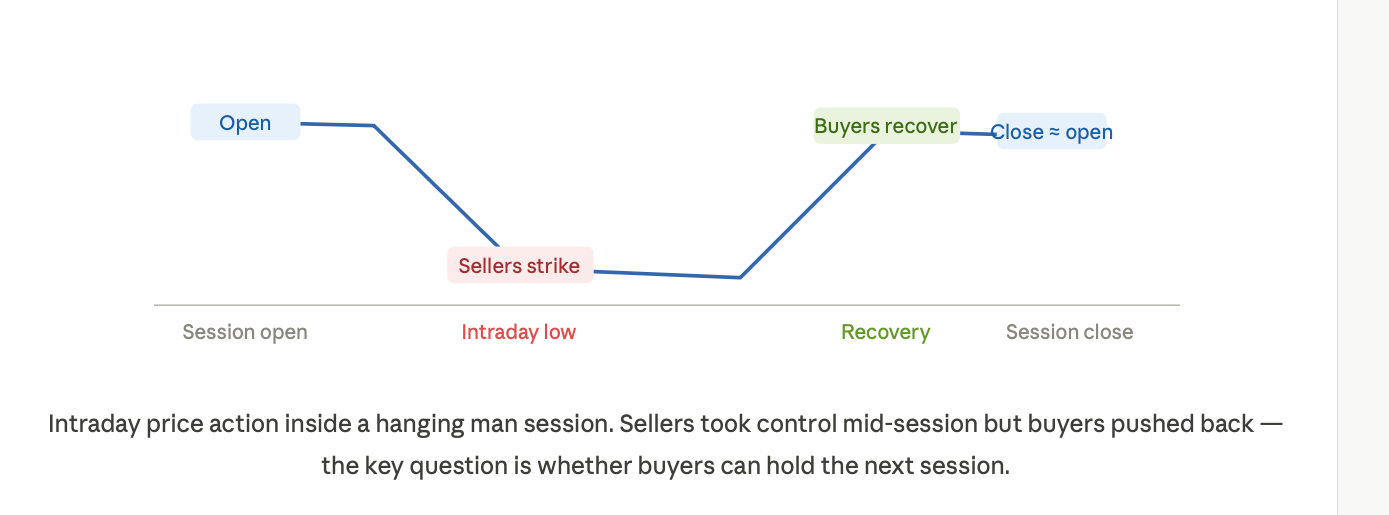
The Hanging Man is formed when the market opens at or very near the high of the session, trades down substantially below the opening price throughout the session, and then returns to just below the opening price at the close. It is formed by a very small body at the top and a very long tail pointing downwards, with the length of the tail at least twice the length of the body. An upper shadow (wick) is not required.
The Hanging Man can be either red or green when it closes. The market, and especially the trading community, tend to identify the Hanging Man by the colour of the candlestick body, but in reality, it is more about its position and context than the colour of the body. A green Hanging Man at the peak of a bullish rally will clearly indicate to investors that the bullish trend is now under threat.
In the case of the Hanging Man, the market has been building bullish momentum. Therefore, it creates a risk whenever it appears independently of the continued uptrend. For example, if the market is moving sideways, such as in a long-term trading range, you could also have a Hanging Man. This would not be perceived as a warning sign.
Therefore, it is critical that traders confirm the upward trend prior to utilising a Hanging Man as a potential action point.
The Pattern's Behavioural Factors
The longer a market advances sideways, with both buyers and sellers seeing no incentive to act, the less certain the crowd feels about where it will go next. But when there is an unexpected decrease in price for some period before a market's advance takes place, known as "dumps" or pullbacks, the market may give the impression of going lower than the previous week through a series of negative experiences.
A "hanging man" pattern occurs when the current day's close is significantly lower than the prior day's close. The prior day's close would typically show a significant market drop, which is followed by an immediate drop back to the original price on the following day. This creates a Hanging Man candle that the crowd would have perceived as a reliable indication to sell into the rally. As described above, the truth will usually be the opposite of what most expect.
Same Candle - Different Story: Hanging Man vs Hammer
Many newer traders get befuddled here. The hammer looks identical to the Hanging Man candlestick pattern. Both patterns consist of a small body and a long lower wick, with little or no upper wick. The only difference between the two patterns is where they appear on the chart.
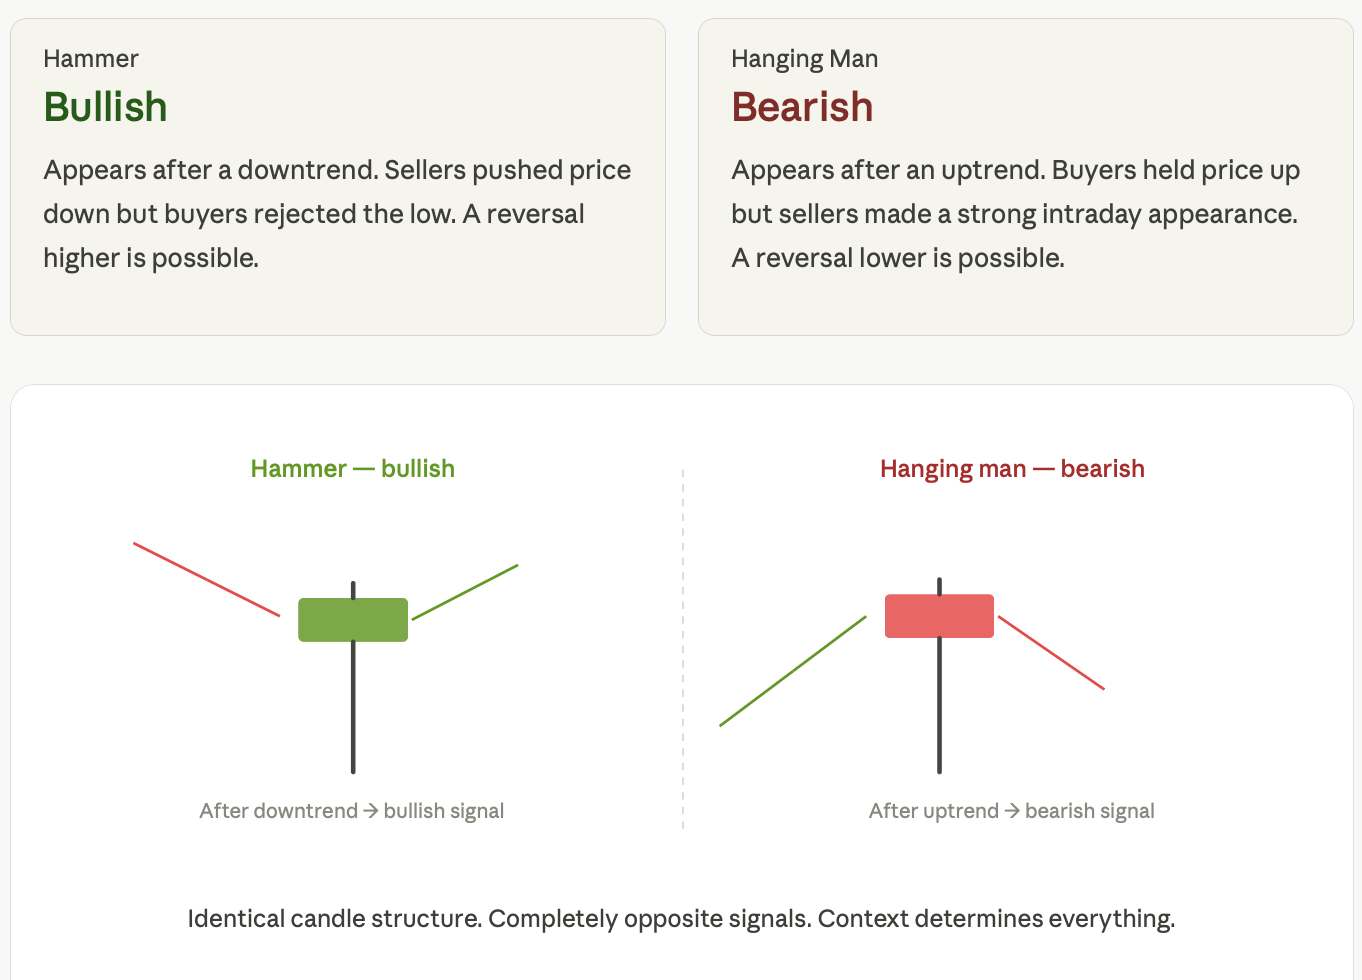
Identifying a Hanging Man on a real-time chart has four steps
The first step is "look back". Price must have been in an uptrend for at least several price bars before a Hanging Man forms. One candle in a sideways market isn’t enough to constitute a Hanging Man. The second step is to measure the length of the lower wick of the Hanging Man, which should be at least 2x the length of the real body of the candle. The next step is to measure the length of the upper wick of the Hanging Man, which should be very short or absent. The last step is to wait. One Hanging Man does not confirm a change in trend direction.
Volume also helps to identify a Hanging Man pattern. If there isgreater-than-averagee volume associated with the Hanging Man pattern, it adds more validity to the reversal occurring during that time frame due to the fact that there were numerous participants involved during that particular selling session.
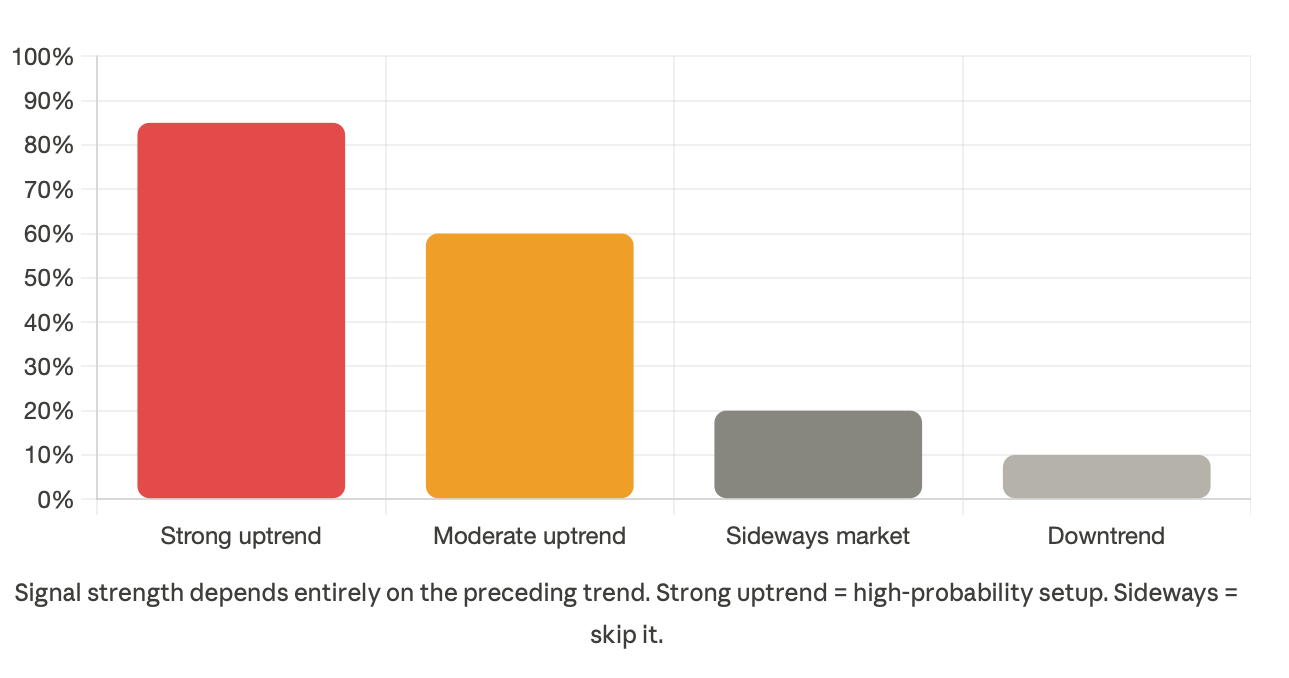
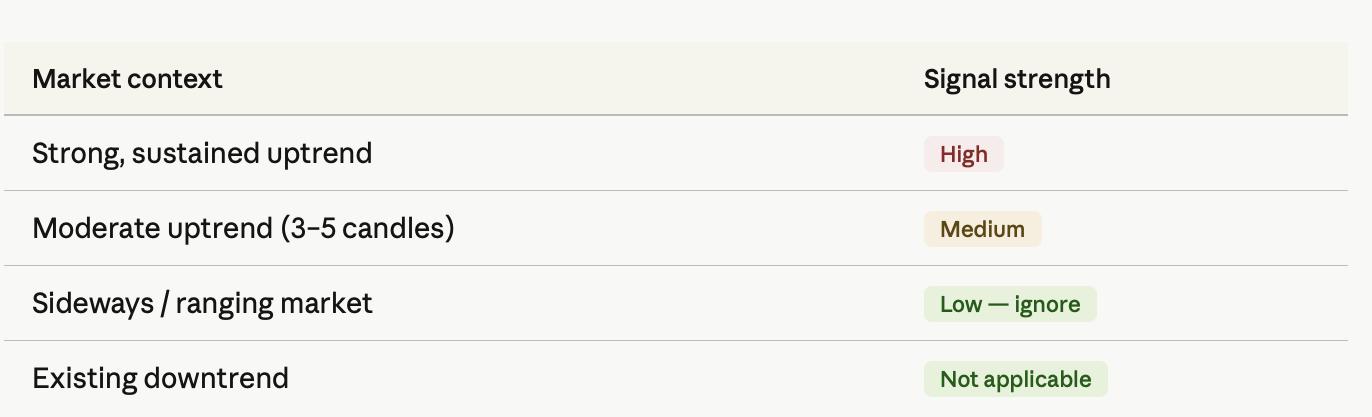
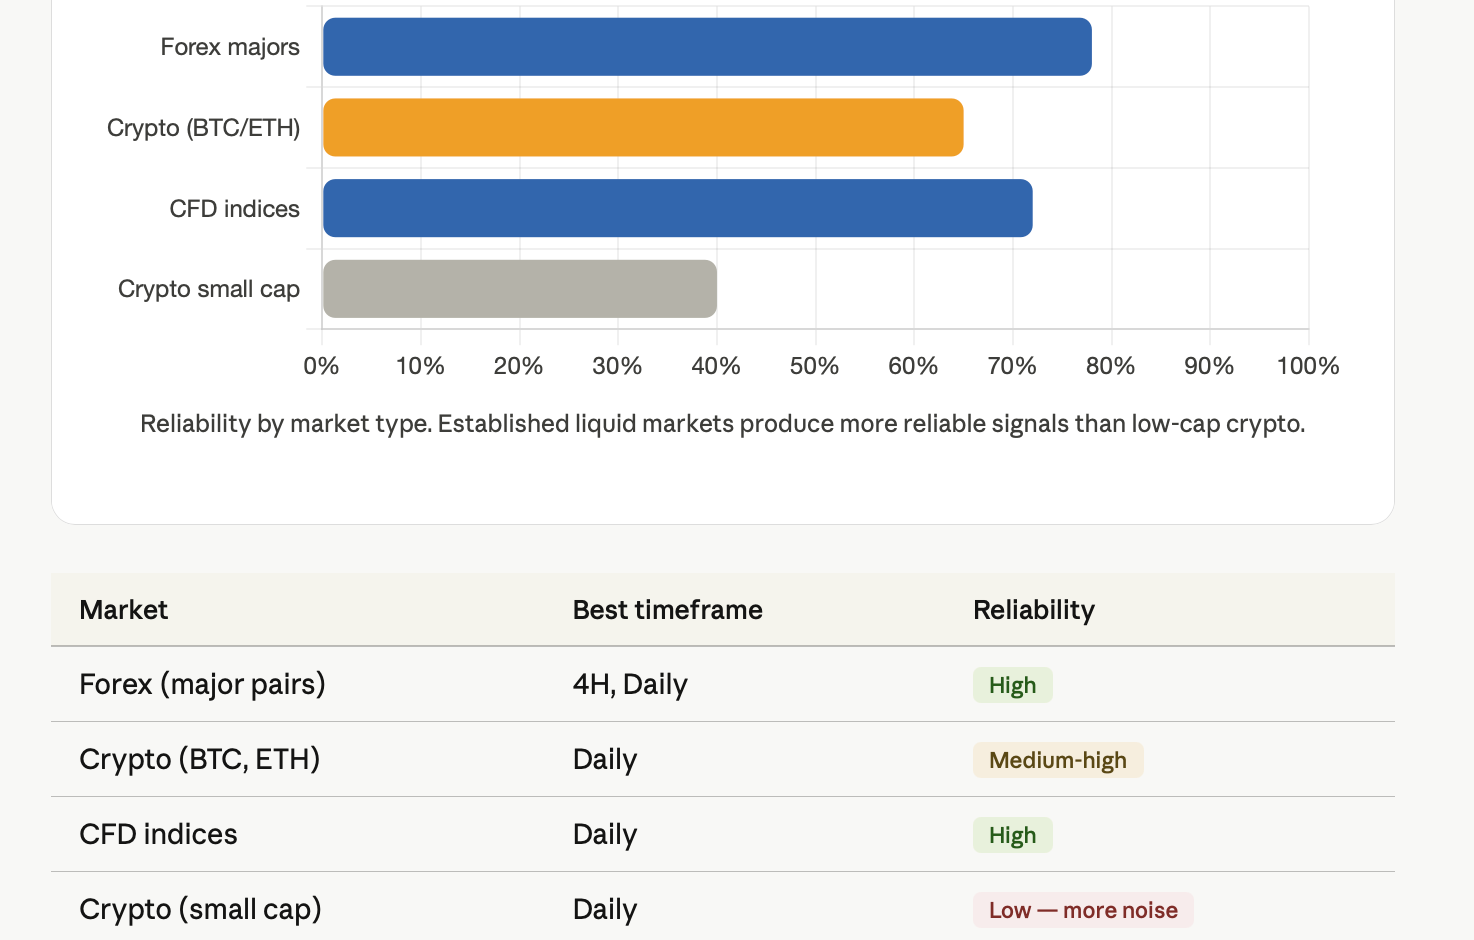
Signal Strength by Market Context
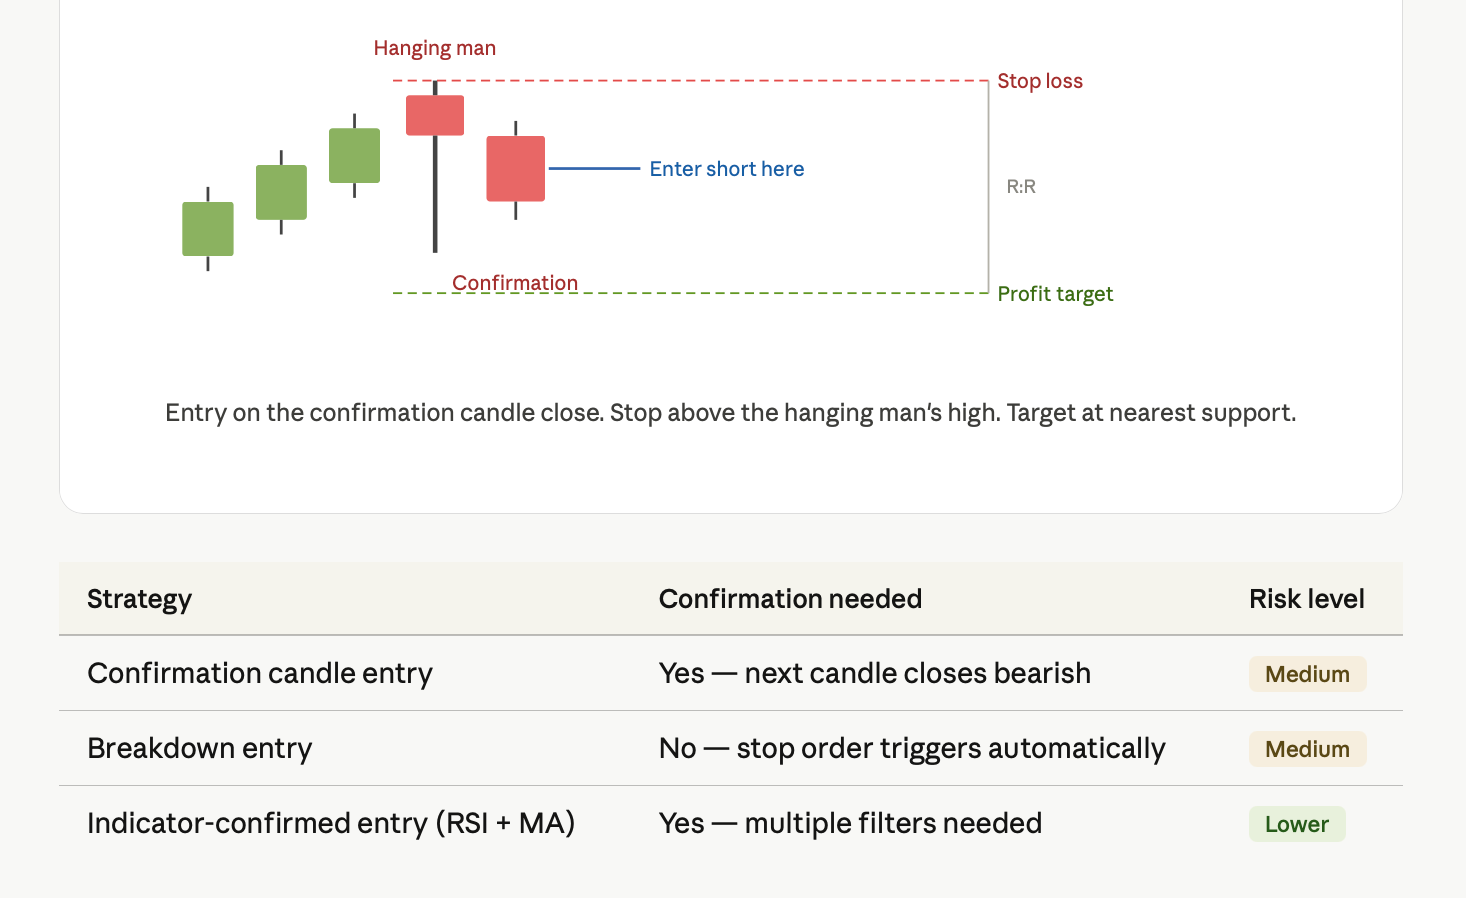
Trading strategies can be broken down into two main types of entries
Confirmation candle entry — Wait for confirmation, which occurs when the candle after the Hanging Man closes bearish. Once this happens, you can enter into a short position (sell). At this point, you place your stop loss above the high of the Hanging Man pattern, and you take your profit at the next support level.
Breakdown entry — To take this approach, you place a sell stop order below the low of the Hanging Man pattern. If the price breaks below this level, your sell stop order will automatically trigger. This allows you to make trades without watching your computer screen. However, if the price drops sharply or gaps down, you might miss entering the trade altogether.
Common Errors to Stay Away From
The most common mistake made by novice traders is to buy a Hanging Man without confirming that there was an uptrend previously. The second most common mistake is to buy the Hanging Man without confirming it first. The third most common mistake is ignoring trading volume altogether.
When a Hanging Man candle shows real dominance of one shadow over the rest of the candlestick, the Hanging Man must have a significantly larger upper shadow than lower shadow, or an upper shadow that is only slightly longer than the lower shadow will not qualify as a valid confirmation of the open and close of the previous day's Hanging Man or candlestick as well.
One more confirmation candlestick incurs no additional expense to trade; however, one more confirmation candlestick helps confirm any reversal in price direction.
Hanging Man Pattern for Forex, Crypto, and CFD Trading
Hanging Man trading patterns work regardless of the market; however, they tend to show up frequently in Forex markets during the 4-hour and daily timeframes. Furthermore, many of the major currency pairs, such as EUR/USD, USD/JPY, etc., typically offer the best quality signals; however, many of the less liquid currency pairs produce much more "noise" than liquid currency pairs.
The cryptocurrency market generally magnifies any Hanging Man pattern. Therefore, when a Hanging Man appears on Bitcoin at or near its all-time high, the Hanging Man pattern carries a significant degree of weight; however, confirming the Hanging Man is even more critical due to the extreme volatility that often exists in each crypto trading session. Lastly, traders should be mindful that using leveraged positions in CFD trading will increase the effect of being wrong about a Hanging Man by a much larger margin of loss than would have occurred had they traded the same level in a non-leveraged position.
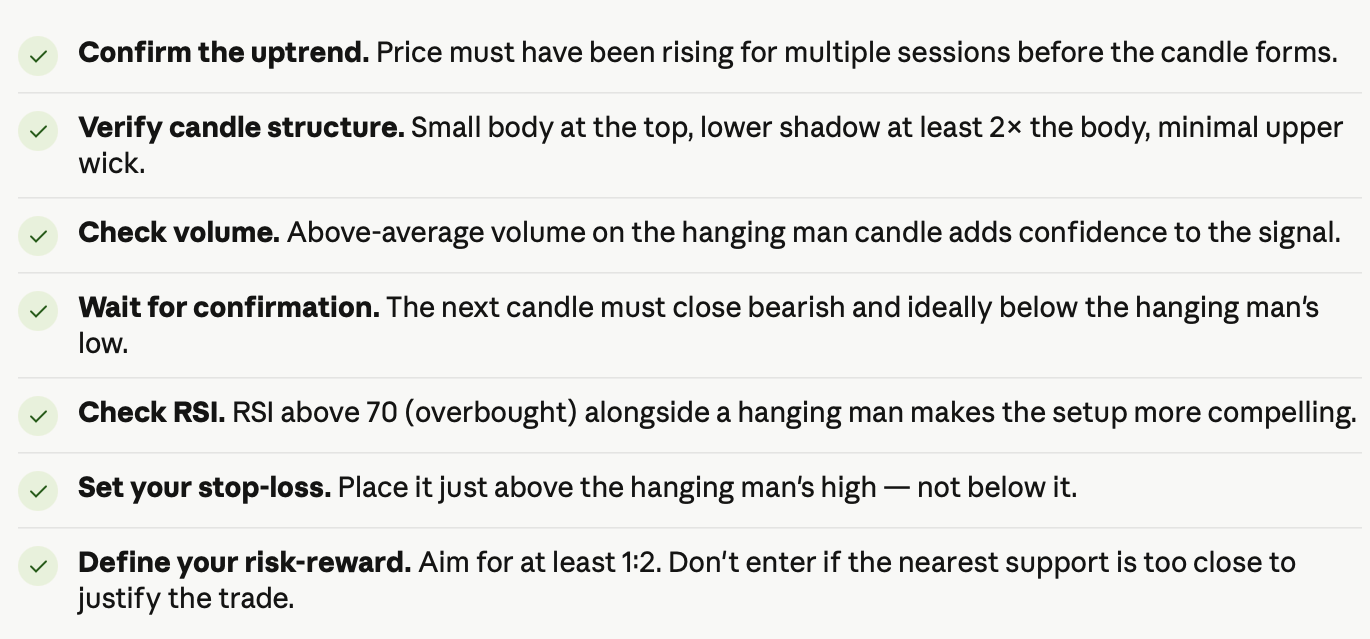
The Trading Checklist
FAQ
What is a Hanging Man candlestick?
A bearish reversal pattern that forms after an uptrend. It has a small real body at the top, a long lower shadow, and little to no upper shadow. It signals that sellers briefly took control intraday.
Is a Hanging Man candlestick bullish or bearish?
Bearish, but only when it appears after an uptrend. The same candle in a downtrend is called a hammer and signals a bullish reversal.
What does a Hanging Man candle indicate?
It indicates that buyers are losing their grip. Sellers pushed the price down hard during the session, and while buyers recovered the close, the intraday weakness suggests the uptrend may be running out of steam.
What's the difference between a Hanging Man and a hammer?
They look identical, with the same small body and long lower shadow. The difference is context. A hammer appears after a downtrend and signals a bullish reversal. A Hanging Man appears after an uptrend and signals a bearish reversal.
How reliable is the Hanging Man candlestick?
On its own, it has moderate reliability. Combined with confirmation candles, overbought RSI, high volume, and a strong prior uptrend, the reliability improves significantly. Never trade the pattern in isolation.
How do traders confirm a Hanging Man reversal?
By waiting for the next candle to close bearish below the Hanging Man's low. Some traders also add RSI divergence or moving average crossovers as additional filters before entering.
Practice identifying Hanging Man setups on live charts with TradeWill's interactive charting tools and trade them with confidence, not guesswork.
Disclaimer: The content of the blog does not represent any position of Trade W, does not serve as any trading-related decision advice, and does not endorse any third-party.