

 Trade W

Why the Head and Shoulders Pattern Still Dominates Market Reversals in 2026
If you've put in the time and effort to study technical analysis, there's a good chance you've also come across the head & shoulders pattern and seen examples of traders getting burned when they clearly spotted the pattern on the chart. This guide is designed to provide insight into this contradiction.
The pattern in and of itself is fairly straightforward; however, several factors will determine why it forms, what the formation tells you about the type of trading taking place, and how to create a disciplined trading plan using the formation, rather than simply reacting to a shape showing up in front of you.
The head and shoulders formation has been seen in almost every trading market, including the Forex market (EUR/USD, GBP/USD), equities (S&P 500, AAPL), commodities, and cryptocurrencies (BTC/USDT). Because the head and shoulders formation appears consistently across all markets, this means that there is something universal, or fundamental, about the head and shoulders formation with respect to how momentum breaks down and how control changes from buyers to sellers as a trend comes to an end.
This dynamic has consistently played out in the same manner across all liquid markets, which is why this pattern has remained relevant to traders for many years, despite changing conditions within each market.
Beginner traders take a completely wrong approach towards the head and shoulders formation by focusing on the shape of the pattern as being the signal to enter a trade. A pattern is not the actual signal for trade entry.
A pattern is a graphical illustration of the changes that are taking place in the trade market. A pattern visually displays the reduction of buying momentum and the increasing commitment of sellers within the market, as well as the shift from control between buyers and sellers. The combination of these dynamics makes the head and shoulders pattern more powerful than just a three-bump shape.
This guide will provide all the information you need to effectively use the head and shoulders pattern: the components of the head and shoulders, drawing them on charts properly; the psychology behind the pattern; identifying real setups versus false setups; a complete entry and exit plan for both bullish and bearish formations; and the costly errors traders make even when they correctly identify the head and shoulders formation.
What Is a Head and Shoulders Pattern?
The head and shoulders chart pattern is a bearish reversal structure that signifies a possible transition from an uptrend to a downtrend; it is comprised of three sequenced tops with the head being the highest peak and the left and right shoulders being lower peaks.
The neckline is drawn connecting the lows between the left shoulder and right shoulder, and once a confirmed candle closes below this level, the pattern is considered complete. Traders can utilise this pattern on all markets, including Forex, Equities and Cryptocurrencies, to assist with identifying potential tops, timing short entries, and determining targets based on the measured move calculation.
Head and Shoulders Structure: Components and Key Rules
To know the complete picture of the Head and Shoulders pattern, one must understand each of the components that make this pattern up, as well as the reasons for their location within the trend. For example, understanding where the left shoulder is located is essential to understanding the complete pattern as it relates to the price action of the underlying security.
Left Shoulder: The left shoulder occurs during the preceding trend. The reason for this is due to the buyers in the market pushing the price of the underlying instrument to a new all-time high with a considerable amount of participation by the buyers and a normal pullback into an "orderly" fashion.
There is nothing very unusual about this particular phase of the pattern. At this point, the price of the underlying instrument was considered to be in a bullish trend. As such, most of the traders who were involved in the trade were bullish on the outcome of the trade, and the pullback that occurred was simply viewed as a buying opportunity.
Head: The "head" is where the real story for the head and shoulders pattern begins to unfold. After the formation of the head, the price continues to rally, this time breaking above the previous ATH and forming a new peak that is above the ATH. To the novice trader, it would appear that this is simply a bullish continuation of the trend.
As the trader takes a closer look at the volume associated with the advance of the head, they will see that the volume during the advance of the head was significantly less than the volume that was present during the advance of the "left shoulder".
In any valid head and shoulders pattern setup, the volume associated with the head would be noticeably lower than the volume associated with the left shoulder. The price is making new highs, but there are fewer buyers participating in the market. As such, the market is beginning to show signs of exhaustion before the vast majority of the buyers have noticed it.
Right Shoulder: The right shoulder of the pattern serves as a confirmation of the market's exhaustion. After forming the head, the price will retrace back to the lows of the head and begin to rally.
However, the price will fail to reach the peak of the head and instead will form a lower high at a level that is almost equal to the low of the left shoulder. As the price of the underlying instrument has formed a lower high after the formation of the head, it indicates that the sellers are taking more aggressive action in absorbing the buy orders that are being placed into the market.
Additionally, the buyers who entered into the trade near the "head" are beginning to realise that they may be in a losing trade, and there is beginning to be more and more pressure on those buyers to exit the trade.
Neckline: The neckline is generally regarded as the most frequently misunderstood and one of the most important components of the head and shoulders pattern. The point of confusion for many traders when dealing with the neckline is that many of the beginner training programs will draw the neckline horizontally, as opposed to the reality of what a neckline typically looks like.
In reality, the vast majority of necklines are ascending when traders have had success in defending a higher price between the peaks of the pattern, and therefore, a reversal signal from the lower-priced neckline would be considered to be less urgent in nature and require stronger confirmation prior to taking any action.
An example of a neckline that is descending would merely reflect the ongoing aggressive selling pressure that has occurred between the peaks of the pattern and will typically create sharper breakdowns after the neckline has been violated. To draw the neckline, a trader will connect the low that was formed after the left shoulder with the low that was formed after the head.
For a head and shoulders pattern to be considered complete, a trader must wait for the close of a full candlestick below the neckline, with significant momentum, to confirm that the neckline has been broken. A wick only represents noise and therefore does not provide a reliable confirmation of a head and shoulders pattern signal.
The inverse head and shoulders should be viewed oppositely, as they form during a downtrend and represent the potential for a bullish reversal. As a rule of thumb, traders can apply everything they learned in the bearish head and shoulders pattern to an inverse version.
To fully understand the head and shoulders pattern, traders should think of the three major components as the three separate lower energy attempts to push prices to a higher price. The amount of pressure from buyers is still present; however, each of the buyers involved in this particular trade has progressively become less willing to pay higher prices over time, and, at some point, the sellers will recognise the pattern's exhaustion and enter the market aggressively to short the underlying security.
Market Psychology: How Momentum Exhaustion Creates Reversals
Head and shoulders do not just randomly show up. The head and shoulders are created by a psychological process between buyers and sellers, and the trader who views that psychology correctly will profit from the pattern, while the trader who views the psychology incorrectly will get stopped out of a false setup.
Volume Behaviour Across Pattern Phases
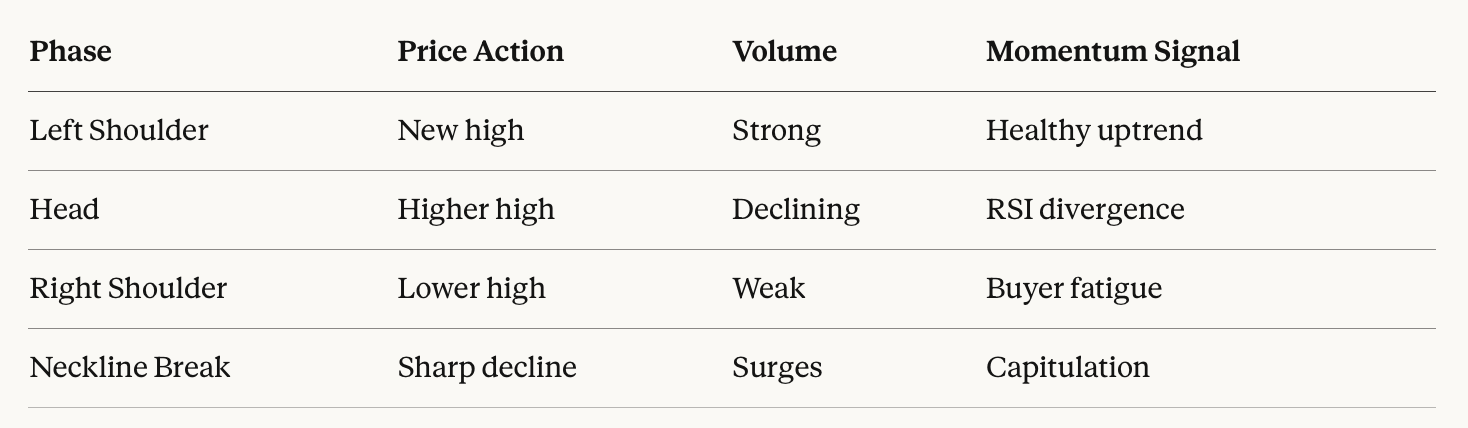
When looking at the left shoulder, you can see that the price and the entire market are overall bullish at that time. When the market reaches a new high or peak, it pulls back, and the buyers can still rely on their order flow due to the robustness of their volume. Because of this, most believe that order flow is going to continue.
Now, as we get to the price push into the head (or peak), on the surface level, it seems like buyers are still in control. The new high appears to be just another continuation of the trend. However, a closer inspection of the volume divergence shows that there are fewer buyers willing to purchase at these elevated prices. Momentum indicators (like the RSI) will often show that there is a bearish divergence at this stage, where even though the price moved higher than before, the RSI is making lower highs. Essentially, the market is using more energy to travel a shorter distance, a classic indicator that the trend is nearing completion.
The psychology of the market starts to become more evident at the right shoulder. After the pullback from the head, buyers try to make another push higher, but they do not have the conviction to make new highs. Instead of forming another peak at the same level as the head, they peak at a much lower level. The sellers are losing conviction and are absorbing every buy order with greater force. At this point, the ones who bought close to the head are now sitting on unrealised losses and are starting to look for exits.
The breakdown of the neckline creates a psychological shift. When the price breaks below the neckline, it creates a mechanical reaction. Stop losses are triggered, long positions are closed out in mass, and what occurred as a series of gradual transfer of control has now transferred suddenly and aggressively lower. Volume on the breakdown candle is usually much higher than normal, indicating that this is legitimate selling power rather than just a temporary dip below a previous support level.
Volume behaviour is one of the reasons you cannot classify every head and shoulders setup as equal. A head-and-shoulders setup that forms without a volume divergence across the three peaks is considered a psychological weakness for that setup; if the volume remains flat or even increases as the right shoulder forms, the narrative of buyer exhaustion is not present. Therefore, the predictive power of those setups is significantly decreased.
Real vs Fake Patterns: How to Confirm a Valid Setup
Most retail traders lose their money in this section. In this section, retail traders find three separate peaks on their chart and call them “head and shoulders”. They short these three peaks and end up getting stopped out clean when prices soar above the peaks. The process of pattern recognition without using confirmation will quickly deplete an individual's trading account.
The presence of a weak or invalid pattern can be identified by the right shoulder sitting much higher than the left shoulder. This indicates that the buyers have the ability to drive the price higher than previously reached by the left shoulder. If volume remains flat or has increased through the formation of the right shoulder, there is also no evidence of exhaustion of buyers through the right shoulder. Lastly, if a pattern is formed while the price is in a range and not at the conclusion of an established upward trend, it cannot represent a price peak within that range.
False-breakouts are among the most damaging traps of all. Prices will briefly break the neckline, triggering the entries of traders who entered on the breakdown, and then rally sharply up above the neckline. False-breakouts happen frequently within the crypto markets because of the dynamic of liquidity-hunting and stop-running as part of the micro-structure of crypto markets. Entering off a wick break of the neckline is one of the most expensive habits that a technical trader can develop.
Three confirmation rules improve accuracy substantially:
The first rule is to have a candle close below the neckline. The close must be a full body, not just a shadow.
The volume must have expanded when the neckline broke to confirm the seriousness of the selling. Volume expansion is important in differentiating between a legitimate breakdown of price versus a low-volume breakdown below support.
The final confirmation method is called the retest entry. The retest is typically the most powerful indicator of confirmation. When the price has broken through the neckline, the price will typically pull back down into the former support area from below.
If the price-resistance level holds, it can be utilised as strong confirmation that the neckline has permanently flipped based upon the initial move down through the neckline. Entering the retest will result in providing a narrow stop loss and provide you with a better risk-to-reward ratio, plus an additional confirmation that the price breaks below the neckline.
Therefore, using the retest will not only improve the accuracy of the trader but also allow the trader to enhance their overall results on a consistent basis.
Confirmation is always superior to prediction. Traders who consistently lose money during false-breakout situations are often traders who anticipate a pattern’s completion and do not wait for the market to confirm that it actually did complete.
Bearish Trading Strategy: How to Trade the Head and Shoulders Step by Step
If you are able to correctly identify the pattern, then that is half the battle won; however, the other half will depend on whether your trade plan is set up properly. In addition, you will ultimately determine how much money you can make as an investor by following through with the plan and maintaining discipline when it comes to adhering to your rules and using sound risk management practices.
Entry Methods Compared
The way in which a breakout entry occurs is with high confidence of price moving sideways, as breakout prices occur when a candle closes near or below the breakout neckline, with an increase in volume on the breakout day. The risk associated with the breakout entry strategy is greater than the breakout retest strategy because of the higher chance of false breakout signals. If a trader uses the breakout entry strategy, the trader must place their stop loss one tick above the highest price of the right shoulder, and this distance will be dependent upon the chart structure.
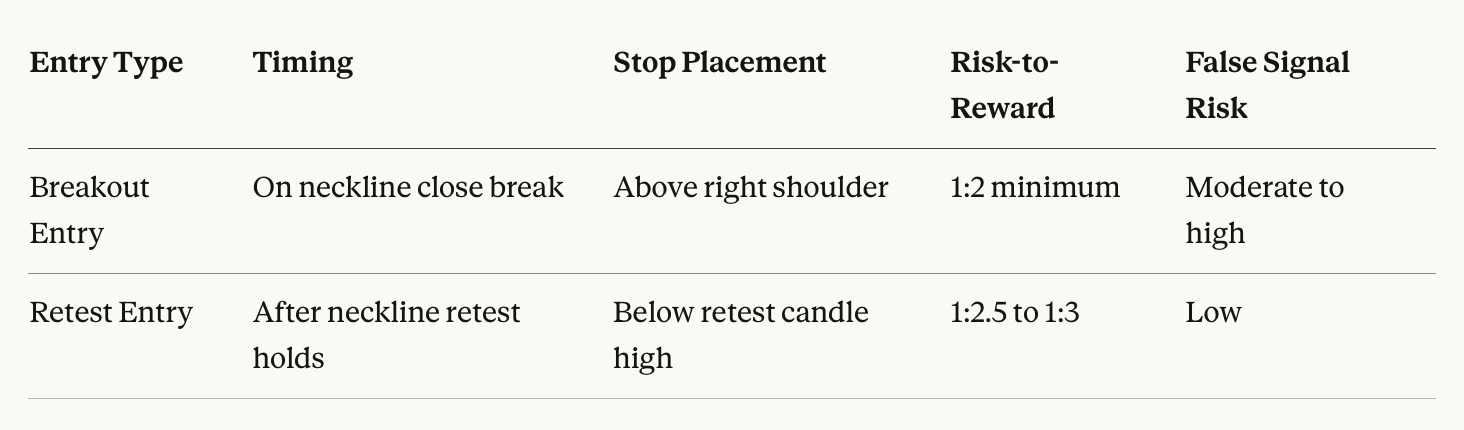
If using the retest entry strategy, the trader will wait to enter after the price has tested the neckline as additional confirmation of a true breakout, as the retest entry will allow the price to come back to the neckline as support, and if the price remains above the level after it broke the previous support level during the pullback, this gives additional confirmation that an area of former support has become an area of resistance.
By using the retest strategy, a trader has an increased level of probability that the breakout will continue in the direction of the original breakout because they are entering at the area of support and resistance after the price has tested the neckline as support.
Additionally, the trader will have an additional level of confidence due to the price testing the neckline as support after the initial neckline break, which will reinforce that the neckline has flipped from an area of support to one of resistance. The price at entry will be at a better price than if they had entered immediately after the breakout, and the stop loss is placed closer to the candle that has tested the neckline as support.
Take Profit Using the Measured Move
To calculate the ideal price target, we need to measure the vertical distance between the neckline and the top of the Head and project this same distance downward from where the neckline was broken. For example, if the Head has a peak of $100, and the Neckline has a value of $85, the Distance is $15, making the Ideal Price Target $70. It would be normal for many traders to take partial profits off their full target by exiting at the 50% level of the Ideal Price Target before letting their remaining position go toward reaching the entire target.
As with any type of breakout entry, achieving at least a Risk/Reward Ratio of 1:2 is a must. With retest-style entries, a Risk/Reward Ratio of 1:3 or greater is rather commonplace. While your win rate could potentially be below average for any single breakout pattern, your overall win rate will be much better if your Risk/Reward Ratio is intact for many breakout patterns over the course of time.
Bullish Strategy: Trading the Inverse Head and Shoulders
Located at the section of downtrend, an inverse head and shoulder forms an inverted top with two elevated tops. It looks like the end of a downward flow and is the beginning of a bullish trend, and signifies a possible change in trend. The inverse head and shoulder is characterised by three troughs, where the centre trough is located at the bottom, and the other two are at an elevation. The connection between the high points of these three troughs forms a horizontal line called a neckline. Once the closing price is above the neckline, the inverse head and shoulders confirmation is complete.
The mental aspect of this pattern is that there has been overexhaustion by sellers, and now there are more buyers and fewer sellers. The closing volume for the last move up above the neckline tends to be the highest of all three moves, thus confirming that selling to buying is strong.
Inverse H&S Trade Setup
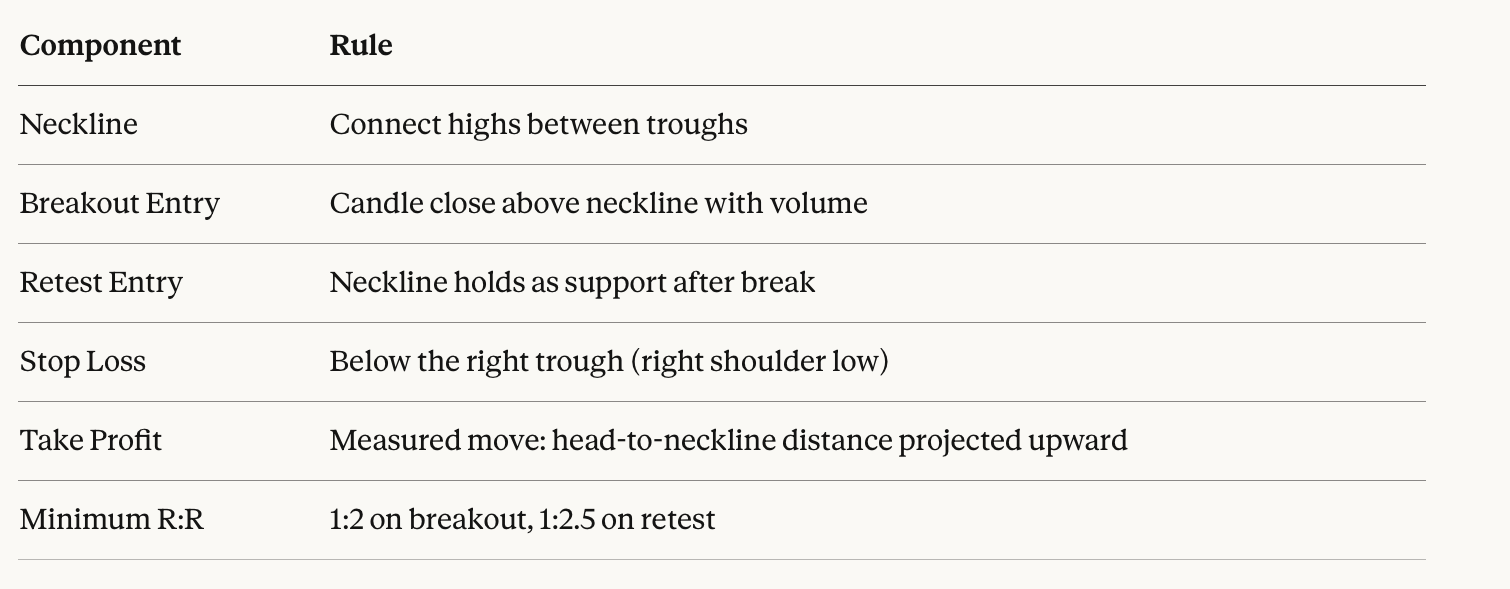
The inverse setup has a direct relationship with the importance of waiting for the retest prior to entering the market. Like any other bullish breakout in any market, a bullish breakout can create immediate resistive pullbacks immediately after the first impulse and enter into a corrective trend zone. It is common for traders to chase a neckline after seeing a bullish breakout that has occurred aggressively; this often results in traders chasing at the wrong price point, thereby entering at the worst potential price before the pullback occurs.
An example of this in real life occurred in early 2025. EUR/USD developed a very nice inverse head and shoulders pattern on a daily chart at or around 1.0550, and a bullish breakout occurred after the neckline at approximately 1.0700 broke; the price then retraced cleanly down to retest the neckline and went to its target of 1.0850. Traders who waited for the retest before further trade entry made a 1:2.5 trade, whereas traders who chased the initial breakout were shaken out during the retracement cycle before the real move occurred.
Why Most Traders Fail: 5 Costly Mistakes
Even traders who understand the structural logic of the pattern lose money on it regularly. These five mistakes account for the vast majority of failed head and shoulders trades.
Common Mistakes vs Solutions
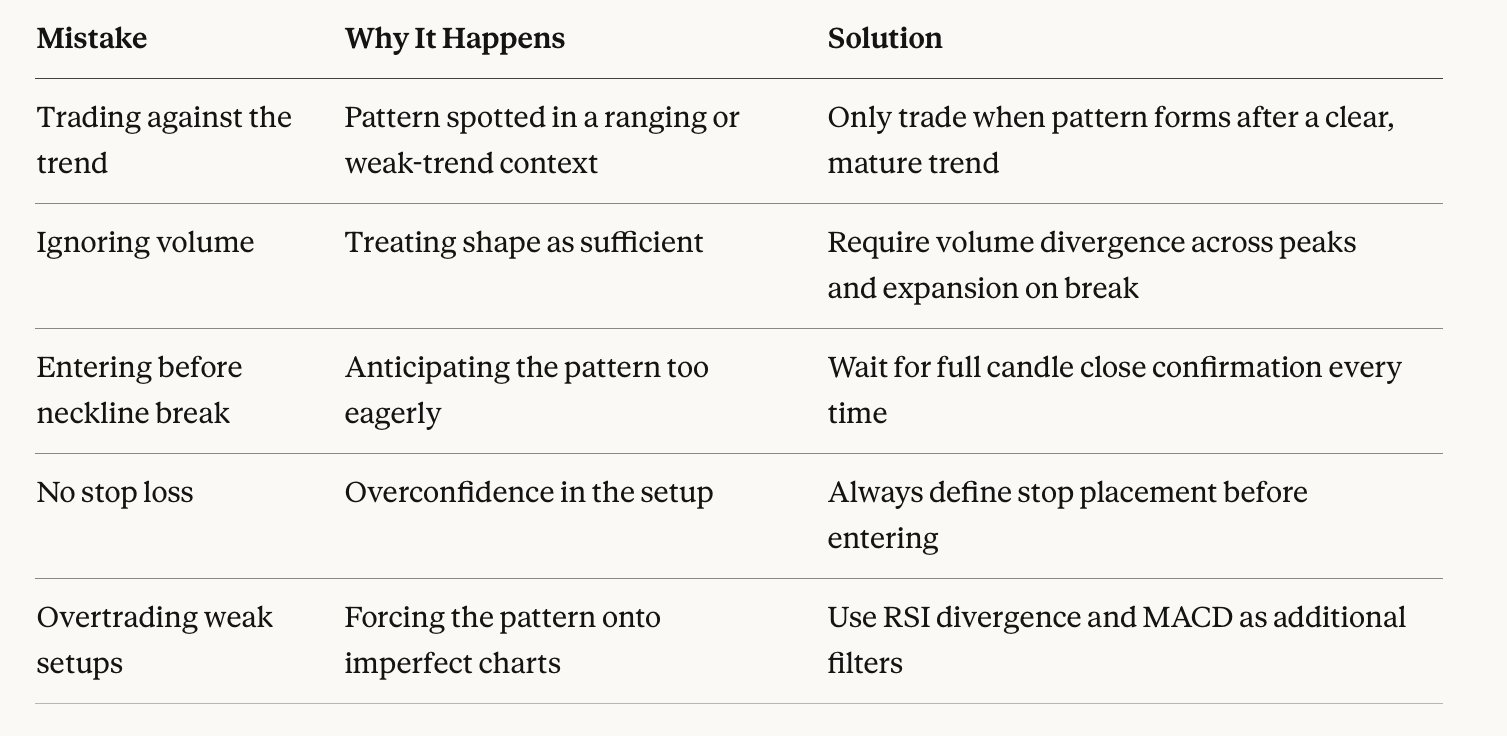
The reliability of a pattern occurring at the end of a mature, well-established uptrend is greater than the reliability of a pattern occurring in choppy or uncertain market conditions, since patterns that occur at the end of a mature uptrend have a much greater degree of reliability.
Volume is the second most significant way to damage trading accounts. A pattern will not hold the same 'psychological' significance if no volume divergence occurs between the three peaks. To substantiate the exhaustion narrative, declining participant volume must be evident.
Among traders who intellectually comprehend the pattern but are not able to patiently await confirmation, one of their biggest mistakes is entering a position prior to breakout confirmation of the neckline. The pattern is not considered to have 'completed' until the neckline has been broken, with everything before the neckline break considered merely a thesis, and not a trade.
Tools that can help increase the accuracy of trading decisions through supporting evidence of behind-the-scenes activity include: RSI divergence at the head, MACD crossing below the signal as price approaches the neckline, and carrying out a multi-timeframe analysis where the short-term pattern is coupled with the bearish structure of the longer timeframe.
Cross-Market Analysis: Forex, Crypto, Stocks, and Gold
Market Reliability Comparison (2025–2026)
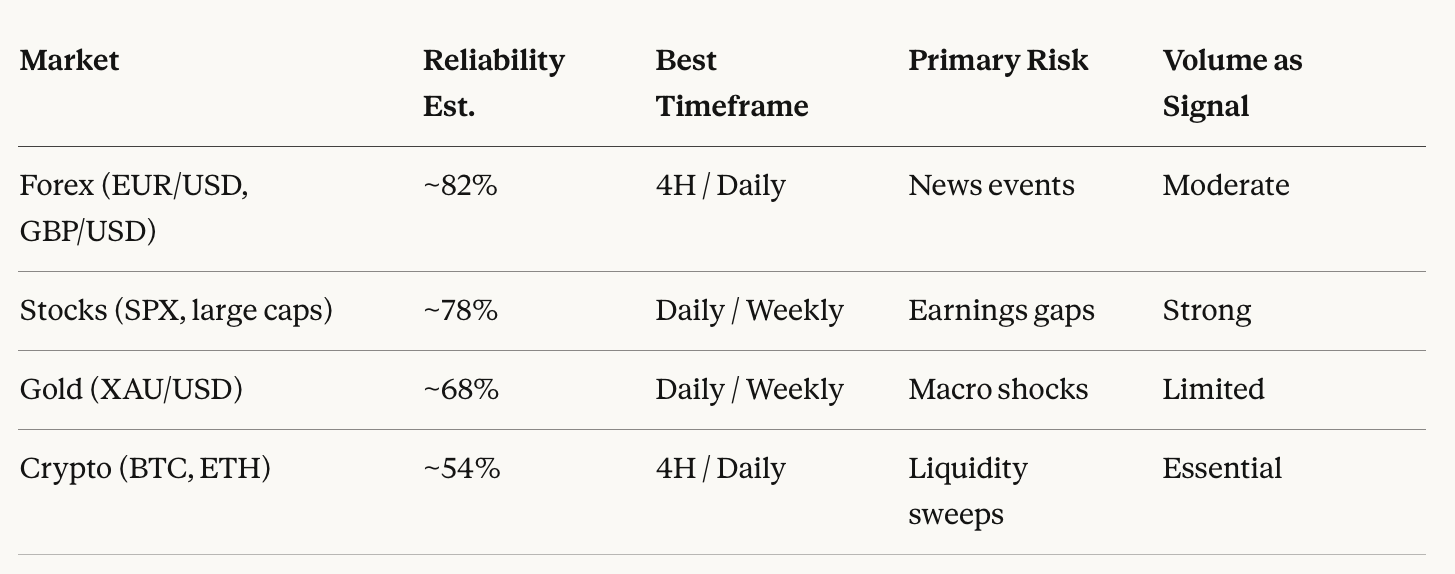
The forex market provides some of the highest-quality trading setups due to the deep nature of institutional order flow, the consistency of liquidity within forex, and how often forex prices respect technical levels as compared to other trading environments with less liquidity. On the four-hour or daily chart, the patterns provided by head and shoulders formations yield some of the most reliable trading opportunities for traders who use the forex market.
In terms of stock markets, the head and shoulders pattern tends to work well at market tops in stocks, especially with larger-cap stocks as well as indices, due to how institutional distribution naturally produces the three peaks associated with the head and shoulders pattern as the institution winds down its position over an extended period of time. In addition, volume data associated with the stock market is built on a much more robust foundation and is much more indicative than that found in other asset classes.
Although the gold market has adequate technical underpinning to validate head and shoulders patterns, it is extremely susceptible to changes in market conditions due to macroeconomic events, comments from the Federal Reserve regarding their monetary policy, and geopolitical events. Therefore, the mere presence of a textbook example of a head and shoulders pattern can easily be completely invalidated overnight by macroeconomic catalysts, placing an even greater importance on position size and stop loss management strategies in this market.
In contrast, the cryptocurrency markets are by far the most challenging environment for traders who utilise head and shoulders charts. Bitcoin's overall market structure is susceptible to liquidity sweep effects, whereby the price will purposely push obvious technical levels below in the form of liquidity areas to collect retail trader stop-loss orders before reversing back to the upside.
A good example of this was in Q4 2024 when the top of the overall structure occurred on the BTC weekly chart. While the break of the neckline was a real break, it produced a measured move of the actual reversal; however, before this move, there were two false-entry points from the breakout candle. Therefore, retesting the neckline to validate a trade is not optional in the cryptocurrency market; it is a must.
As noted above, liquidity in the market will determine how reliable the above conditions hold true. The more liquid a market, the more institutions will be active in that particular market, and consequently, the higher the probability that the price will respect significant technical levels, such as necklines.
With TradeWill, creating the same level of discipline in trading head and shoulders patterns requires that you have access to charting tools that enable you to properly identify, plan and execute trades with the precision that this pattern necessitates.
TradeWill has developed a charting platform that allows you to view multiple time frames, draw lines for necklines and trend lines that can easily be adjusted, incorporate integrated RSI and MACD overlays, and receive real-time volume data across all of the above trading markets using one account. Additionally, by setting alerts to notify you when the price reaches the neckline of a trade setup, you do not need to continuously monitor your chart for trade entry.
If you are currently working through these strategies for the first time on a serious basis, TradeWill offers an excellent way to get experience in identifying head and shoulders patterns, entering into trades based on retests of necklines and managing your stop losses all within an actual market environment, at no risk to your capital.
Conclusion: From Pattern Recognition to Market Understanding
The "head and shoulders" pattern in Trading Technical Analysis is one of the strongest tools that a technical trader has at their disposal. It is only strong when it is interpreted as an indication of momentum exhaustion and a psychological change in the way Buyers and Sellers think about the other side of the market. The only value a trader receives for seeing this pattern is related to the trader's knowledge of the underlying cause of the shape of the pattern, and that is what separates the traders who will see the increased profitability of this Trading system through an understanding of the volume behavior associated with each of the three stages, from the traders that do not have the same level of understanding and can be fooled by low liquidity false move signals, that's also what is used in calculating the probability of success of a trade.
For the trader who has learned to track the changes in the volume behaviour associated with the neck of the head and shoulders pattern to create a winning trade on multiple time frames, and therefore, determine the probability of success.
When we look to 2026, there are increased levels of Retail Participation, and therefore more sophisticated Algorithmic Execution and more intentional "sweeping" to find obvious stop clusters at major or well-known Technical Levels.
As a result, the traders who have moved beyond simply understanding the shape of a pattern and developed an actual literacy level in the behaviour of the Market will continue to have a greater opportunity to consistently outperform other traders. The head and shoulders pattern is valid even with all of the changes we see in the Market today.
The reason for this is that the Market has changed, but the Psychology of the Exhaustion of an Uptrend, and therefore the Psychology associated with a Change of Trend, has not changed.
Visit Tradewill.com Today!
FAQ
What is a head and shoulders pattern? It's a bearish reversal chart formation consisting of three peaks where the middle peak is the highest, connected at their base by a support level called the neckline. A confirmed candle close below the neckline signals a potential trend shift from bullish to bearish.
How reliable is the head and shoulders pattern? In liquid markets like Forex and equities, with proper volume confirmation and a genuine neckline close, the pattern has historically delivered in the 65% to 82% range depending on market conditions. Crypto markets run considerably lower due to the frequency of false breakouts and stop hunts.
What confirms a valid setup? A full candle body closing below the neckline, accompanied by a volume surge on the breakdown candle, is the primary confirmation. A successful neckline retest from below, where the level holds as resistance, provides a second layer of confirmation and is typically the safer entry point.
What is an inverse head and shoulders pattern? The mirror version of the standard pattern forms at the end of a downtrend. Three troughs appear, where the middle trough is the lowest, and a confirmed close above the neckline signals a potential bullish reversal with the same measured move projection logic.
Does the pattern work in crypto markets? It works, but with lower reliability than in Forex or equity markets. The higher frequency of liquidity sweeps in crypto makes the retest confirmation approach essential rather than optional, and breakout entries carry meaningfully higher false signal risk.
How do I avoid false signals? Never enter on a wick break alone. Require a full candle close beyond the neckline, verify that volume expanded on the breakout candle, and use RSI divergence and MACD as supporting filters before executing the trade.
Disclaimer: The content of the blog does not represent any position of Trade W, does not serve as any trading-related decision advice, and does not endorse any third-party.