

 Trade W

What Is a Bull Trap? Why It's One of the Most Dangerous Setups in Crypto Markets
A lot of people are excited about the latest Bitcoin rally after it has recently broken through a significant resistance level. A number of traders who were caught up in all the excitement forgot about all their previous experience on when to enter a trade and ended up buying at the top of the trend, only to be met with a steep decline in price shortly thereafter. They do so by falling victim to a bull trap.
Bull traps typically occur when the price makes a fake breakout above resistance but immediately reverses afterwards. The newly long traders believe that they have entered into a new bullish trend; however, they are all left holding positions that have lost money.
The crypto market is filled with these types of setups due to several reasons. The most important reason is extreme volatility. A trader can easily see his or her portfolio value change by 10 or 20 percent (or more!) in a matter of minutes. Another significant factor in the crypto market is the lack of liquidity in certain altcoins, which provides an opportunity for larger investors to manipulate the price of those particular coins.
Adding to the mix are emotional-based trading strategies and fear of missing out (FOMO), which creates a perfect storm for bulls since they are 'enticed' into making price-sensitive emotional decisions before making a real, educated purchase decision. While there are safeguards (in the form of regulations) that protect traders from bull traps in traditional stock markets, the unregulated crypto market allows for fake breakouts to happen continuously.
A perfect example of how a typical bull trap occurs is by having a price break out of a resistance level and then following that breakout, there is rapid buying (by bull trap chasers). Subsequently, the traders that caused the breakout (i.e., institutional money) begin selling their coins to take advantage of the breakout, causing the price to return back to below the newly broken breakout level; however, late buyers have no idea that they are all being stuck with the newly formed bull traps.
This analogy describes the process of getting faked out in a basketball game, in which your opponent fakes a drive towards the basket, and rather than continuing to drive, pulls back and hits a shot from another direction. You ended up being faked out based on something that didn’t actually exist. For example, BTC faked a breakout from $65000 and dropped back down to $60000 a few days later. Ethereum faked a breakout during the pre-Merge hype, breaking several key levels before quickly reversing. The drops after these false breakouts were not ordinary follow-throughs; they were purposeful traps.
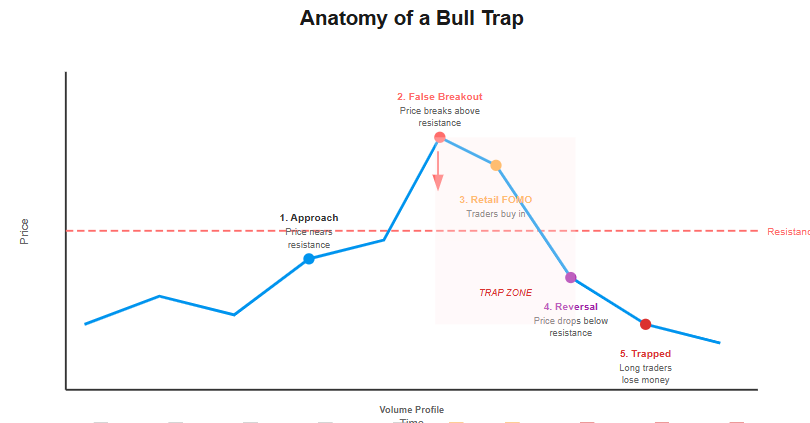
In contrast to the difference between a bull trap and a true breakout, a true breakout remains above the resistance level, retests the level as a new support level, and continues to show upward momentum with strong volume. The false breakouts are unable to be maintained. They may appear enticing to the trader but will eventually collapse under their own weight.
Takeaway: The rise of the bull trap is not the danger; rather, the danger is in the manner in which the rise appears so convincing that many traders abandon their discipline in pursuit of the opportunity.
How Bull Traps Form
Understanding bull traps can help you avoid them in the future. Bull traps do not happen for no reason. They occur because combinations of different market forces are working together.
The first factor is emotional drivers. Traders' FOMO pushes them to chase prices. Greed tells them they would rather take a bad price than miss out on the move. When enough retail traders think this way, they create the fuel for the trap.
The second factor is large players. Large players like whales and institutions can create enough buying pressure to break through resistance by using strategic buy orders. They know that once retail traders see the breakout, they are going to jump on board.
Once enough buying pressure from retail traders moves the price up, the large players will then take the opportunity to reverse their positions and sell into the move. This isn't necessarily illegal market manipulation but rather an opportunistic strategy; however, it does fall within the category of market manipulation.
The final factor is liquidity hunting. Crypto markets are heavily influenced by perpetual swaps and futures contracts, which creates blocks of stop-loss and liquidation levels. Large players know the locations of these blocks. When large players push the price slightly above resistance, they can force short traders out of their positions to cover their shorts (purchasing to close), which will create additional buying pressure that will push the price temporarily even higher. After the shorts have closed and retail traders have come in, then the price can reverse.
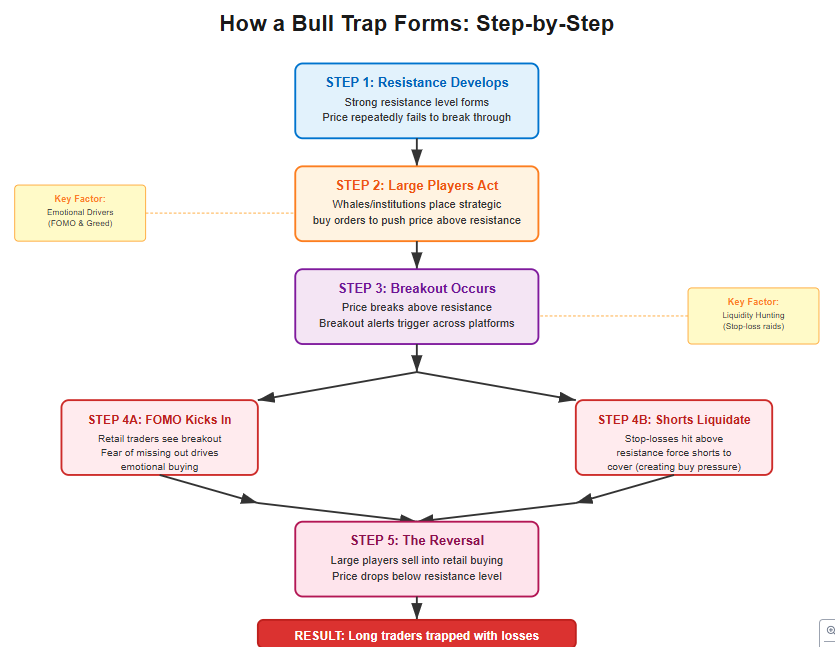
Step-by-step:
A key resistance in the market develops. Large amounts of capital push the price of the asset past that resistance, resulting in breakout alerts. Retail traders therefore buy into these potential breakouts, believing they are witnessing the creation of a new trend.
As big players sell into their long positions, the market rapidly reverses. Long traders become trapped, usually because they set their stops much too far away or did not even set any stops.
Crypto markets tend to be more susceptible to bull traps than stock and forex markets for a number of reasons. In stock markets, there are no daily price limits. There is 24 hour a day, 7 day a week trading, which means that at certain times, liquidity will be low, thus providing the opportunity for price manipulation. In addition, leverage exists in every single crypto market. By using 10x, 20x, or even 100x leverage on perpetual swaps, traders magnify every move, which makes false breakouts much more pronounced.
This can be compared to a student who suddenly gets an A on one test. Everyone would assume that this student has gotten his act together. However, it will not be long before he goes back to earning his usual D's and F's. The brief improvement seemed real at the time, but it could not be sustained.
For example, look at BTC perpetual futures: The fact that funding rates can become extremely positive illustrates that there are an abundance of long positions being held by traders; therefore, this indicates that a market is potentially overextended and perhaps ready to reverse. Another example would be ETH/BTC pairs where ETH appears to be breaking out above BTC just above a very strong support area. In many cases, this is actually a false breakout leading up to much lower prices.
In 2022, LUNA saw many retracements back up after the final crash, but not all of them were as severe in terms of price declines post-crash. Even as recently as early 2023, Bitcoin has seen false breakouts leading up to ETF speculation, and many traders bought into the hype only to get trapped.
To summarise, a bull trap is not simply random volatility; it results from incorrect sentiments combined with large players' calculated actions.
How to Identify a Bull Trap: Practical Technical Indicators
To avoid being caught in a bull trap, it’s essential to watch three key indicators: price action, volume and technical analysis. These provide different perspectives on whether a breakout is legitimate or a fakeout.
Price action Signals
As the first step towards assessing a breakout, examine how the price responds immediately after the breakout has occurred. For example, if the price was to break upward into a new resistance area and then remain in that area it would indicate a successful breakout; however if the price drops below that resistance area then that is a sign that the breakout was unsuccessful.
Long upper wicks indicate a significant rejection. They represent a time when buyers attempted to push prices higher but sellers overpowered them and drove prices back down. Furthermore, the weak candle bodies formed after breakouts signal that momentum has been lost.
A clear cut example of this would be the fake breakout of Bitcoin at $48,000 in early 2024 when the price skyrocketed creating a long upper wick followed by a close below $48,000. Solana experienced this same breakout above its range high only to retrace back into the range within 6 hours.
Volume Signals
A move's conviction is reflected by its volume- strong volume indicates a true breakout, while weak volume creates a bull trap. Decreasing volume post-breakout signifies that potential buyers were not able to sustain their volume after reception of the breakout.
The most definitive signal of a true trap occurs when sellers have greater volume than buyers, after the breakout; the market may gain price on weak buyers and experience a sharp decline over strong sellers.
Technical indicator Signals
Indications provided by technical indicators can serve as an additional layer of confirmation. One of the more reliable technical indicator signals is the RSI Divergence indicator; if the price makes a higher high but the RSI does not make a higher high, the momentum is declining, indicating the potential for a reversal.
Another technical indicator which indicates additional trouble would be when the MACD Bearish Cross occurs after breaking out; the signal line is above the MACD Line and indicates momentum has declined (liquidity) from the breakout point.
A supporting amount of volume confirmation can be found using On-Balance Volume (OBV) as a method to monitor volume's stability after the bull run. If OBV remained flat or declined from the breakout, that means the breakout was unsupported by volume overall.
Continuously watch EMA 20 and 50 during the breakout and determine how long it stays above these moving averages; if price breaks out and does not sustain above EMA 20 or EMA 50 moving averages; it may indicate that the stock is still trying to maintain new support.
The best way to understand what a Bull Trap on the chart looks like is to picture watching someone run like crazy to win a race but gasping for air. This runner will not be able to hold that kind of pace for too long because they are going to slow down. This relates to what a Bull Trap looks like on the chart.
An example of this was with the SHIB coin in 2021. The price jumped up from when it was around $0.01 to nearly $1.00 within three days, which created breakout alerts, then the price dropped back down after that. In 2023, Ethereum price faked out around $2,100 and had significant RSI divergence.
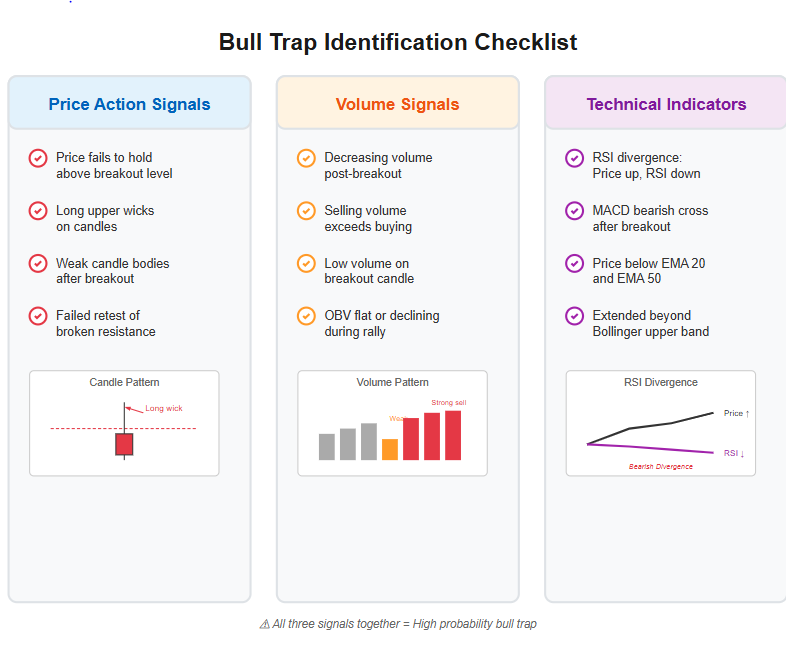
Traders who purchased the breakout ended up being trapped within a few hours. Therefore, the biggest takeaway from this is to never confirm a breakout by just looking at the price of the coin. The first thing you should look for is volume. After you have determined that volume has increased, look for a second confirmation from an indicator. If you see all three things, then the breakout has a much better chance of sticking. If you do not see all three things, then do not buy.
Bull Trap vs. Bear Trap: What's the Difference?
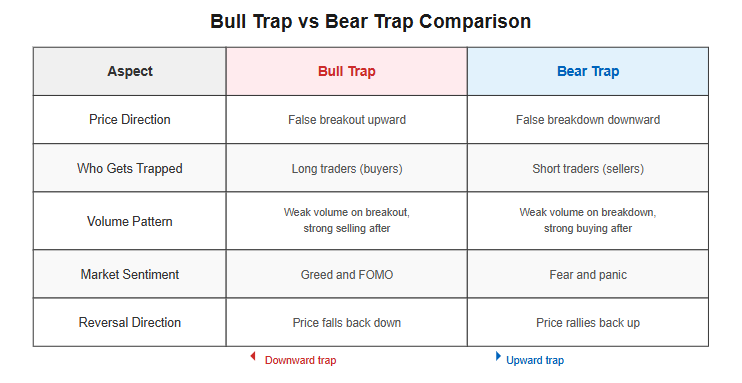
Bear traps and bull traps are both artificially-constructed events created to entrap traders into taking the opposite position than intended by the market. The difference between a bull trap and a bear trap is the direction of the move.
A bull trap occurs when a trader enters into a position because of a perceived breakout above the resistance level. The price then makes an abrupt turnaround and moves back below to the original resistance level trapping long-side traders inside the market.
A bear trap is the opposite. A trader opens a position in anticipation of a breakdown below support. The price then reverses direction and moves back above support, trapping short-side traders inside the market.
Here's a side-by-side comparison:In the crypto markets, two common types of traps prey on the same weaknesses of traders: Emotional trading, poor liquidity and high leverage. When traders impulsively buy or sell during a breakout or breakdown with no confirmation, they are making themselves easy targets to trap.
An example is the bear trap that occurred at the end of 2019 on the BTC charts. Investors panicked and sold their BTC positions when price broke below a major support level. Subsequently, there was a significant price recovery that left those who were using short positions with little chance of recovering their losses. Similarly, near the $140 mark in 2020, Ethereum created a similar situation by creating the perception of a breakdown and then quickly recovering.
The basic premise behind both the bear and bull traps is that traders are trapped into entering into a position at the worst possible time. Although the direction of the trap is opposite, the logic behind both traps is the same. Whether you are buying on a fake breakout or selling on a fake breakdown, you are reacting to an event that did not actually happen.
Being aware of both bear trap and bull trap, you will improve as a trader, as you will no longer be prone to make trades without waiting for the appropriate confirmation.
How to Avoid Falling Into a Bull Trap
Bull traps can be avoided by implementing discipline and patience instead of trying to identify the best trade possible. There are several ways you can protect yourself from bull traps.
Don't chase breakouts. While this is probably the most straightforward advice to follow, it is also perhaps the most difficult to stick to! When you see a price breakout, the natural instinct is to jump on board as soon as possible. Unless you plan to use the "I'm gonna miss the move!” excuse for the price action, hold off on buying until you see confirmation of the breakout.
Use less leverage. Traders who use high levels of leverage (10x or 20x) can find themselves in a difficult situation when a small retracement happens and can result in total liquidation. When trading with less leverage, it gives you more opportunity to withstand the volatility being produced from these breakouts.
Use an appropriate exit strategy with a clear stop-loss level. This should be done prior to entering any trades. If you want to go long on a breakout, set your stop-loss below the breakout price. If the price moves back past that level, exit and do not hold, "Hoping it will come back."
Use multiple time frames for confirmation. If you're looking to confirm breakout strength, check out the 4hr, daily, and weekly charts. If you see breakout on a 15-minute chart but the price is very weak on the daily chart, chances are it is simply a bull trap.
Be mindful of high-risk times. Major news releases, announcements from the Fed (Federal Reserve) and periods of low liquidity (weekends, the first few hours of Asian trading hours) are all periods when many false price moves are frequent. Be extremely careful during these periods.
Have you confirmed that there is support for this breakout in the volume? We have gone through this previously but it is worth mentioning again that if volume does not support a breakout it is not a real breakout.
Here are a few more actionable tips:
-
Wait for a retest. If the market breaks above an old resistance level, wait to see if the price retests the old resistance as a new support level.
-
If it does hold the support level, there is a better chance the breakout is real. Use EMA 20 and EMA 50 to measure how strong the trend is.
-
If price remains above both, it is likely the trend is still continuing. Use Bollinger Bands to identify an overextended move.
-
If price goes well above the upper band, it could have a quick reversal.
Think of how you would feel about being sold counterfeit designer shoes. You would not buy the shoes without thoroughly inspecting them first.
BTC's 2021 fake breakout above $40,000 is a great example. Price broke out, failed to hold on the retest, then dropped back into the range. Traders who waited for the retest confirmation avoided the trap.
The best way to avoid being trapped is simple. Wait for confirmation. Never trade based on FOMO. If you miss the move, there will always be another one. But if you get trapped, you lose capital that's hard to get back.
How to Profit from a Bull Trap (Reverse Trading Strategy)
The Logic of Trading Against a Bull Trap
When considering the logic behind trading against a bullish trap, keep in mind that once a breakout has failed, there will be an opportunity to sell short. Typically, after a price rallies briefly, then immediately reverses, that price will fall even further than it originally rallied.
The reason for this phenomenon is that all the traders who bought into the break may now be in a losing position. As soon as they realise the breakout has failed, they will immediately begin exiting their position by selling off their purchases, thereby causing additional selling pressure in the market.
Step-by-Step Trading Plan
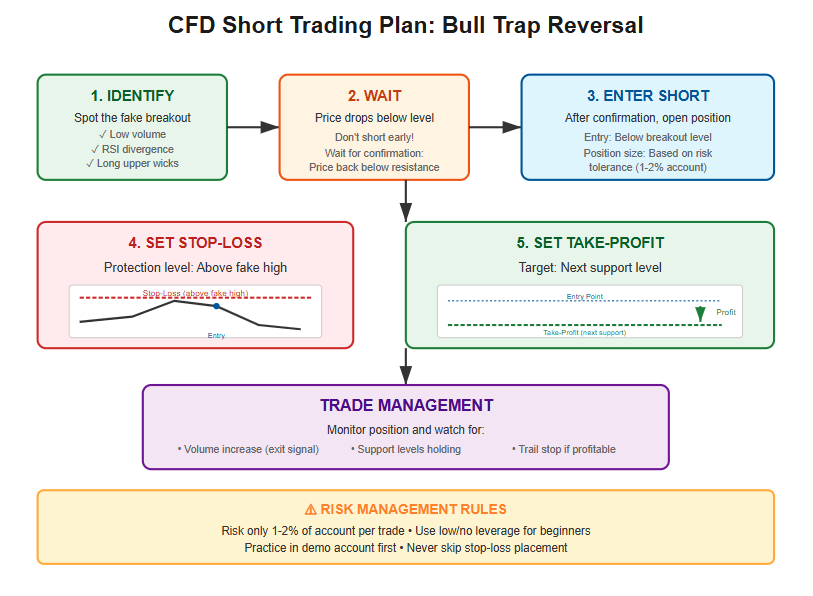
The following is a checklist for trading a bull trap reversal using contracts for difference (CFDs) :
-
Look for the "fake breakout" and reversal. Look for the same signals we talked about before; low volume, RSI divergences, long upper wicks, etc.
-
Enter the short after the price has dropped back down through the key level. This confirms that the trap is in place. Do not sell short just because you believe that it will occur; wait for the confirmation.
-
Set your stop loss above the "fake breakout" high. If the price rises above that level again, then you are mistaken, and exit the trade.
-
Set your profit target to the next support level. Do not be greedy, take profits where other traders may look to re-enter the market.
Beginner-Friendly Strategy
If you are new to this, it’s best to keep it simple. Do not use leverage while trading and only trade clear trends in which the bull trap is evident. Risk management should always be a requirement and not merely optional.
Risk Warnings
CFD trading uses leverage, which means both potential financial gain and loss. Therefore, a beginner would be wise to avoid highly volatile altcoins when learning to trade. As such, those individuals should start trading on major assets such as BTC and ETH. It is also advisable for beginners to practice trading in demo accounts prior to putting actual money on the line.
The Ethereum "false breakout" at $4,000.00 in 2021 presented an exemplary opportunity for traders looking to short the asset. The price of Ethereum had a momentary spike upward, but then quickly fell back down again. Consequently, traders who shorted the failed breakout were rewarded with considerable profits. In 2023, the bitcoin (BTC) "false breakout" at $31,000.00 was yet another opportunity for traders to profit from shorting the asset.
The point being, to profit from bull traps, the first step must be the prudent management of one’s risk. If you cannot manage your risk, do not attempt to trade the reversal when it occurs; simply avoid it altogether.
How to Identify and Trade Bull Traps
We can now see how what we've learned about bull traps can be applied to actual trading. At Tradewill, you have access to a range of tools and assets to help you find and trade bull traps.
Assets Supported on Tradewill
Tradewill has many major crypto CFDs available, such as BTC/USD, ETH/USD, LTC/USD, and XRP/USD; you also have access to trade indices, forex pairs, and commodities adding a lot of helpful avenues to employ these strategies in various markets.
How to Use Tradewill Charting Tools to Identify Bull Traps
Using the charting resources on Tradewill, you can determine if a breakout is genuine by utilizing multi-timeframe charts to investigate the breakout across all applicable time frames and with the many technical indicators provided, including RSI, MACD, EMA, and Bollinger Bands, you can identify divergence and generate signals; and lastly, the price action, which is easily observable on the clean, mobile responsive platform.
Examples of Two-Way Trading via CFDs
CFDs allow you to benefit from movements both up and down. For instance, if you see a BTC/USD bull trap, you may short it and take the profit on the way back down, additionally when you find an asset that is relatively stronger than others, such as going long ETH/USD while shorting BTC/USD if you think ETH will appreciate more than BTC.
Risk Control Tools
Bull trap strategies can be used to maximize your trading potential through the use of Tradewill's risk management tools. These tools will allow you to set up stop-loss orders (SLs) to help prevent losses, and take-profit orders (TPs) to automatically take gains at a predetermined point in time. Having lower spreads enables you to keep a greater portion of your profits.
Tradewill provides demo accounts, which allow you to practice identifying bull traps before risking any actual funds. Through paper trading you can experiment and refine your strategies without losing money on trades while gaining comfort in recognizing and managing bull traps. Once you are confident in recognizing patterns and managing trades, you may confidently convert to live trading.
The advanced charting tools and two-way CFD trading that are available on Tradewill's platform will allow for an easier identification of bull trap patterns. By having access to the proper tools you will be able to quickly identify bull traps and implement your strategies, whether you are looking to avoid them or take advantage of the profit potential from them.
What is a Bull Trap?
This situation refers to an incident where a price has broken above the resistance level, only to then quickly reverse down again, trapping Long Traders in the process.
Signs to Identify a Bull Trap:
-
Price never stays above the breakout level
-
Upper wicks on the candles indicate that shorts may be trying to take back control over the trend
-
Lower volume when the breakout occurred
-
Divergence exists between the RSI and the Price (Price made a new high but the RSI did not)
-
Bearish MACD Cross occurred following the breakout.
How to Avoid Traps:
-
Don’t Trade Blindly. Wait for Confirmation on Retests.
-
Check the Volume Before Entering Trades.
-
Use Multi-Time-Frame Analysis to Find Trends.
-
Set Your Stop-Loss Orders Just Below Your Breakout Level.
-
Avoid Low Liquidity Periods; Wait for Medium or Higher Volume.
What to Look Out For When Trading Stocks/Options/Currencies: BTC, ETH, SOL, XRP, etc., All Altcoins During High Volatility.
Quick CFD Short Trading Process:
-
Identify an Apparent False Breakout
-
Check the Volume to See if It Is Weak
-
Wait for Confirmation on the Failed Retest
-
Enter Short on a Break of a Support Level
-
Set Stop-Losses Above the Fake Breakout High
-
Take Profit on the Next Support Level
Common Beginner Mistakes:
-
Chasing Price Without Confirmation
-
Failing to Check for Volume
-
Using Excessive Leverage when Trading
-
Failing to Keep Stop Losses in Place.
Keep the Above Checklist in Mind While Trading to Help You Make Better Decisions With Updated Information and Timing.
Conclusion: Why Every Crypto Trader Must Understand Bull Traps
Bull traps are the most popular disinformation patterns in the crypto world, exploiting human psychology and exploiting emotions like Fear of Missing Out (FOMO), punishing people who act based on speculative hunches and not waiting for confirmation on their investments before making a decision.
If you can learn to recognize these types of patterns, you will be able to significantly reduce your number of trades that are made on impulse and thus eliminate buying at any given time. By protecting your capital from unnecessary risk, you are able to remain in the market longer as an investor, which will lead to improved performance in the long run through consistent and steady results; ultimately resulting in a higher percentage of winning trades.
Not only does this information apply to experienced traders, the Beginner trader can actually receive more benefit from learning how to identify such patterns since they are often the traders that fall prey to these traps due to lack of experience. Knowing how to confirm an entry with volume, confirm a market direction, and employ sound risk management techniques may seem boring to some but they are the very elements that separate profitable traders from those that ultimately blow out their trading accounts.
So are you ready to implement this information? Create your Tradingwill Account today and begin using your professional charting tools to locate bull traps in a professional manner. You can practice your strategies without any financial risk by using the demo trading mode prior to opening a live trading account.
Additionally, continue to develop your trading edge by utilizing our comprehensive Crypto CFD Trading Terms A-Z guide and develop an understanding of the various types of patterns that move markets.
Disclaimer: The content of the blog does not represent any position of Trade W, does not serve as any trading-related decision advice, and does not endorse any third-party.