

 Trade W
Introduction: Why Reading CFD Charts Is Essential for Pro Traders
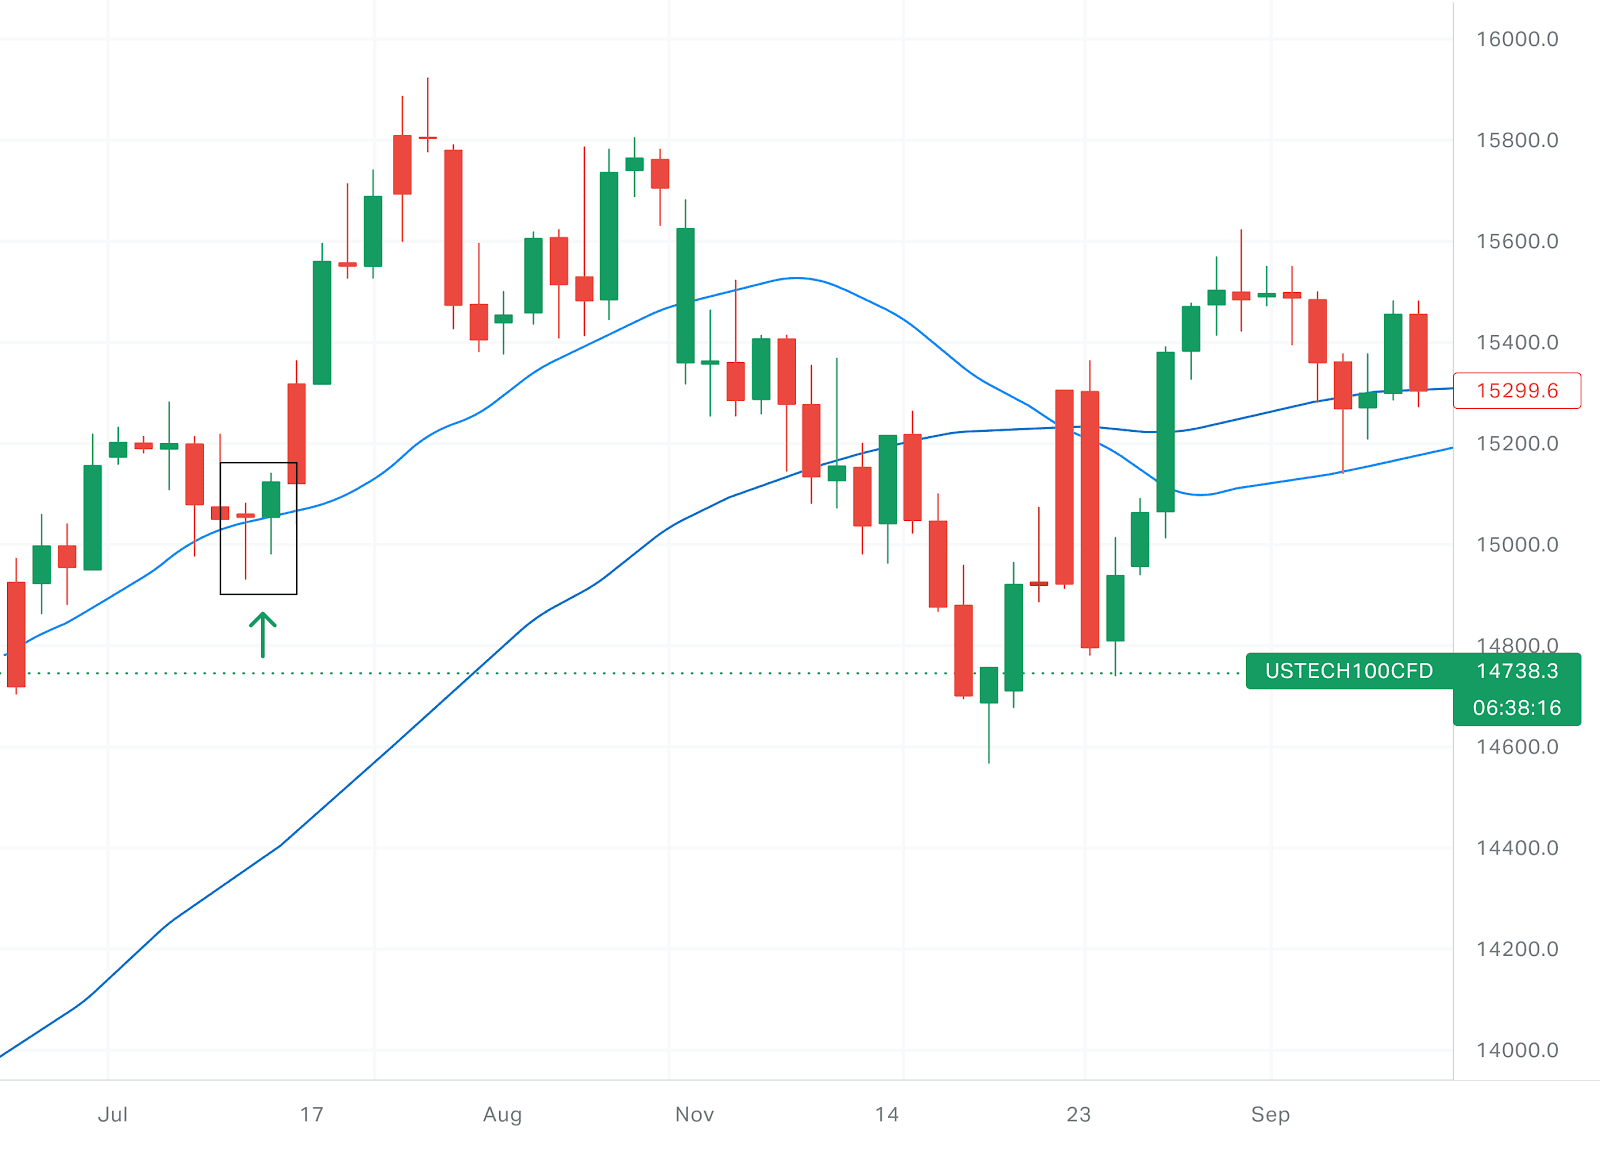
Contract for Difference (CFD) lets you take advantage of both rising and falling markets without actually owning the asset. But while the opportunity is vast, the risks are real. Nearly 70% of retail traders lose money in this fast-paced arena. The key difference between success and failure often comes down to one important skill: knowing how to read and understand price charts.
CFD chart reading forms the foundation of profitable CFD trading strategies by informing timing, risk management, and entry and exit signals. Without this knowledge, traders end up relying on guesswork, causing themselves to face unnecessary losses.
In this guide, we’ll show you how to read CFD charts with precision. If you're serious about trading, understanding charts is essential.
Types of CFD Charts Explained: Line, Bar, and Candlestick
Choosing the right CFD chart types is important for effective trading. Each chart format shows price data differently, which can suit different strategies and experience levels. Here’s a comparison of the three most common CFD charts:
How to Read Candlestick Patterns in CFD Trading?
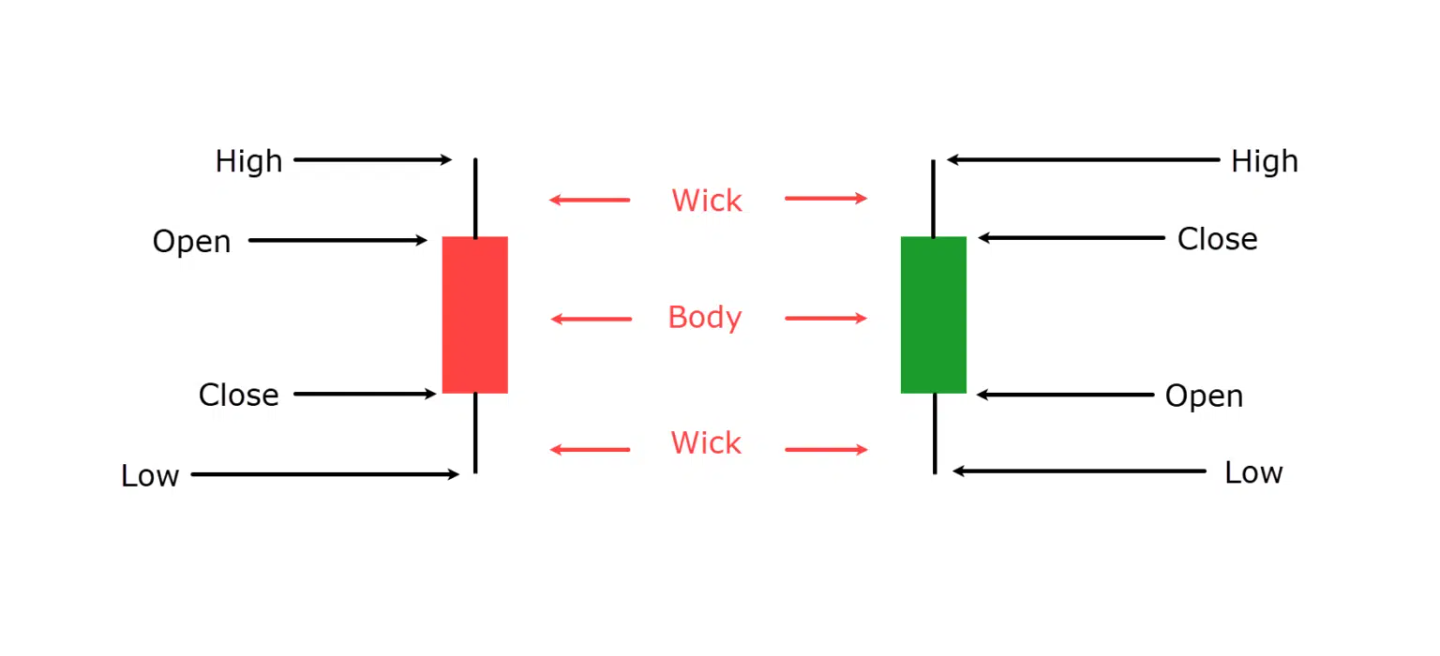
Candlestick charts might seem tricky at first, but they're actually one of the easiest ways to understand price action in CFD trading. Candlestick charts are the backbone of CFD technical analysis. Each candle has a:
-
Body (thick part): Shows the opening and closing prices
-
Wicks (thin lines): Show the highest and lowest prices during that period
-
Color (usually green/red): Indicates if the price went up (bullish) or down (bearish)
5 Simple Candlestick Patterns Everyone Should Know
-
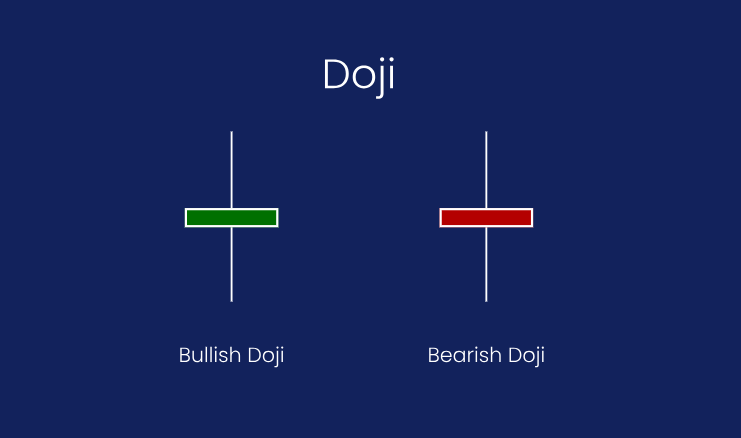
The Doji (Market Indecision)
-
Looks like: A cross or plus sign (very small body with long wicks)
-
Meaning: Buyers and sellers are equally matched, which means a trend might reverse soon
-
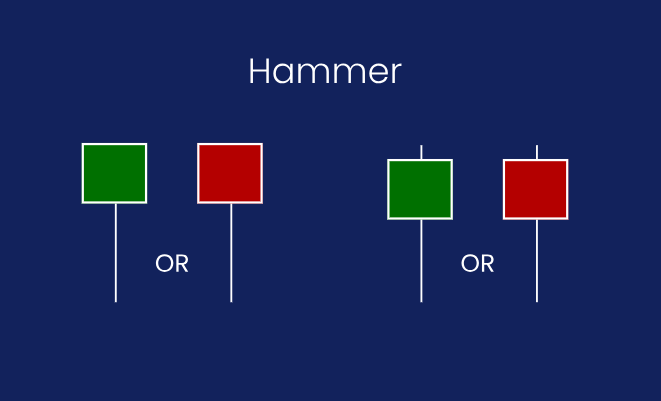
The Hammer (Bullish Reversal)
-
Looks like: A hammer with a short head (body) and long handle (lower wick)
-
Meaning: After a price drop, buyers are stepping in, making it a good time to consider buying
-
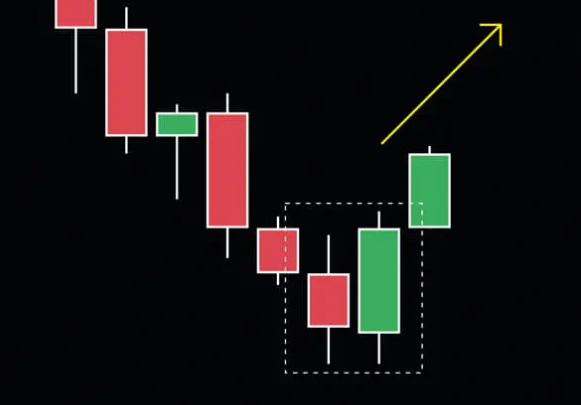
The Engulfing (Strong Trend Change)
-
Looks like: A big candle that completely covers the previous small candle
-
Meaning: The trend is strongly reversing (bullish if green, bearish if red)
-
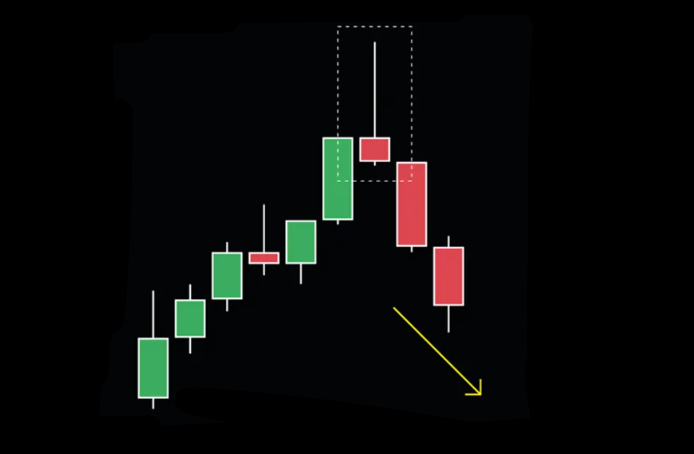
The Shooting Star (Bearish Reversal)
-
Looks like: An upside-down hammer with long upper wick
-
Meaning: After a price rise, sellers are taking over. So, it might be time to sell
-
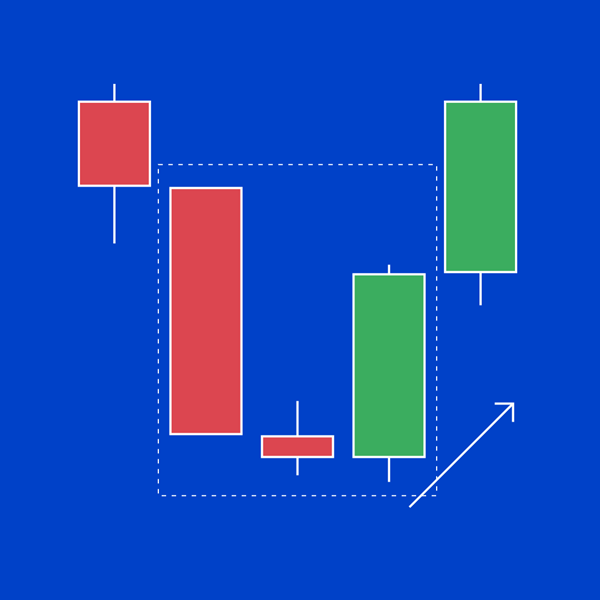
The Morning Star (Early Bullish Signal)
-
Looks like: Three candles - a long red one, a small middle one, and a long green one
-
Meaning: Like a sunrise after darkness, it signals the end of a downtrend
Pro Tip: These patterns work best when they show up after strong trends and close to key support/resistance levels. Always check with other indicators before jumping into trades.
Understanding Support, Resistance, and Trendline Analysis
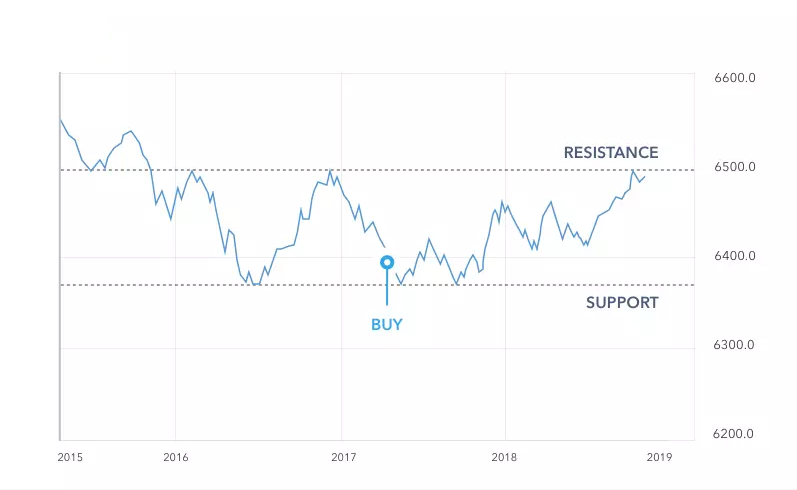
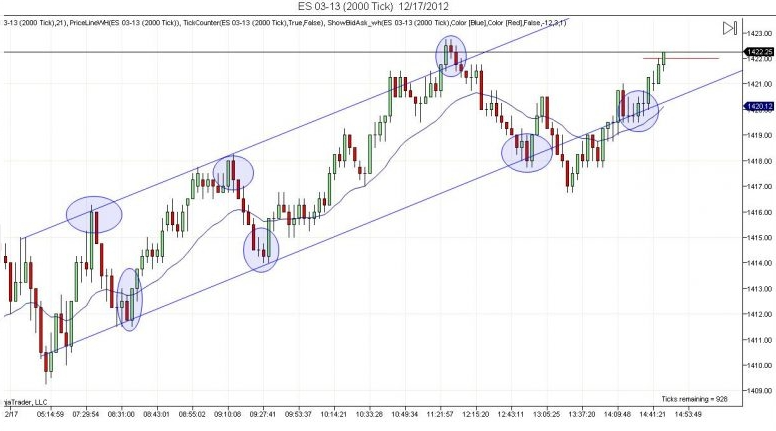
Identifying support level and resistance level zones helps define entry and exit signals and manage risk effectively.
-
Support Level: This is the price point where things stop dropping (buyers jump in), usually at previous lows.
-
Resistance Level: This is the price point where things have a hard time going up (sellers take over), usually at past highs.
-
Trendline Analysis involves connecting rising lows (for uptrends) or falling highs (for downtrends), which can help with CFD chart strategies.
-
Trendlines serve as dynamic support/resistance to help set stop-losses or profit targets.
Using Indicators to Enhance Chart Reading (RSI, MACD, Moving Averages)
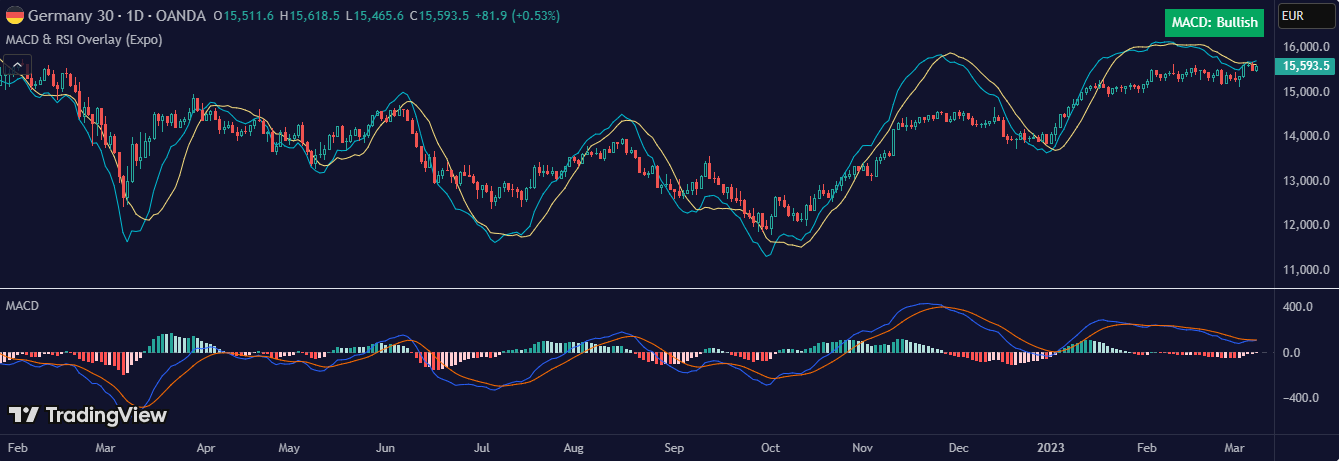
Professional traders often use trading indicators like RSI, MACD signals, and moving averages to confirm price action and filter false signals.
-
The RSI indicator measures momentum on a 0–100 scale, telling us when things are overbought (>70) or oversold (<30), helping traders time their moves better.
-
The MACD indicator shows the difference between two EMAs and uses crossovers for technical signals of trend shifts, making CFD chart analysis more accurate.
-
Moving averages (SMA/EMA) smooth price data to reveal market trends and dynamic support and resistance levels, guiding CFD chart strategies for beginners.
Chart Timeframes: What to Use and When
Picking the right CFD trading timeframes helps you match your strategy with market noise and ups and downs.
Scalpers usually go for ultra-short charts for quick entry and exit signals, while day traders prefer longer time frames for balanced clarity and volatility. Swing traders prefer hourly to daily charts to interpret trends in CFD trading and capture larger price moves with reduced noise.
Avoid mismatched analysis. Using a daily chart for entry timing can lead to common mistakes in CFD chart reading, like exiting too soon.
Common Mistakes to Avoid When Reading CFD Charts
Many beginners overcomplicate CFD chart reading by adding too many indicators without a solid plan, which can confuse their decision-making. Here are some common mistakes when it comes to CFD trading:
-
Ignoring chart context, such as macroeconomic events or earnings dates, can lead to false signals and unexpected volatility.
-
Jumping into patterns without confirming support level strength, like trading based on a candlestick pattern without checking the context, can often end in losses.
-
Using the wrong timeframe for your trading style is a common mistake. For example, day traders sticking to weekly charts can miss important intraday signals and lose out on profits.
Emotional decisions driven by FOMO or recency bias undermine systematic CFD chart strategies for beginners, so adhere to your plan and journal every trade.
Conclusion: Practice, Patience & Continuous Learning
Building a strong chart-based trading strategy requires patience and practice. Before you risk real money, hone your skills using demo accounts to test things out. This builds confidence while helping you implement effective risk management strategies for traders.
Remember these key principles:
-
Always wait for complete trade setups. Avoid reacting to minor price fluctuations
-
Consistently use stop-loss orders to protect your trades
-
Track market movements using tools like TradingView for CFD analysis
-
Incorporate volatility analysis to better understand price movements
Free Resource: Download our CFD Candlestick Cheat Sheet to identify high-probability patterns quickly.
Stay Updated: Subscribe for weekly CFD trading tips, which include:
-
Advanced chart interpretation techniques
-
Position sizing and risk management methods
-
Market volatility breakdowns
Disclaimer: The content of the blog does not represent any position of Trade W, does not serve as any trading-related decision advice, and does not endorse any third-party.