

 Trade W

Why GOOGL Earnings Matter: Key Insights for Investors
If you're watching tech stocks, you can't ignore Alphabet Inc. (GOOGL). As the parent company of Google, YouTube, and Google Cloud, Alphabet dominates search advertising, digital content, and cloud infrastructure. When Alphabet releases its quarterly earnings, investors around the world pay attention because these reports can move markets.
But what exactly are earnings reports? Think of them as a company's report card. Just like you'd review your monthly budget to see if you're earning more than you're spending, companies publish earnings reports to show investors their financial health. These reports include revenue, profit and guidance.
The numbers inside an earnings report directly impact stock prices. If Alphabet beats analyst expectations, Google earnings often trigger a stock price surge. Miss those expectations? The stock can drop sharply within hours. This volatility creates opportunities for traders, especially those using contracts for difference (CFDs), to capitalize on short-term price movements.
For beginners, here's a simple way to understand this: imagine you run a lemonade stand. At the end of each month, you count your sales (revenue) and subtract what you spent on lemons and sugar (expenses). What's left is your profit. If you made more this month than last month, people might want to invest in your lemonade stand. That's essentially what happens when Google reports strong earnings.
Key terms you'll see repeatedly:
-
Earnings: The profit a company makes after all expenses
-
EPS (Earnings Per Share): Profit divided by the number of shares, showing how much each share is worth
-
Revenue: Total money coming in before expenses
-
Guidance: Management's forecast for future performance
Markets react emotionally to earnings. A recent quarter showed Alphabet's stock jumping 5% after the company reported cloud revenue growth of 28% year-over-year. Conversely, when ad revenue growth slowed to single digits in early 2023, the stock fell despite beating overall profit expectations. This teaches us that earnings reports aren't just about hitting numbers. They reflect investor confidence and future expectations.
Revenue Analysis: Understanding GOOGL's Growth Drivers
Revenue is the starting point for analysing any company's earnings. For Alphabet, revenue comes from multiple sources: Google Search advertising (the biggest chunk), YouTube ads, Google Cloud services, and smaller segments like Google Play and hardware sales.
When you're reading Google earnings, start by checking year-over-year (YoY) and quarter-over-quarter (QoQ) revenue growth. YoY growth compares this quarter to the same quarter last year, while QoQ compares consecutive quarters. Consistent YoY growth above 10% typically signals a healthy, expanding business.
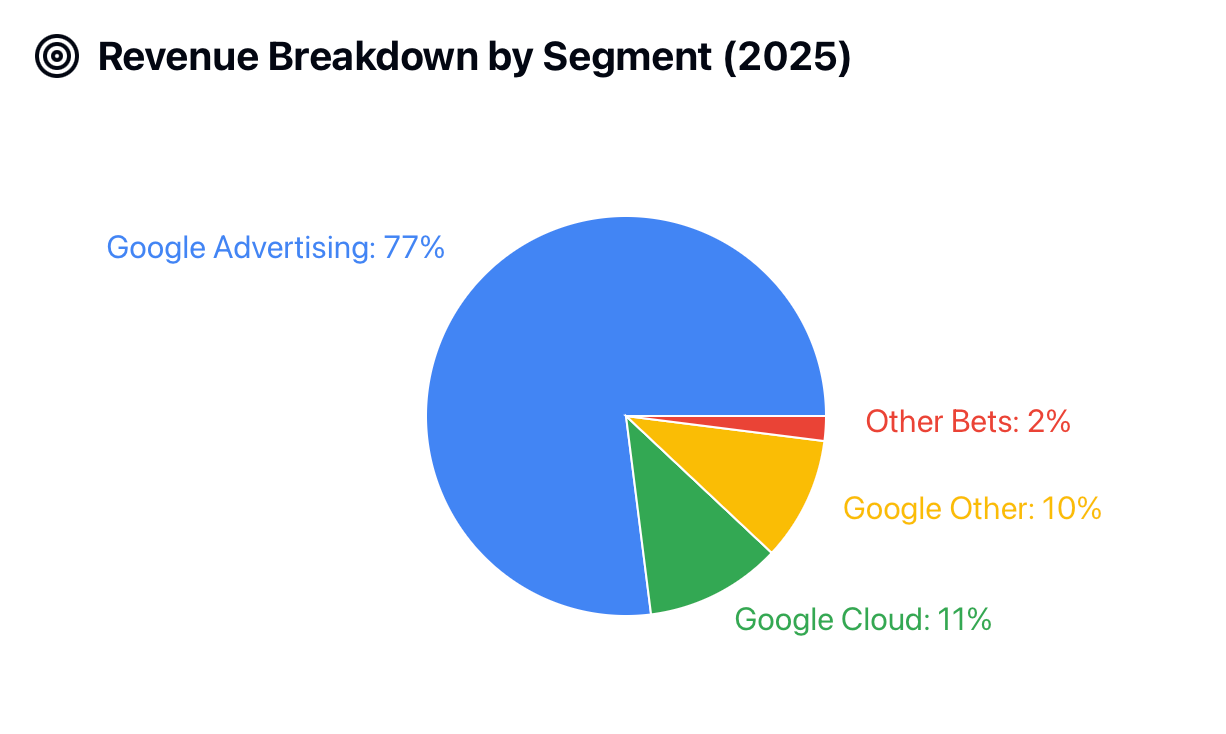
Let's break down Alphabet's revenue streams. In recent quarters, Google advertising (including Search and YouTube) has generated roughly 75-80% of total revenue. Google Cloud, the fastest-growing segment, contributes around 10-12%. The remaining revenue comes from "Google Other" (Play Store, hardware, subscriptions) and non-Google ventures through Alphabet's "Other Bets" division.
Here's what recent quarters looked like:
-
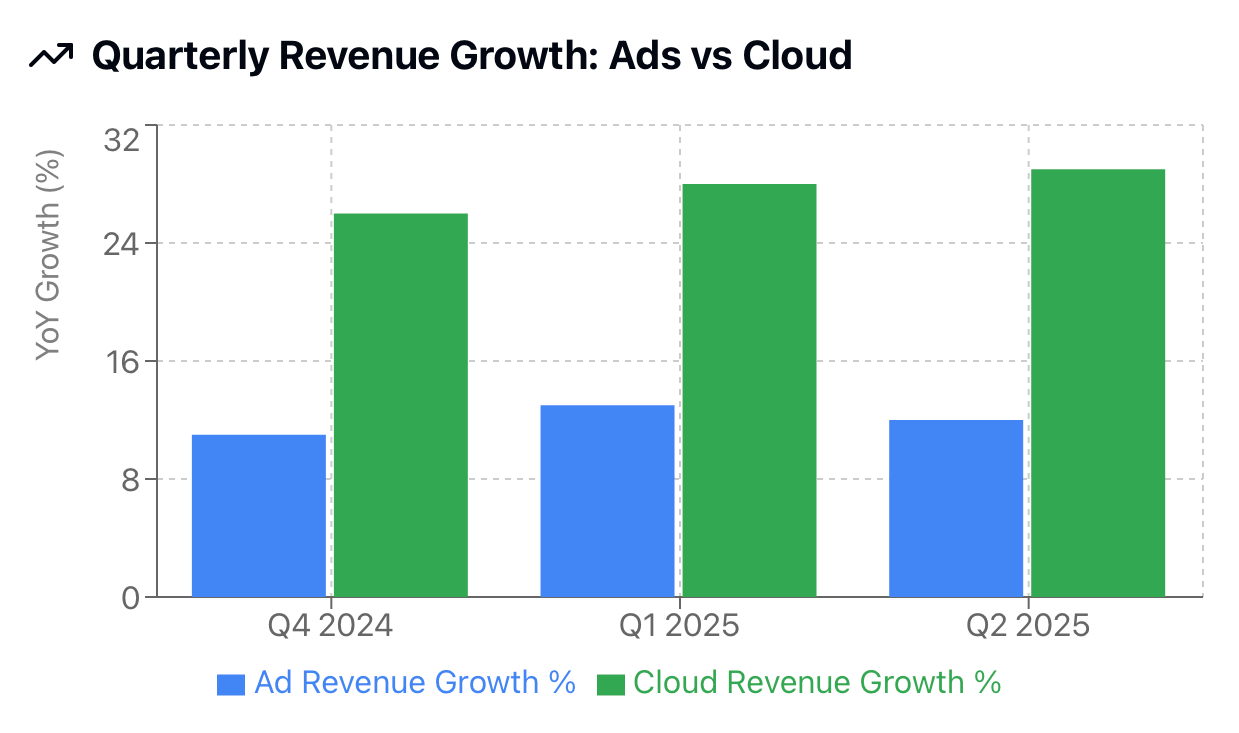
Q4 2024: Ad revenue up 11% YoY, Cloud revenue up 26% YoY
-
Q1 2025: Ad revenue up 13% YoY, Cloud revenue up 28% YoY
-
Q2 2025: Ad revenue up 12% YoY, Cloud revenue up 29% YoY
Notice the pattern? Advertising remains stable with moderate growth, while Cloud is accelerating. This shift matters because cloud services typically have higher profit margins than advertising once they reach scale.
For beginners, think of revenue like your allowance or part-time job income. If you made $100 last month and $120 this month, that's 20% growth. Investors love consistent growth because it suggests the company can keep expanding and generating more profit over time.
When analysing revenue health, watch for these red flags:
-
Declining YoY growth across multiple quarters
-
Major revenue sources are shrinking
-
Over-dependence on one segment (though this is less concerning for Google's dominant ad business)
Strong, diversified revenue growth usually translates to stock price appreciation. When Google Cloud crossed $10 billion in quarterly revenue for the first time, investors celebrated because it proved Google could compete with Amazon Web Services and Microsoft Azure in the lucrative enterprise market.
EPS & Profitability: Measuring Google's Financial Performance
Now we get to the metric that often moves stock prices the most: EPS, or earnings per share. This number tells you how much profit the company generated for each share of stock. If Alphabet reports an EPS of $1.50 and analysts expected $1.45, that five-cent "beat" can send the stock soaring.
EPS is calculated by taking net income (total profit) and dividing it by the number of outstanding shares. Simple formula: EPS = Net Income ÷ Total Shares. If Alphabet made $20 billion in profit and has 13 billion shares outstanding, the EPS would be approximately $1.54.
But there's a catch. Companies report two types of EPS: GAAP and non-GAAP. GAAP (Generally Accepted Accounting Principles) includes all expenses and one-time charges. Non-GAAP excludes unusual items like restructuring costs or stock-based compensation to show "normalised" earnings. Wall Street usually focuses on non-GAAP EPS because it better reflects ongoing business performance.
Let's look at profitability metrics beyond EPS:
-
Gross Profit: Revenue minus direct costs of providing services
-
Operating Income: Gross profit minus operating expenses like R&D and marketing
-
Net Income: What's left after all expenses, including taxes and interest
Alphabet's gross margins typically hover around 55-57%, meaning for every dollar of revenue, about 55 cents covers direct costs and 45 cents goes toward operating expenses and profit. Operating margins usually sit around 25-30%, showing strong profitability compared to many other tech companies.
For a beginner-friendly example, imagine your class runs a bake sale. You sell $200 worth of cookies. You spent $80 on ingredients (gross profit = $120) and $30 on posters and supplies (operating profit = $90). After splitting the remaining money among 30 students, each person gets $3. That $3 per person is like EPS.
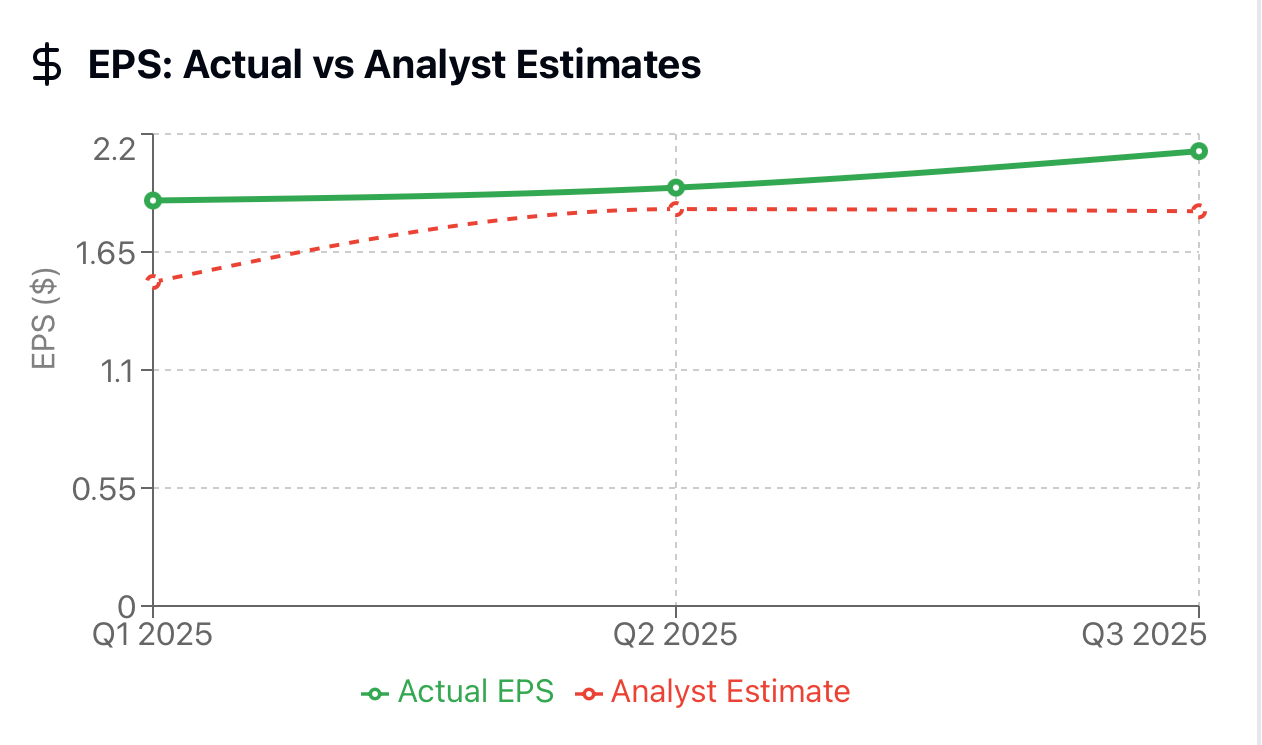
Recent quarters show Alphabet's EPS trending upward:
-
Q1 2025: $1.89 EPS (beat estimates of $1.51)
-
Q2 2025: $1.95 EPS (beat estimates of $1.85)
-
Q3 2025: $2.12 EPS (beat estimates of $1.84)
This consistent EPS growth, combined with revenue increases, signals strong operational efficiency. When a company grows revenue and grows profit faster than revenue, it means they're getting better at converting sales into actual earnings.
Guidance & Market Expectations: Decoding Management Forecasts
Here's where earnings reports get really interesting. During earnings calls, Alphabet's management provides guidance, which is its forecast for the next quarter or year. This forward-looking information often matters more to investors than past results.
Why? Because stock prices reflect future expectations, not historical performance. You're not buying Alphabet for what it earned last quarter but for what it might earn over the next year or five years.
Management guidance comes in different forms. Sometimes executives give specific numbers ("We expect Q4 revenue between $85-88 billion"). Other times, they're vague ("We're optimistic about cloud growth momentum"). The market prefers specific guidance because it reduces uncertainty.
Analyst expectations play a crucial role here. Before earnings, Wall Street analysts publish their estimates for revenue, EPS, and other metrics. These create a consensus that becomes the benchmark for judging results. Beat the consensus, and the stock usually rises. Miss it, and you'll likely see selling pressure.
Here's a real example: In Q2 2025, Alphabet's management raised its full-year cloud revenue forecast from $90 billion to $95 billion. The stock jumped 3% in after-hours trading because this suggested accelerating demand for Google Cloud services. The actual Q2 numbers were already known, but this guidance shift told investors that momentum was building.
For students, think of guidance like when your teacher says, "The final exam will be harder than the midterm." Even if you aced the midterm, you now adjust your expectations and study plans based on that guidance. Stock investors do the same thing.
Watch for these warning signals in guidance:
-
Lowered forecasts compared to previous guidance
-
Vague language without specific numbers
-
Management is avoiding questions about key segments
Sometimes the market overreacts to guidance changes. If Alphabet guides for 8% revenue growth instead of 10%, the stock might drop sharply even though 8% growth is still healthy. These moments can create trading opportunities for those who understand that short-term volatility doesn't always reflect long-term value.
Cash Flow & Balance Sheet: Evaluating Financial Health
Cash is the heartbeat of every business. In headlines, investors traditionally focus on revenue and earnings per share (EPS), but in the world of investing, cash flow statements are where a sophisticated investor will go to understand the financial stability of a company.
Free Cash Flow (FCF) is the cash generated by an organisation after it has paid capital expenditures like data centres, office buildings and equipment. For example, Alphabet typically has around $15 billion - $20 billion of FCF generated every quarter. This large amount of cash generated enables Google to invest in research ($8 billion per quarter) and to acquire smaller companies, buy back shares, and have a solid balance sheet.
The equation to find Free Cash Flow is as follows:
Free Cash Flow = Operating Cash Flow – Capital Expenditures.
If Alphabet has $25 billion in operating cash, and its capital expenditures total $8 billion, its FCF equals $17 billion.
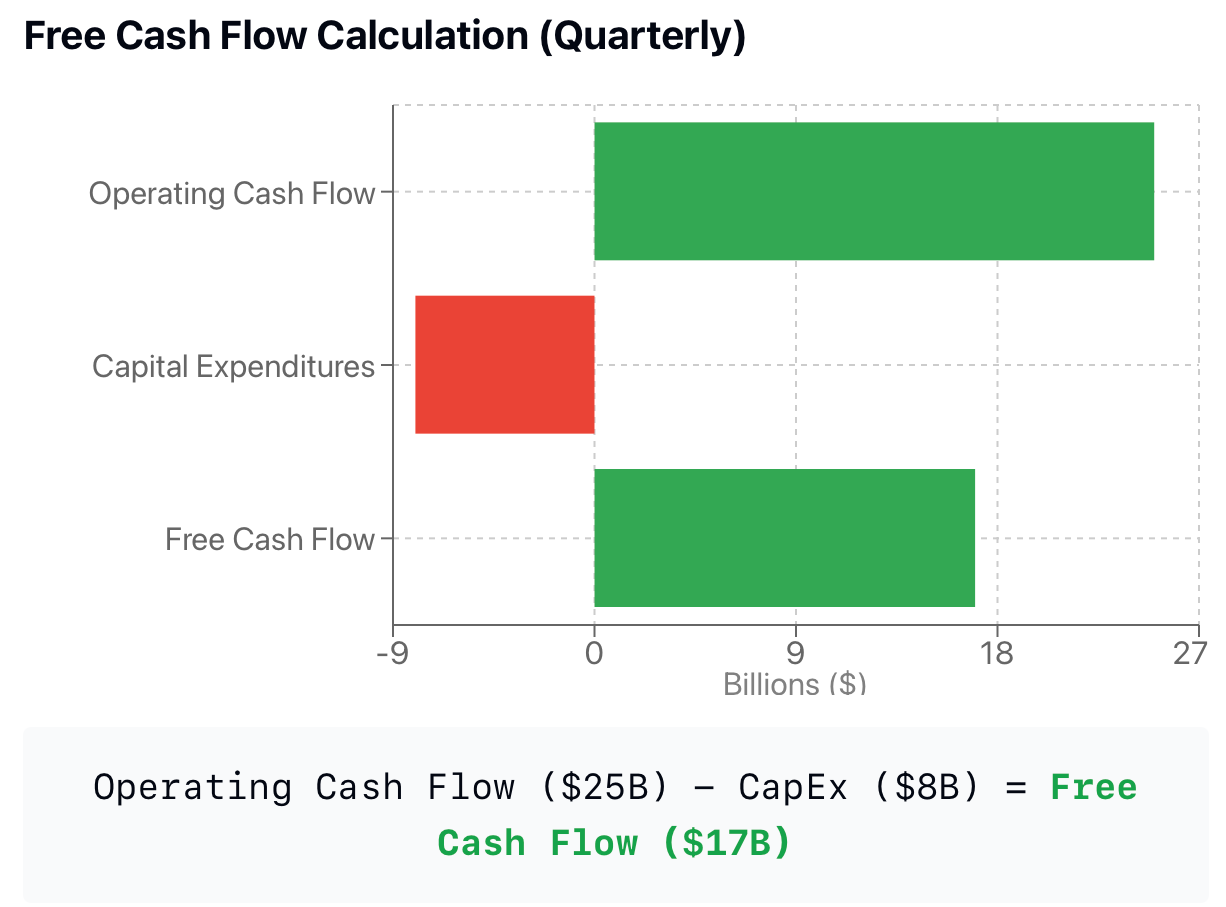
What makes FCF a better indicator of potential future growth for Alphabet at times, versus net income? Recording profits that are not supported by cash being generated is permissible under accounting procedures, so net income does not always give you an accurate gauge of where your company stands today. FCF removes the effects of accounting adjustments to show you the actual amount of cash being generated.
Think of it this way: if your family owns a home and a few cars, it may appear you are wealthy on paper, but if you can't pay this month's bills, you have a cash flow issue. Companies are the same way - strong FCF means that Alphabet will be able to withstand tough economic times and take advantage of new growth opportunities as they arise, as well as return profits to its investors through buybacks.
Alphabet has an extremely solid balance sheet – the company has more than $110 billion in cash and marketable securities with very little debt. This strong financial position allows Alphabet the flexibility to pursue aggressive growth strategies, whether that means acquiring an AI startup for $3 billion or doubling its investment in data centres as growth opportunities present themselves.
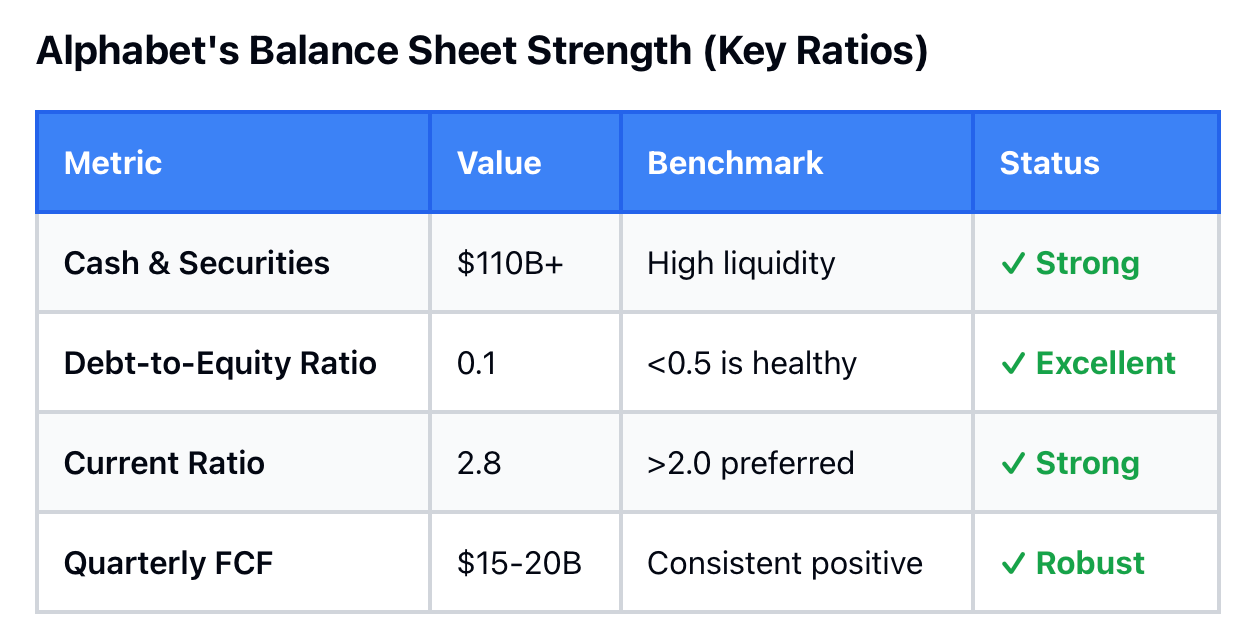
Important Metrics for Monitoring:
-
Current Ratio: This indicates the proportion of the company's current assets compared to its current liabilities. Companies with a current ratio greater than 2.0 are typically considered successful.
-
Debt to Equity Ratio: Alphabet has a very low debt-to-equity ratio of 0.1.
-
Days Sales Outstanding: The length of time Google needs to receive payment from advertisers.
During Alphabet's last few quarters, how much do you think the company spent on building AI capabilities? For example, Capital Expenditures for Alphabet will grow from around $8 billion during Quarter 4 of the 2024 fiscal year, increasing to nearly $12 billion by the end of Quarter 2 of the 2025 fiscal year.
This increase in capital expenditures allows Alphabet to train yet another large language model and enhance its cloud capacity. While these capital expenditures will reduce the amount of Free Cash Flow generated by Alphabet, they create the opportunity for future substantial revenue growth through AI.
Beginning investors may want to view Alphabet's Free Cash Flow similar to how a family views their household budget. A family has a given amount of income coming into the household, uses a certain amount of that income to maintain its home, and saves/spends whatever funds remain as Free Cash.
A company that earns Free Cash Flow on a consistent basis has many options available. On the other hand, Companies without Free Cash Flow will be challenged with continued growth and/or the ability to sustain operations during tough economic times.
Practical Tips: Using GOOGL Earnings for Investment Decisions
The tactical approach involves understanding how to make smarter trades using earnings data. The four key metrics previously discussed can be used in the following ways.
Pre-Earnings Analysis
Before the earnings release, look at the consensus estimates from brokerage analysts that are broken down by the major brokers that cover the stock, e.g. Yahoo Finance and Seeking Alpha. Compare these estimates to the prior quarter's results and to the company's most recent forward guidance provided by the company.
For example, if the company provided forward guidance of $85 billion for the fiscal year and the consensus estimate from brokerage analysts is $87 billion, that means that there is a chance of a $2 billion variance between the consensus estimate and the actual earnings released after the company's earnings announcement.
Once the actual earnings have been released, focus your investment research on the following four items:
-
The actual revenue and how it compares to analyst forecasts.
-
The actual earnings per share (EPS) and how it compares to analyst forecasts.
-
Any changes in the company's forward guidance.
-
Any surprise results from any of the company's major segments.
Professional traders immediately scan all four of the above after the company's report to get an early view of their positioning for the following day. If all four metrics show positive numbers, traders can expect to see a gap-up opening for the stock, meaning it will likely be priced higher than the last time it traded on the previous day.
If the results show a mix, for example, positive earnings with a discrepancy between revenue and analysts' expectations, this uncertainty will lead to a more volatile market for those who own shares of the company's stock.
Get the Full Scoop on 24 to 48 Hours After
You should read the whole report and listen to the conference call. What management tells investors is as important as the earnings numbers to understand what the company's prospects are. Does management sound enthusiastic about the future growth of the AI products? Does management sound worried about declining advertising revenues impacting their business?
Technical Analysis
Using the fundamental points above, and combining them with the technical analysis of the stock, traders can create a trading strategy based on both quantitative and qualitative data. If both factors show the same positive direction in a stock that has strong earnings, then if that stock reaches higher levels of price movement from its previously held price point, this would be considered bullish.
In the case of when earnings surprise, and the stock drops due to a selling-off of the stock due to having a good earnings report, the traders should also look at the technical analysis to identify potential entry points.
The week leading up to the earnings report generally has high volatility in the CFD trading space; so, for example, if you are convinced that Google is going to report earnings that greatly exceed what has been previously expected, then you may take an entry long position via CFD on Google at $165.
If Google exceeds expectations, then you could exit this trade for a profit if it reaches $172 right after the earnings report is released. On the other hand, if the earnings report from Google was disappointing, you would incur losses on this trade based on the amount of leverage utilised.
Risk management is an absolute must:
-
You should never risk more than 2% to 3% of your total trading account on one earnings trade.
-
You should always place a stop loss to limit your losses from unexpected downward movements after the earnings report.
-
You should assess the volatility of the company when ascertaining your CFD trade size.
-
You must fully understand the potential for overnight price gaps for stock that could result in your stop order being executed at significantly higher prices than those anticipated.
In summary, you should maintain a detailed record of every hypothetical trading decision made as well as every simulated trading error to help you improve your future trading results in the live forex markets.
AI Revolution or Search Slowdown? Analysing Alphabet's 2026 Growth Potential
In 2026, Google will not doubt whether it will make a profit, but rather on how to continue growing its revenues from traditional search, which does not seem to be doing well when comparing it to pre-AI revenue growth.
This rapid growth in the AI revenues is shown to the company via its Q4 Earnings, while, conversely, the Search Advertising revenue growth has decreased to the high single digits, compared to Google's tremendous growth in AI about various products produced by Google using AI to enhance the Search capability and enhance its cloud services.
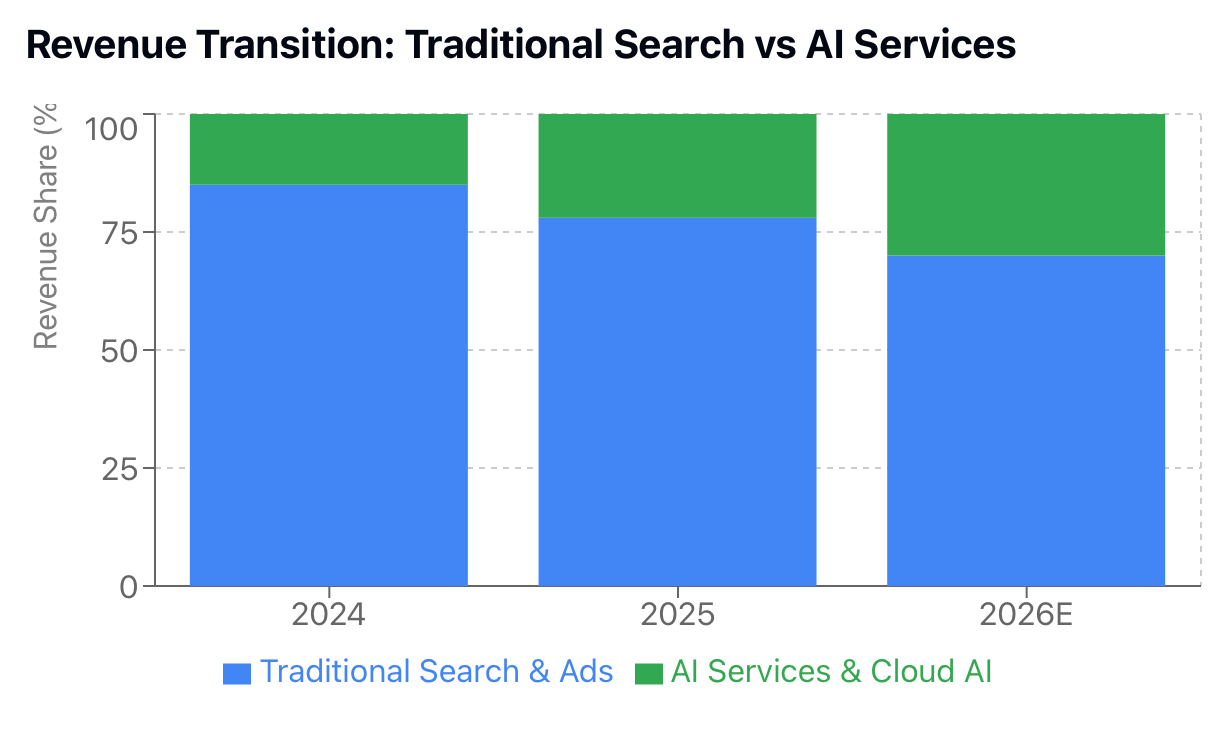
The growing use of artificial intelligence by the general public has created an opportunity for technology firms, including Google, to be able to grow for the next few to several years. For example, Alphabet's Cloud AI Service increased 35% Year over Year; on the other hand, Search Advertising increased only 9%. Additionally, the research and development division at Google, DeepMind, has introduced its first AI products, including Gemini for Businesses, which will allow Alphabet to generate revenue for the first time via AI.
In essence, the amount of investment by Google into the development of AI is massive. Alphabet invested $40 billion in CAPEX in 2024, primarily in the AI Technology Infrastructure. Additionally, Alphabet spends over $50 billion on Research and Development annually. Although these investments will harm Alphabet's bottom line in the short term, they will likely lead to a large, multi-trillion-dollar business long term.
To put this into perspective, starting a new business unit within a company will require an investment into labour, equipment, advertising, and additional operating expenses; in other words, a decline in overall profitability. However, if your new business unit achieves a substantial level of success, then it will likely outpace all other sources of revenue before launching the new business unit.
Google's strategy for the long haul is built around three key components.
1. Search Enhancement Through AI = A focus on creating consumer demand for products marketed by Google and increasing competitive advantage to the company’s pricing of advertising rates through implementation of creative AI outputs into Search Results.
2. AI Services Through The Cloud = Google selling enterprise-level AI infrastructure and models to competing organisations against MS Azure and AWS for high-end enterprise-level usage of AI.
3. AI Native Offerings = Google creates Coders and supplements subscriptions under the name Gemini Pro and sells Productivity Tools to Enterprise customers.
Investing in Google involves deciding whether one believes that AI will replace Search Earnings at a faster pace than it generates any new revenue sources for Google. That is to say, if a consumer can obtain their answer from an AI system rather than clicking on an advertisement, then Google's revenue stream is disrupted.
In addition, the Executive team addressed this concern in the last two earnings calls, indicating they believe that AI-enhanced search will provide the consumer with improved customer satisfaction while providing for effective advertisement on search process improvement for users.
In conclusion, the outcome of how Alphabet.AI versus Bing. AI will likely develop an overall picture of where Wall Street now views Alphabet.AI and provide for a clearer path forward to the future of Alphabet and the analysis of value in Alphabet, therefore creating an opportunity for traders to capitalise on Alphabet through a seasonal Opportunity for Earnings Re-evaluation.
Long-term investors need to decide if they think Google can evolve from being a traditional leader in the tech sector to being an industry leader in the AI industry.
Traditionally, many of the world's leading tech companies have not been able to maintain their market position during periods of several technological shifts. However, Google has unique advantages due to its ability to generate cash, its quality employees and its ability to invest in new infrastructure, all of which make it one of only a small handful of companies capable of succeeding in this new environment.
Earnings Week CFD Trading Guide: Capturing GOOGL Volatility
The best time to trade Contracts For Difference (CFDs) is during earnings week due to the volatility created around the release of earnings. As a result of these price movements created by earnings reports, a CFD trader can earn a very significant profit or incur losses very quickly. A careful approach to equity trading with GOOGL during this time may lead to profit generation.
The one week leading up to the earnings announcement usually sees a significant spike in option pricing and implied volatility, with traders positioning themselves for the expected large movement.
Before making a trade, it is essential to consider the following factors:
-
According to historical earnings reaction data, the average price change of GOOGL is approximately ±5% following the announcement of each quarterly earnings report.
-
Today's implied volatilities of GOOGL's options are much higher than the average.
-
Most analysts have increased their GOOGL earnings estimates in the week leading up to the earnings report.
When developing your trading strategy, it is important to keep in mind that a trader's view on an upcoming earnings report will often differ:
Some traders may not want to take the potential risk associated with an unknown outcome, such as the company's quarterly earnings report, and will wait until the day after earnings have been released. Others may prefer to take a position before the earnings report, with a wider stop-loss setting, due to their expectations of reasonable movement.
Earnings Day GOOGL quarterly earnings reports after the market closes, and therefore, typically, GOOGL trades sideways leading up to the earnings release date, and subsequently experiences a significant downward gap in the after-market trading. The after-hours trading of GOOGL has much less volume than during the regular market hours, which can therefore lead to wider spreads and an increased likelihood of slippage associated with trading GOOGL in the after-hours.
Action Steps:
-
Based on technical analysis, the following post price alarm points should be created for both upward and downward critical levels of the GOOGL stock.
-
Before entering a position, both bullish and bearish scenarios should be identified.
-
Before entering a position, traders should know exit points for both bullish and bearish scenarios.
-
The Nasdaq 100 Futures Index should be closely monitored because of the direct effect that Google (GOOGL) has on the overall Nasdaq 100 Index.
A Post-Earnings Phase is typically defined by a price reaction following an earnings report that may initially appear exaggerated based on the initial movement direction. The Second Day is when many traders experience the unwinding of profits and resetting of their accounts. This is where many traders can take advantage of all the daily trades available.
A good example of the post-earnings phase was Alphabet's Q2 2025 earnings report, where they reported better-than-expected Revenue and EPS numbers as a result of better-than-expected Cloud revenue growth. As a result, GOOGL stock opened with a 4.2% (. $165-$172) price gap.
As of midday, GOOGL's stock price had dropped back to $169 and final sales registered at a closing price of $170.50. A Trader should have bought GOOGL on the dip at $169.00 and could have easily profited from that trade in the short duration of hours (in this scenario, 0.9% profit).
Traders new to trading should be aware that earnings-related trades are considered advanced trades from the standpoint of new traders due to the volatility associated with earnings trading. An example of this is during the Revenue Guidance for Q3 2023, whereby Google failed to meet Revenue Guidance on their YouTube advertising, despite overall Revenue beat.
As a result, GOOGL declined 8% in one trading day. For a trader who was long a CFD (Contract for Difference), an 8% downward move on the stock price was equated to a 20-30% capital loss because of the leverage he used.
One of the primary considerations of position sizing is the position size used by the majority of successful traders. Most experienced traders use no more than half of their regular position size when trading earnings because of the inherent volatility associated with earnings releases. Traders should also utilise wider-than-normal stop-loss orders in order to factor in stock price gaps that could possibly occur and take out a trader's stop-loss order well below their long position scale.
As a simulation exercise, create a plan for how you intend to trade before the next earnings release.
Take into consideration these three components:
-
What is the price you expect to see before entering a trade?
-
What percentage of your total account would you risk on this trade?
-
At what point will you place a stop-loss order?
When the earnings release occurs, review your plan against the results of the company's earnings. This will assist you in gaining skills and discipline to be effective when trading earnings releases live.
GOOGL Earnings Spillover: Impact on Nasdaq 100 & USD
As an example, Alphabet Inc.'s earnings can have an impact on more than just Alphabet; they can also impact the entire financial marketplace in addition to impacting the market for all other companies. Regarding the Nasdaq 100 index (which consists of 100 technology companies), Alphabet makes up roughly 4-5%, or 0.2% of the Nasdaq 100 when Alphabet's stock rises by 5% (i.e. adds approximately 0.2%).
Moreover, the psychological aspect of positive earnings will affect the market way beyond what can be calculated. A company's strong earnings will also enhance the overall investor's confidence in the technology sector, and thus, drive prices up for most technology stocks due to correlation.
For example, in Q3 2025, Alphabet reported higher than expected EPS (earnings per share) by 15% as well as higher than expected cloud revenue. GOOGL shares were up 6% the next day.
As a result of Alphabet's earnings report, other companies also benefited, as demonstrated below:
-
The Nasdaq 100 gained more than 1.4% on the day (which is significantly greater than GOOGL's direct contribution).
-
Meta gained 3%, Amazon gained 2.5%, and Microsoft gained approximately 1.8%.
-
Many technology-based Exchange Traded Funds (ETFs) likely experienced increased volumes as a result of their earnings report. Investors evaluate the economy as a whole by looking at the financial markets for the largest technology companies.
If Google continues to succeed in its Advertising business, then investors will also assume that Meta's advertising business is also succeeding. In addition, if Google's Cloud Services continues to generate increasing revenues, investors will be inclined to believe that Amazon's AWS will also produce increasing revenues.
The U.S. technology company’s earnings also have a less apparent, but still very tangible, impact on the value of the U.S. dollar. In most instances, when a tech company has a major earnings report, the U.S. dollar tends to be supported in value by all of the following:
-
Investors abroad are purchasing stocks of U.S.-based companies, which require them to convert their local currency to U.S. dollars.
-
Economic indicators that are positive increase the odds that the Federal Reserve will not cut U.S. interest rates.
-
When tech companies report strong earnings, it is a reflection that the overall economy in the U.S. is generally doing well.
For example, following GOOGL's reports of their Q3 2025 earnings, the USD/EUR dropped from 1.095 to 1.091 just one week later. The USD/JPY changed from a value of approximately 149.2 to a higher value of 150.1. Both of these shifts show a large inflow of capital into U.S. equities due to better-than-expected earnings results.
Traders and investors should keep an open mind when conducting trades that involve stocks and foreign currency pairs. A GOOGL earnings report can have an impact on the value of foreign currency pairs like the EUR/USD. A better-than-expected earnings report for GOOGL can be a positive for the U.S. dollar. Conversely, a GOOGL earnings report that does not meet or exceed analyst estimates may hurt the U.S. dollar, and therefore, will likely cause traders to "sell off" U.S.-based equities.
Feedback loops exist all over the place! Assessing the relationship between some of the following factors before and after each quarter's earnings reports will help you determine the trends.
-
Evaluate Computing (Nasdaq 100) Futures Using Both Volume and Price Movement Before and After Quarterly Earnings Reports
-
Evaluate the U.S. Currency (Dollars) Movement in Comparison to Tech and Tech-Related Earnings Reports
-
Evaluate Implied Volatility of NASDAQ 100 (QQQ) Options Markets
Consider the impact that news of positive results from a highly-regarded student on a difficult exam would have on you personally; this news would let you know that the exam was conducted equitably, that many hard-working students would also likely have performed well on that particular exam.
Thus, you would likely experience a boost in confidence as a result of the positive news regarding the high-performing student. A similar connection exists between the news of Google's positive results and the increased confidence of investors regarding the performance of other technology-related stocks.
Thus, while the analysis of Google's quarterly earnings may not directly impact GOOGL investors, it does create a ripple effect that serves as valuable information for anyone trading Global Stocks via all indices, forex markets and commodities.
Take Your Earnings Analysis to the Next Level
Now that you understand Google’s earnings reports beyond just various financial metrics, you must also learn to develop a more analytical way of evaluating any publicly traded company regularly on a full-time basis, regardless of how you are investing, the industry sector, or how long you are planning to hold your investment.
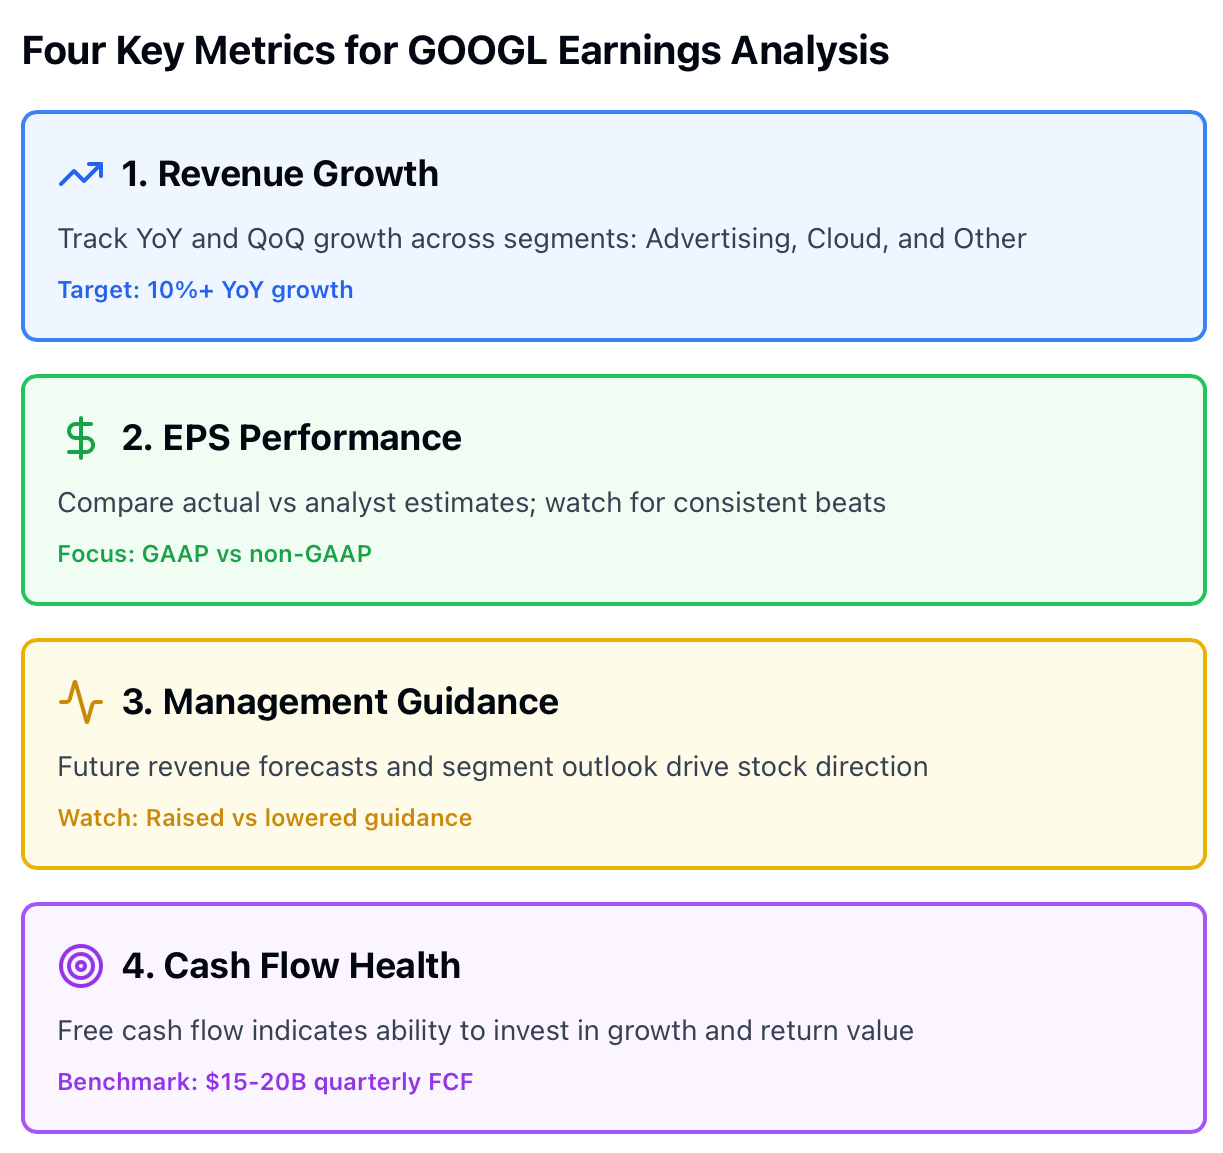
The four key metrics to evaluate success include the Company’s growth through Revenue Growth, Success through Earnings Per Share (EPS), the Company’s future success through Management Guidance, and the Company’s Financial Health through Cash Flow.
These four key metrics form the basis of evaluating and interpreting all Company earnings reports; thus, once you have learned how to properly evaluate these four metrics, it will become easier for you to analyse and understand any other Company’s earnings report as a Financial Analyst would.
As a result of the current AI transformation of the World, the Company called Alphabet has arrived at a Point of Convergence where its traditional Search Engine Business Model is still a very profitable and Cash flow-producing Company, and its current investments into AI provide Alphabet with the foundation of future earnings growth for the next decade.
Subsequent earnings reports will allow Investors to gauge how well the Company is continuing to transition from a Search Engine Business Model to an AI Business Model, and whether increased Competition and Cannibalisation of Existing Revenue will hinder the Company’s ability to produce revenue in the future.
Additionally, earnings week volatility provides unique opportunities for traders. Whether you are trading the actual GOOGL stock or trading the perceived impact of the Company’s earnings reports on Indices like the Nasdaq 100 and Currency Pairings like USD, the knowledge of the Major Key Drivers of the Price Movements provides you with an advantage in Timing and Positioning for your Trades.
The identification of profitable Trading Opportunities through analysis is dependent upon Proper Preparation. Start by Trading Small, Monitor the Accuracy of your Analysis, and Learn through both the Successes and Experiences of Trading before increasing the Size of your Positions through the Development of your Trading Skills.
If you are ready to implement your earnings analysis into Actual Trading, visit tradewill.com and sign up for a Demo Account now. Trade GOOGL earnings with NO Risk, Gain experience and improve your Strategy, and become a member of Thousands of Traders Making Consistent Returns from their Market Knowledge.
Disclaimer: The content of the blog does not represent any position of Trade W, does not serve as any trading-related decision advice, and does not endorse any third-party.