

 Trade W

Here's a question many trading programs will not cover: What if you consistently lose not because of the system you are employing to trade, but rather because your trading system is being used against you?
Most retail traders have some basic assumptions about how to trade. For example, many retail traders believe that, if RSI indicates a reversal, they will be able to ride that reversal and make money.
Alternatively, they feel that if MACD shows that the trend is still in effect, there will be some good follow-through. Furthermore, many retail traders think that if there is a breakout, they will have enough momentum to make money after the breakout. Lastly, retail traders think that support and resistance levels will always hold. Although each of these examples contains some element of truth, they are all incomplete and incredibly costly.
No matter which trading strategy you employ, the ICT (Inner Circle Trader) trading strategy is all about changing the paradigm of thinking. Instead of thinking of where the price will go based on the indicators used, the ICT strategy is more about obtaining sufficient orders to fill an institutional position. By asking this simple question, there is a complete change in perspective.
Market movement is not random; instead, it is a method of gathering liquidity from the marketplace. Thus, as soon as you recognise this, you start to understand the logic behind market movement that previously appeared random or chaotic.
This guide gives you a complete overview of all of the core concepts of ICT, including liquidity pools, fair value gaps, order blocks, kill zones, and multi-timeframe analysis, so that you can begin to see beyond being a liquidity provider and begin understanding where smart money may be heading.
The Hidden Truth Behind Retail Trading: Liquidity Is the Engine
First and foremost, to be able to trade effectively, it is necessary to understand liquidity. Liquidity means different things at different times, depending on demand.
Liquidity is defined as any large group of orders resting in the marketplace, waiting to be filled. Examples include: stop orders, buy or sell orders that are not filled yet, and breakout orders. All of these combined create an area of liquidity; typically, there are going to be several areas of liquidity where orders will cluster.
The reason these areas of liquidity have so much volume of orders is that retail traders all trade with the same methodology (i.e., using support and resistance levels). Therefore, when retail traders place their stop losses below a support level, buy on a breakout above that support level, or sell on a breakdown below a resistance level, this results in numerous orders resting at these locations.
Institutions cannot simply enter into a million-dollar position without causing the market to move against them; as such, institutions need to have enough counterparty orders in the market to complete their trade. Institutions engineer movement in the market until they have absorbed all of the orders located in a liquidity-dense area and then reverse direction.
An ideal example of this type of activity occurs when EUR/USD is quoted above a major weekly high in relation to the previous week. After the EUR/USD broke above the high, a significant number of retail traders were either forced to enter or exit their positions within a very short period of time (i.e., due to market action).
When institutions sold into this large volume of order flow, they created enough liquidity to build a very significant short position without being noticed; therefore, the institution only made a profit once the market reversed.
Think of it like a large truck trying to turn around on a narrow street; just like the truck needs to make room in order to turn around, institutions need to push prices into a crowded space in order to make room for their trades.
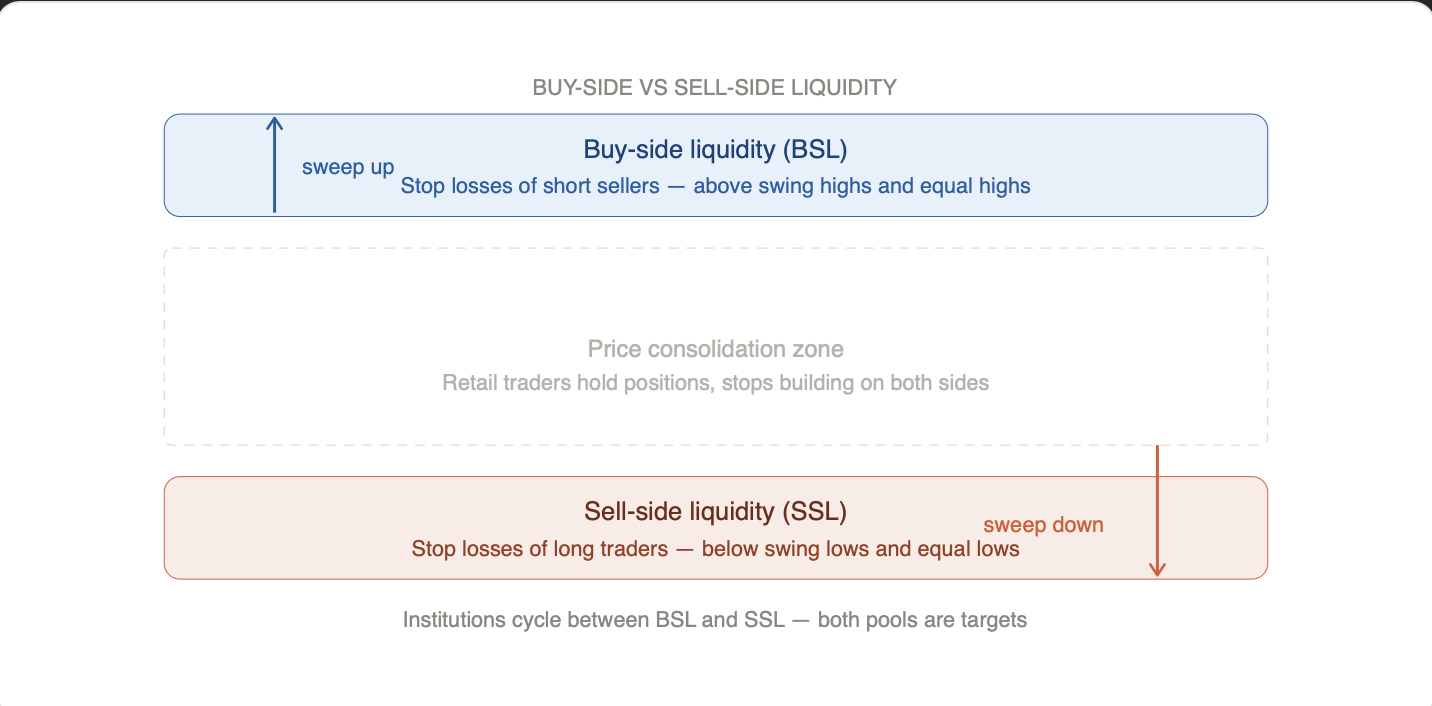
Buy-Side vs Sell-Side Liquidity: The Two Pools Smart Money Targets
The term liquidity, as defined by ICT, can be separated into 2 categories. An understanding of both is crucial.
Buy Side Liquidity (BSL) exists above the market and consists of stop-loss orders from short traders with their Stops located above resistance, previous swing high and equal highs where price has bounced. When price moves through these levels, all the stop orders become buy orders and create the volume that institutions require to close out a long position or to set up a large short position.
Sell Side Liquidity (SSL) exists below the market where long traders have placed their stop orders below support, swing low or obvious equal lows. When the price moves through these levels, it creates a wall of sell orders that the institutions can purchase into.
The markets regularly cycle between SSL and BSL. Price moves up and sweeps BSL for buy orders, and then moves down to sweep SSL for sell orders and so forth. There is nothing chaotic about this; it is very predictable when you stop looking at it through the eyes of the retail trader.
Bitcoin is an ideal example of this. Price breaks above a substantial previous high, retail traders pile in in anticipation of another leg up, and price moves sharply downward within hours. The move was not a failed breakout but rather a purposely designed sweep of BSL.
Market Structure Shift (MSS): When the Trend Actually Changes
There are many instances when the breakout is genuine. The Market Structure Shift concept tells you if the breakout is genuine or not.
Trend analysis is typically straightforward to understand; an uptrend consists of higher highs and higher lows, and conversely, a downtrend consists of lower highs and lower lows. While the advantage of traditional trend analysis is ease of use, the disadvantage lies in retail traders’ treating every break of recent highs/lows as confirmation that the trend will continue; therefore, in reality, many of the breaks illustrate liquidity grabs.
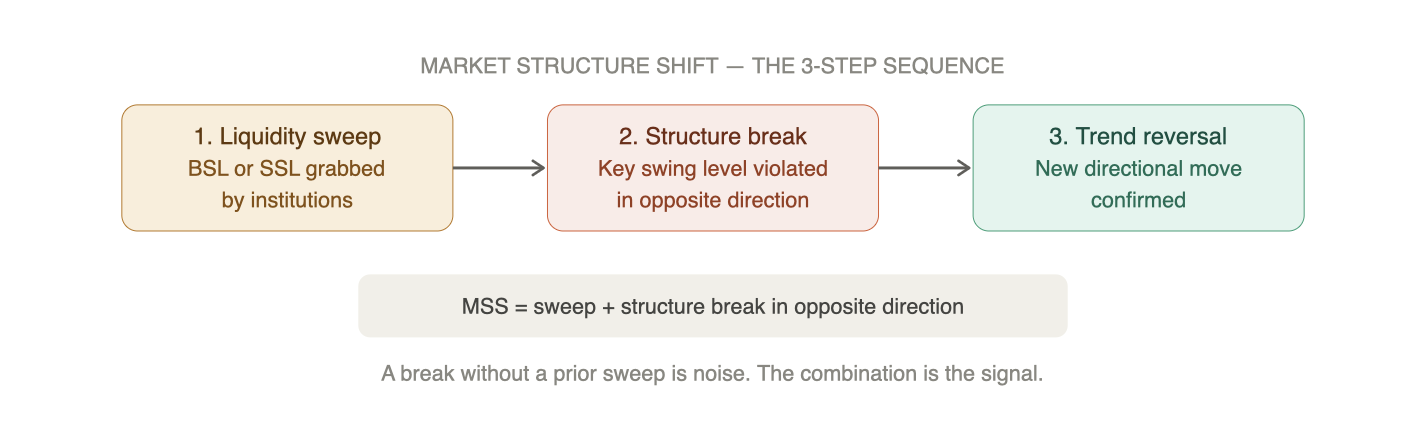
The Market Structure Shift (MSS) provides a filter to the above challenge. The sequence of events ICT traders use to determine an MSS is liquidity sweep first, and then break a key structural level in the opposite direction of the initial liquidity sweep.
When price exceeds a previous high liquidity sweep and then breaks below the most significant swing low structure break, this is considered to be a bearish MSS. The move is not just noise; it means institutions have absorbed all of the buy orders at a price and are now starting to move in the opposite direction.
There are many examples of this on the Nasdaq; for instance, price trades into areas of buy-side liquidity above a recent high, and then, price breaks below an internal key swing low. Please note that traders who are observing the same two-step market structure transition are receiving a much higher quality signal as opposed to those traders who just took the initial breakout.
In short, a structure break without first having a liquidity sweep is much less reliable noise; thus, the combination of a liquidity sweep and a structural break is what counts.
Fair Value Gap (FVG): The Entry Tool That Makes ICT Tick
The Fair Value Gap (FVG) is one of the most common concepts for entering the market in the whole ICT methodology. It cannot be missed once it is seen.
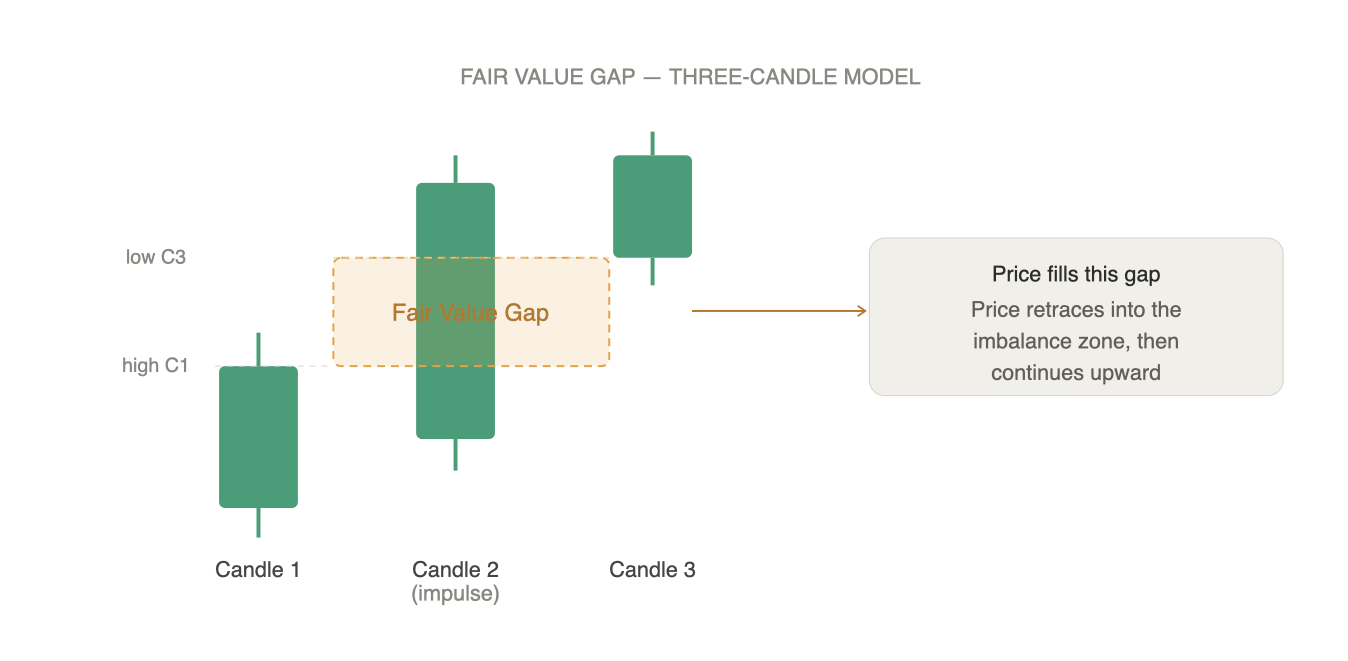
An FVG occurs when the price moves rapidly in only one direction, causing an imbalance in the volume of trading. The classic model is formed with three candles: the first candle, which is an average candle; the second candle, which is very large and an aggressive impulse candle; and the third candle, which occurs last.
The gap in price between the first candle's high and the third candle's low will determine whether there is an FVG. As previously stated, price moves very quickly through that area, and therefore, there are no real transactions taking place in that area.
The market is generally more efficient than inefficient; an imbalance creates a sense of gravity for the price to return to the FVG zone and "fill in" the gap before continuing the original trend. Thus, this is generally where ICT traders will look for their potential trade entry.
In the example of pouring water into a container at different rates, the water spreads out in different directions until it reaches a balance. Similarly, price behaves this way.
During the New York session, for example, there could be a bullish impulse move on Ethereum that creates a fair value gap on the 15-minute time frame. If this occurs, ICT traders will wait for the price to return to the gap before placing their trades. It is best if the returns into the gap also coincide with a supporting order block or Fibonacci retracement level.
Order Blocks: Reading the Institutional Footprints
OrderBlocks give you the area where Institutions actually placed their orders and where Price left an imbalance from the previous FVG!
An Order Block is the last bullish or bearish candle before a major institutional move in the opposite direction. That candle represents the last delivery of orders before the smart money Position was entered. Institutions typically return to these levels to add to their Position, thus creating future Support and Resistance areas with a high degree of reliability.
It is simple logic; if a bank puts in a large short position from a defined price zone and then the price moves away, the bank may want to short additional shares when the price returns to that price zone. Hence, the previous zone becomes a "magnet".
Order Blocks work best when combined with a prior liquidity sweep. For example, in the Gold market, price may sweep a prior high, taking out BSL's, print a bearish MSS and then retrace to the last bullish candle, followed by that major drop. That last bullish candle is considered the Order Block. The area where the most likely short entries will take place.
Think of footprints left in wet sand; once the tide is gone, those footprints will remain. Order Blocks are Institutional Footprints that we will notice if we know what to look for.
Optimal Trade Entry (OTE): Fibonacci as a Precision Tool
Now that you know how to identify a liquidity sweep, market structure shift, and an order block or fair value gap (FVG), the optimal trade entry helps you pinpoint the precise entry, as opposed to relying on guesswork to place a trade within a broad range.
Traders who follow the ICT methodology utilise the Fibonacci retracement tool, but not according to the traditional textbook levels. Using the Fibonacci model, the OTE zone is identified using the 0.62 and 0.79 levels, and the preferred retracement level is 0.705. Anytime price retraces to this level after confirming a structure shift, this is considered the optimal time to execute a trade.
Great probability ICT setups combine all 4 of these concepts: liquidity sweep, market structure shift, retrace directly into FVG, and execution immediately inside the OTE Fibonacci zone. The more confirmations you accumulate before executing the trade, the higher the probability of success you will have.
As an example, USD/JPY may execute a sweep of the BSL by taking out the swing high, then break the swing low (MSS) and retrace to the 0.70 level, where a bullish order block is located. When these two variables come together, they form a "model" for an ICT trader. As a result, the probability will be much greater than if you only had one of these two signals.
The best way to visualise this idea is when a rubber band is pulled tightly in one direction. The rubber band will snap back some from the extreme before moving in the desired direction again. The OTE zone captures the point where the rubber band snaps back.
The Asian Range and ICT Kill Zones: When Institutions Move
You have the first half of the trade planned with knowledge of what you'll be trading, now you need to know when to trade that plan for success with the ICT strategy!
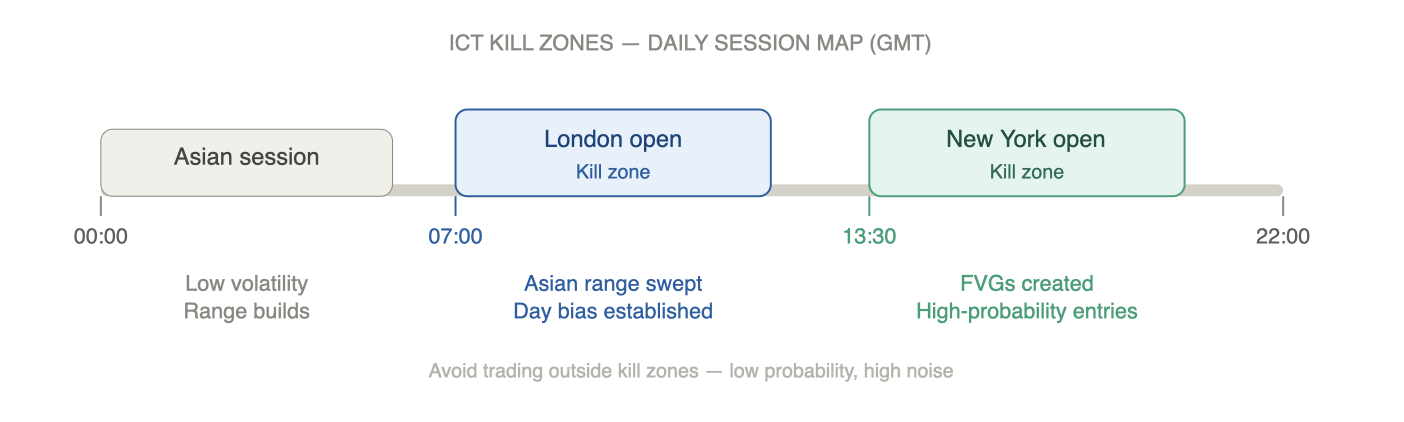
The Asian trading session has low volatility by design. Prices tend to consolidate and build ranges during these hours. The range formed during the Asia session is not a random occurrence. Rather, this range will be the target for traders in the London session who will open a few hours after the Asia session closes.
In terms of GBP/USD, the price at the London open will often break out of either the high or low created during the Asia session prior to establishing the true direction of the market for the day. This breakout of the Asia range at the time of the London open is a liquidity grab, and the price movement caused by this liquidity grab represents one of the most popular entries into the market.
The ICT Kill Zones are specific times of the day when there are high levels of activity for the institutional trading algorithms. Specifically, the London and New York open represent the two most significant kill zones. These are not "volatile" times of day; they are the times of day where there are the largest position adjustments, where there are FVGs created, and ultimately where the daily bias is created in the market.
The ICT trader is also looking at the Midnight Opening Price for assistance in determining a possible directional bias for the session. If the price opens above or below the Midnight Opening Price, there is an added level of confirmation that can be used to filter which setups may be considered for execution.
Multi-Timeframe Analysis: Top-Down Always Wins
Verification of any concept in ICT is established by multiple timeframes, increasing the reliability of that concept. Thus, top-down analysis must be utilised for any accurate analysis.
To complete this workflow, you begin by examining the daily chart to identify the directional bias of the instrument being traded. For example, does price operate within a bullish order block? Does price operate within a bearish MSS? What is the structure of the price on the weekly timeframe?
Once the directional bias is established, you move to the one-hour chart to develop the current market structure while determining the key FVGs or order blocks located within the daily range, then you step down to the five-minute chart to identify the exact entry and whether that will be made by way of a pullback to a FVG or touch of an OTE zone.
Trading a bullish five-minute chart when the daily is bearish is AGAINST the river flow; however, you may get lucky a few times, but the river usually wins!
For example, for someone trading Bitcoin, you may establish a bullish daily bias because the price is above a significant daily order block, you may also find a clean MSS on the one-hour chart because of a BSL sweep; therefore, you may take a long-or position from a five-minute FVG retracement. By taking this trade, you have confluence across three of your desired timeframes, which dramatically increases the probability of success.
Planning a road trip is much the same. You start with a big map, then you proceed to look at a city map, and finally navigate your final destination street-by-street.
Common ICT Mistakes to Avoid in 2026
The ICT is a powerful system that can be easily misapplied.
The first error traders make is using it as a rigid checklist instead of as a concept through which we view charts. Traders know the difference between "FVG" and "OTE" but have no understanding of why the price should retrace to the reference points. Therefore, when the setup does not look exactly as expected to them,m they will make mistakes or force entries.
The second error traders make is ignoring macroeconomic events. For example, no order block or FVG will hold through a surprise CPI print. In general, al when there is high-impact news released, the price will go through every technical level without thinking about it again.
Look at the way Bitcoin traded around FOMC announcements or GBP/USD traded around UK inflation data; all of these setups are wiped out in minutes by news. Therefore, you should either avoid trading around news or factor it into your trade bias before the news is released.
The third error traders make is overfitting their criteria. Traders will go back and find many examples of perfect ICT setups on charts that would have worked perfectly. In real-time, there will always be more noise on the chart than you would expect. Overfitting historical data gives falsely inflated confidence. Trade the valid model you can see at present rather than the model that appears perfect using historical data.
First and foremost, risk management is what will allow you to stay in the game. No matter how well an ICT setup is constructed, it will still fail at times. If you are risking only 1 to 2% of your account on each trade, you won't get wiped out due to several losses before your edge works itself out over time.
FAQ
What is the ICT trading strategy? It's a methodology that focuses on how institutional traders move prices to collect liquidity. It uses concepts like liquidity pools, market structure shifts, fair value gaps, and order blocks to find high-probability trade entries.
Is ICT suitable for beginners? Yes, but start with the fundamentals first. Understand basic market structure and risk management before layering ICT concepts on top. The framework rewards patience and study.
Does ICT work in crypto markets? Yes. Liquidity sweeps, FVGs, and order blocks appear consistently across Bitcoin, Ethereum, and most liquid altcoins, especially during London and New York sessions.
Ready to apply the ICT strategy with real-time market context and structured trade planning? Build your edge at Tradewill.com — where institutional-grade analysis meets trader-first tools.
Disclaimer: The content of the blog does not represent any position of Trade W, does not serve as any trading-related decision advice, and does not endorse any third-party.