

 Trade W

Why the Inverse Head and Shoulders Pattern Matters
If you have watched a price chart drop significantly and wondered when it would turn around, you are not alone. Finding the trade reversal is one of the most difficult things traders face when trading stocks, forex, and CFD. If you miss the signal, you’ll be holding a losing position; if you catch the signal early, then you can ride the trend to the bottom.
The inverse head and shoulders pattern is a helpful signal for finding reversal trends. When the inverse head and shoulders pattern is forming after a downward trend, it is signalling to traders that selling has slowed down, and buyers have begun to gain control of the market.
This guide will provide you with all of the information you need to learn how to identify the inverse head and shoulders pattern, how to understand the psychology behind the inverse head and shoulders pattern, how to place your trade at the correct entry point and exit point, and how to manage your risk like a pro. The guide also contains real examples of the inverse head and shoulders pattern on Bitcoin, major currency pairs, and stock markets that you can use to apply the information immediately.
The inverse head and shoulders pattern is not just theory, it is a practical tool that can help you tremendously when searching for reversal signals, and you can also increase your trading results.
What is the Inverse Head and Shoulders Pattern?
TheInverse Head And Shoulders is a bullish reversal pattern that forms on the price chart following a downward trend. It has 3 consecutive lows, which are referred to as the left shoulder, head, and right shoulder. The 3 points all have roughly the same size and distance apart, but do not have to be perfectly symmetric for this pattern to be valid.
The parts of the pattern are as follows:
-
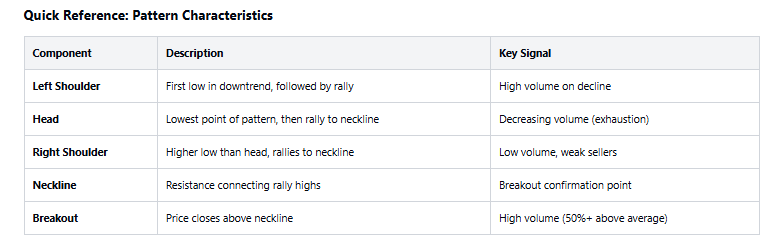
Left Shoulder: Price declines to low, then goes back to rally.
-
Head: Price falls under left shoulder to create the lowest point of the formation, then later goes back up.
-
Right Shoulder: Price drops below the point of the head, but not to the point of the lowest head, then rallies to the neckline.
-
Neckline: The line that connects the highs of both left shoulder to head and head to right shoulder. When price breaks above the neckline, this serves as confirmation of the pattern.
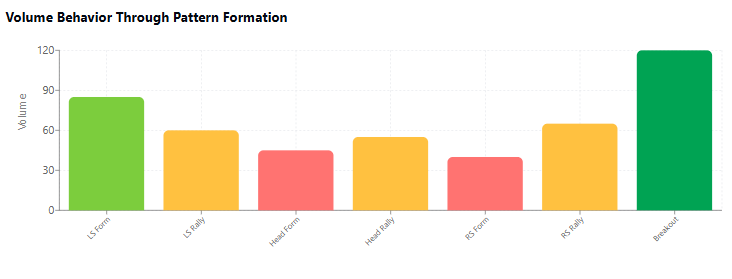
Volume is an integral part of the formation; volume typically decreases when the head forms (suggesting that selling pressure has been exhausted), whilst volume will increase dramatically when price breaks above the neckline (suggesting a return of interest in buying).
It's okay to have an inverted head and shoulders pattern that doesn't completely fit the textbook definition because all markets are chaotic in nature. This means that the right shoulder could be slightly higher or lower than the left shoulder, likewise, the neckline could either slope up or down. The key is to consider the pattern's overall structure along with what it represents psychologically.
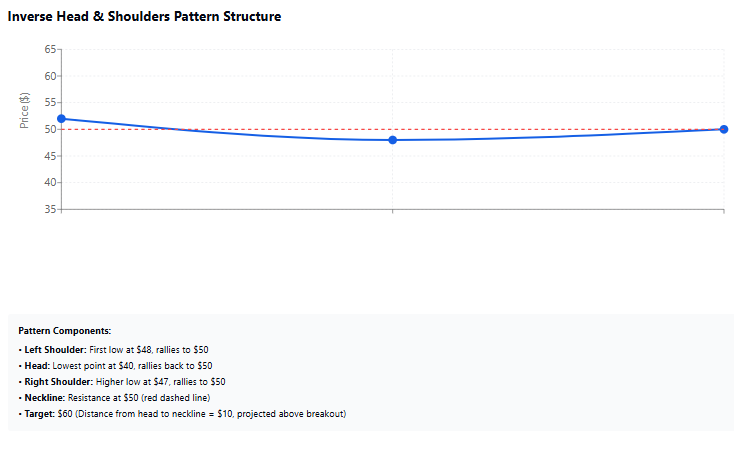
To understand it better: think about the game console price drop over three weeks - Week 1 has a low of $45 & a high of $50. The second week has a low of $40 & high of $50. The third week sees a low of only $47 & a high of $55; This is an example of an inverse head & shoulders pattern occurring in reality.
A good professional example would be the 2018/19 Bitcoin price reversal which was very clearly represented by an inverse head & shoulders pattern on the daily chart. BTC/USDT's "head" formed at $3,200 and the "shoulders" formed at about $3,500. As soon as BTC broke through $4,200 (the neckline), it rose more than 200% in the months after that.
The Market Psychology Behind the Pattern
To grasp why this is true, we must examine the minds of traders who created the Inverted Head and Shoulders Pattern, observing how they reacted to changes in the market through the production of each section in the formation. Traders & Investors create the formation by placing their collective perspectives into the following areas of the chart:
The Left Shoulder: Traders were experiencing Panic Selling due to the bearish trend continuing as it was creating new lows, allowing the traders to reach their highest level of pessimism. A small group of traders recognized value as prices began to rally or buy the dip, however this was not enough to turn around the trend.
The Head: The Selling Pressure accelerated to the lowest price point with maximum level of capitulation. At this price level, the volume had decreased since the remaining sellers were considered less reliable. These lower prices had pushed out most of the weak sellers. When Buying began at this point the decline would exhaust itself.
The Right Shoulder: As the market re-established the price to lower price levels, the Sellers continued to lose momentum, resulting in the price being significantly above the low created during the Head. Following this consolidation, the Buyers exhibited further confidence due to the lesser selling pressure encountered and were willing to participate in more significant rallies.
The Neckline Breakout: This is when the Price Action crosses above the Neckline and reaches strong volume. Traders who were not involved in the market had confidence that buyers were going to win the struggle against sellers. At this point, the market had reversed its trend from Bearish to Bullish.
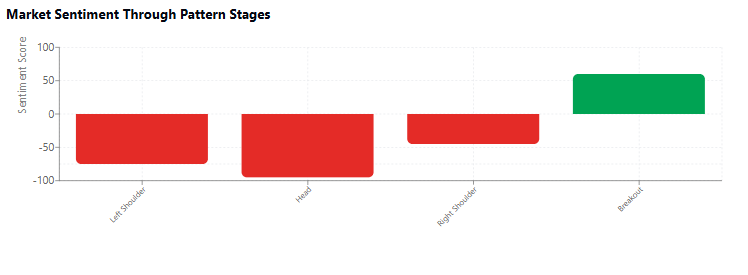
To put it in context of our console gaming system, the initial price dip prompted the consumer market to panic and sell their console devices to purchase the newer models. Following this, there was an even higher panic response (preceding the second price drop), as a rumor developed concerning an upcoming new console model; therefore, consumers sold as many old consoles to buy as many newer ones as they could, resulting in maximum fear/anxiety throughout the consumer market at that time.
The third price dip did not generate as large a panic response/consumer reaction as did the first two; however, once the consumer’s perception of the incoming new model changed, and became reality, demand & supply returned to the market, causing the market to settle down.
With regard to the BTC 2019 reversal, head of the formation $3,200 was the peak fear (panic) following the 2018 collapse. Because BTC did not break and set any lower lows during the right shoulder region, and instead broke and closed above $4,200, it was interpreted as the formation of accumulation occurring, indicating that the bear market is over.
How to Spot an Inverse Head and Shoulders Pattern
Recognizing this pattern on genuine charts takes time to develop however, once someone identifies the characteristics, the actual identification becomes very straightforward.
Step 1: The first step is to identify a distinct downtrend leading to the inverse head and shoulders pattern as a reversal method.
Step 2: To evaluate the three consecutive lower lows, the chart must be examined for a series of lower lows where the three consecutive lower lows are separated by the "head" with their height being significantly lower than both previous lower lows.
Step 3: Next, you must draw a line between the top of the left shoulder and the "head" and the highest point between the head and right shoulder to create the neckline. There may be some variability between the height and widths of the right and left shoulders, however, it is not critical that these heights and widths be identical. The right shoulder should not fall below the head.
Step 4: Finally, you should monitor volume as it will normally decrease through the formation of the head and should increase when the neckline is broken. This indicates that the selling pressure has been exhausted and/or there is renewed buying interest.
Step 5:The head and shoulders pattern can be identified in any timeframe (e.g., 15-minute charts for day traders, daily charts for swing traders or weekly charts for position traders). Longer timeframes typically provide more reliable signals.
Don't sweat the small stuff: The head and shoulders pattern may not always look perfect. The shoulders may not always be perfectly symmetrical, and the neckline may not always be horizontal. Even an imperfectly shaped head and shoulders pattern can provide an opportunity to make money in the stock market.
One tool to track stocks: If you have tracked the daily high and low prices of a stock for two weeks, you could be tracking the pattern emerging on your stock chart using a table format. For example, you could list out the daily high and low prices, as in the following: "Lows: $50, $45, $52, $40, $47"; "Highs: $55, $50, $54".
A practical example: The EUR/USD currency pair (1-hour chart time frame) during a recent major reversal is a perfect example of the emergence of many head and shoulders patterns at significant support areas. This type of price action is repeated as trader psychology remains constant across all types of market conditions, including long-term trends and short-term corrections.
Trading Strategy: Entry, Exit, and Targets
To win with a trading strategy once you know your price pattern, make sure that you have clearly defined where you will enter your trade, where you will put your stop-loss, and what your profit target will be.
Buying the Setup After A Breakout: At some point after the stock or ETF has broken above the "neckline" level of the pattern, you must decide if you want to buy when that occurs, or if you want to wait for the price to pull back to test the neckline area as support. Both approaches will work. However, if you wait for the "pullback" confirmation of the support area established at the neckline of the pattern, you will have a better risk/reward ratio than the first approach.
Stop-Loss Placement: Regardless of the aggressive or conservative entry approach, you should either place your stop-loss just below the right shoulder for an aggressive strategy or just below the head for a conservative strategy. The head stop-loss placement provides more leeway; however, you will need to adjust your position size substantially larger to accommodate your proper risk percentage.
Profit Target Definition: To calculate your profit target for an inverted H&S pattern, estimate the vertical distance between the head and neckline of the formation and add that distance up from the price breakout of the neckline. For instance, if the head is at $40 (below neckline) and the neckline was at $50 (above neckline), the projected profit target would be $60 (the breakout price of the neckline).
Volume Confirmation for Breakout: A price breakout is only considered valid if the breakout occurred on above-average volume. Low-volume breakouts typically signal that the price broke out due to a false breakout event, resulting in whipsaws. If you see a stock price breaking out but the decreased volume associated with the move, look for confirmation before taking a position or pass altogether.
Risk-Reward Ratio: The Risk-Reward Ratio should be at least 1:2 (1 to 2), meaning your expected return on every dollar of risk must be at least Double. For example, if you are willing to risk $5 per share with a Stop Loss, your Profit target should be at least $10.
This method works in every type of trading market. For instance, in currency trades (FX), if you were trading the Euro/Dollar and the price broke above the neckline at 1.1200 after forming a Head at 1.1000, your price target would be 1.1400. Or in Cryptocurrency, if you bought Bitcoin, and it broke above $45,000 after the Head formed at $40,000, your price target would be $50,000.
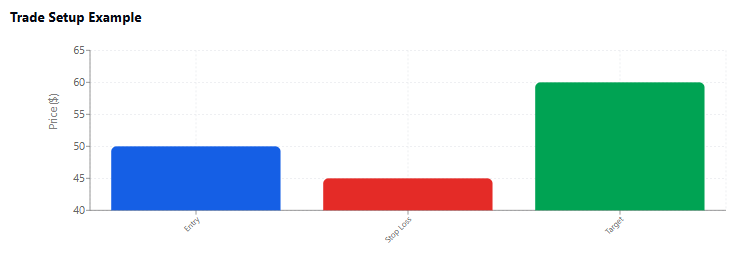
Let's say you had a $1,000 account and were Paper Trading. You found a stock that has formed an inverse head and shoulders, with the Head at $40.00, and the neckline at $48.00, so you buy shares at the time of the breakout. If you used a stop/loss order at $45.00 (right shoulder) and you risked $3.00 per share, your target profit is $8.00, resulting in a target of $56.00 (which means you would have gained a total of $264.00 profit).
Be careful about false breakouts. Sometimes the price can break above the neckline and hit the buy-stop triggered by the break, then quickly reverse downward. That's why it's important to confirm with volume and wait for candle closure above the neckline line.
Combining Indicators for Higher Accuracy
The inverse head and shoulders pattern creates an extremely reliable signal. However, pairing it up with technical indicators greatly minimizes false signals, increasing your probability of success.
Relative Strength Index (RSI): If you see the pattern forming and notice that there is an RSI reading below 30, this would indicate that there was extreme selling pressure and would further confirm the potential reversal. When the price breaks above the neckline of the pattern and the RSI crosses above 50, this would validate that there had been a momentum shift from bearish to bullish.
Moving Average Convergence Divergence (MACD): When the MACD crosses above the signal line (bullish crossover), this indicates that the momentum is beginning to shift from bearish to bullish. It also creates a positive divergence.
Moving Averages: When price crosses above significant moving averages (e.g., the 50-day or 200-day moving average) just before the breakout of the neckline, it adds significant strength to the existing bullish signal if there is alignment of multiple time frames.
Volume: In order to increase the reliability of your entries, confirm that you have a breakout with high volume, which should ideally be 50% above the 50-day moving average, as opposed to a decline in volume.
Cryptocurrency traders typically require high levels of volume and RSI due to the extreme volatility of this market, while Forex traders typically use MACD and moving averages to provide smoother moving averages.
In this student simulation, you see an inverse head and shoulders pattern developing in the demo account. When the head is created, the RSI reads 28, which is considered to be oversold. As the right shoulder takes shape, the RSI rises to 45. When the price passes the neckline, the RSI crosses over 50 and the MACD has formed a golden crossover. At this point, there has been a 70% increase in volume compared to its average, providing additional confirmation for entering this trade.
Professional traders trading Bitcoin may also utilize three moving averages on their daily charts, specifically, the 20, 50, and 200-day moving averages. When BTC creates this pattern and breaks above all three moving averages, that also provides powerful confirmation of a signal.
Risk and Money Management
The best trading strategy does not guarantee perfect trading success. Only those who have a solid risk management strategy become long-term profitable traders; others give up their trading capital quickly with poor risk management.
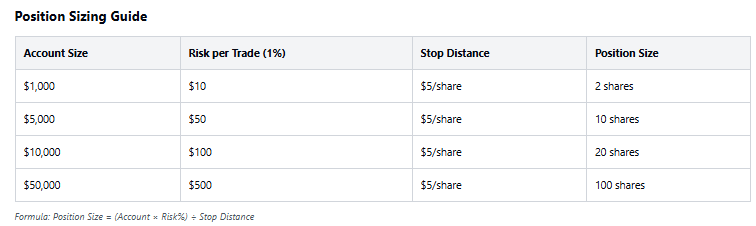
Position Sizing: When determining how much money to allocate to a particular trade, never risk more than 1-2% of your total account. Your position size is determined by the amount of risk you are taking and the distance to your stop-loss. If your account balance is $10,000 and you want to risk $100 (1%) on a single trade, if your stop-loss is $5 away from your entry point, you could buy 20 shares.
Stop-Loss Discipline: You should place your stop-loss order and not move it unless the trade moves in your favour. A trader who moves their stop to "give the trade more room" is likely to lose more money than if they did not adjust their stops.
Risk-Reward Ratio: You should take trades that provide at least a two-to-one ratio of potential profit to risk. If this condition is met, you can be correct only 40% of the time and still make a profit from your trading.
False Breakout Management:If a stock price breaks through its neckline, and immediately reverses direction on high volume, sell it immediately. Do not hang on to it and "hope for a rebound". False breakouts occur, and making quick exits from losing trades is essential.
Scaling Out: Scaling Out using a two-pronged approach will help you profit from your investment while also allowing for the possibility of future price increases.
In regards to Emotional Discipline, it is as important as Technical Skills when financing and trading financial products. Following through with the Trading Plan you have developed is imperative. Traders should not enter "after the fact" trades (trading for the purpose of attempting to recover from a loss).
As an example of this process consider an investment of 5,000 USD in the cryptocurrency market. You spot an inverse head and shoulders formation occurring with Ethereum (ETH) at the 2,000 USD mark for entry, the stop price at 1,900 USD, and the target price at 2,200 USD. You are willing to risk 100 USD, which represents 2% of your account value, thus purchasing one entire ETH (value of 2,000 USD).
If your stop is triggered, you will have lost 100 USD. If you reach your target, you will have made 200 USD, giving you proper risk management (the market is now moving up by 200 USD to give you a return of 2:1 on your investment).
Professional traders who have survived the 2022 reversal of the Crypto Market by maintaining tight stops and small positions. When a pattern is unsuccessful and/or does not continue, the amount lost on that position is minimal. Conversely, should that pattern prove successful, the profit is considerably larger than the amount at risk leading to a compounding benefit for the trader. This compounding effect is what creates profitability long-term in trading.
Historical Performance and Success Rates
The Data are important! Let's look at the historical performance of the Inverse Head and Shoulders across the four major markets.
The Inverse Head and Shoulders has been shown to have 60-70% success rates based on confirmed volumes, as seen in the stock market. If you measure from the neckline to the target price, you can expect to earn approximately 25-40% profit on your money, however this can vary depending on market conditions at the time as well as your trading time frame.
In approximately 20-30% of cases, customers have reported false breakouts after breakout. Because of this, it is very important to use stop loss orders. If customers experience a failure with the Inverse Head and Shoulders, then they usually have enough time to get out with minimal damage as most failures occur during the first few days following the breakout.
The most consistently profitable Inverse Head and Shoulders patterns within the Forex market occur on longer time frames: daily and/or 4-hour charts. The shorter-time frames generally produce more erratic and "noisy" price activity, leading to more false signals.
The Currency Pairs that consistently respect Technical Analysis Lines, such as the EUR/USD and the GBP/USD pairs tend to produce patterns that have more reliability than Exotic currency pairs.
The Cryptocurrency market creates the Inverse Head and Shoulders pattern frequently because of their high volatility levels. Since 2017, Bitcoin has produced countless examples of Inverse Head and Shoulders patterns. Patterns that formed on the weekly time frame tend to have the most significant follow-through movements, with some patterns creating more than 100% gains over time.
Assuming you have traded 100 trades following this same pattern with strict rules (i.e., trade volume confirmation, stop loss use and targeting the measured move), you may have had 65 winning trades with an average profit of +30% and 35 losing trades with an average loss of -10%. This would be considered a winning trading system.
The stock market bottom in 2020 formed a huge inverse head and shoulders pattern on the S+P 500 Weekly chart when it rose from 2200 in March to approximately 2400, then broke out of the head and shoulders formation at 3000 to rise over 3600, reaching its measured target.
The 2019 reversal of Bitcoin's price is another excellent example of this pattern. The entire pattern took 4 months to form, during which time the head of the pattern was created at approximately $3200 in December of 2018. Once the price broke above $4200 in April of 2019, it rose to $13800 by June 2019. Anyone who properly identified this pattern and traded it would most likely have experienced a life changing significant profit.
Advanced Strategies and Variations
After you master the introductory techniques of trading using patterns, the following advanced techniques will help you to enhance your pattern trading edge.
Up-Sloping Neckline Patterns: Most traders associate horizontal necklines with a trend; however, it’s important to understand that there are many upward-sloping neckline patterns. An upward-sloping neckline indicates the buyer's strength and will often create explosive price moves during the breakout phase. A downward-sloping neckline indicates less strength, but if it is supported by higher volume, then it could still validate a breakout.
Double Reverse Head and Shoulders Patterns: Sometimes you’ll see two head-and-shoulder patterns form back-to-back, which can provide an incredible entry point into a bullish trend, but they’re rare to spot. These patterns typically happen at the bottom of major trends; therefore, you should take note of them.
Combining with Buy/Sell Zones: The best time to enter into a trade is when the pattern forms at a major support or buy zone. If a head-and-shoulders pattern is forming at a major buy zone, for example, the chance of you being able to make a significant return on your investment increases significantly if you take the trade.
Integrating Trendlines: Create trendlines linking the highs created while forming the pattern. When there is a break out of the neckline and the downtrend line, you have verified two signals of the same pattern.
For instance, EUR/USD may form an inverse head and shoulders on the 4-hour chart with a neckline at a level of 1.1200.
Checking the daily chart, you discover that price is also breaking above the daily 50 MA at the same level. Looking at the weekly chart, you see that price is not in a strong downtrend. You now have three timeframes providing signals that greatly increase the likelihood of a correct trade.
In backtesting / simulations you might practice this pattern with a sloping neckline (the right side of the neckline is above the left side) as you often see in trends. Typically, the breakout would happen sooner than in the case of the horizontal neckline, so your entry strategy would need to be adjusted.
Many professional traders will also use Fibonacci retracements as a combination to this pattern. If the neckline coincides with the Fibonacci 61.8% retracement from an earlier swing high, that is a very strong confirmation.
From Theory to Practice
At this point, you have learned everything there is to know about the inverse head-and-shoulders pattern, including how to identify it, why it occurs in the marketplace, the method of trading the pattern, and how to manage your risks. The next step is to actually apply what you have learned.
The first step to applying your knowledge of the inverse head-and-shoulders is through practice on historical charts. Open your trading platform (MetaTrader 4 or other platforms) and scan through major currency pairs, stocks, or cryptocurrency. Identify previous completed patterns, and document what happened with those patterns after the breakout. The practice of recognizing patterns that are historical is a long-term asset to a trader.
After you have finished your historical chart reviews, you can now move on to "real-time" pattern recognition. Set alerts (email, SMS), or other notifications for any potential patterns you have identified from your historical research, as they occur on your watch-list. As you see a pattern starting to develop, follow the pattern through completion, taking note of volume patterns, structure formation, and any confirmation signals from your indicators.
Before you begin trading real money, use a demo account. Conduct 20-30 trades on a paper-trading basis, following all of your trading rules: volume confirmation must occur; a stop-loss must be established; and a profit target must be established. Keep track of all of your actions/results. You will learn just as much from losing trades as you will from winning trades.
Once you have a consistent profit stream with your simulation testing, you can begin trading live money in small amounts. Start with a risk of only 0.5% - 1% per trade, and gradually increase your position size as your confidence builds.
Keep in mind that there is no pattern that will work all of the time. Even if you know exactly what a pattern is and what the market is doing, the market can still surprise you sometimes. For this reason, by combining a pattern with volume analysis, trend context, and technical indicators, you will see the best results. A risk management system gives you the tools you need to keep your losses small when you're wrong and allow your profits to expand when you're correct.
The inverse head and shoulders pattern has assisted many prominent traders in recognizing significant reversals in the market. By implementing proper practice and discipline to implementing the pattern, it will provide one of the best opportunities to successfully capitalize on track trends towards their respective reversal.
Are you ready to learn about using your pattern recognition skill? Visit TradeWill.com to access an advanced charting system and access to a community of traders that are building their technical analytical skill set together in real-time.
Disclaimer: The content of the blog does not represent any position of Trade W, does not serve as any trading-related decision advice, and does not endorse any third-party.